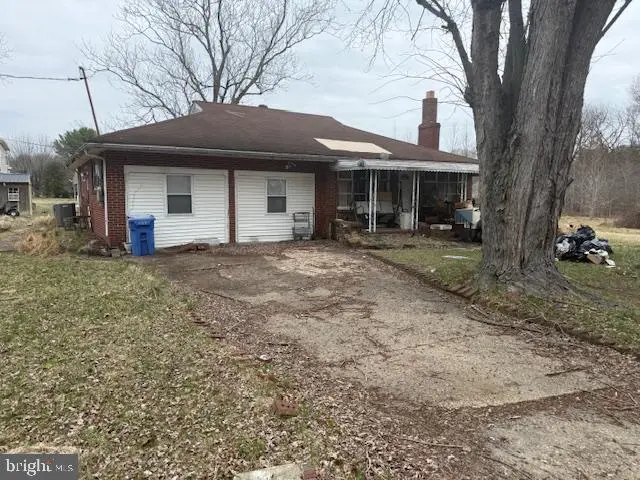
151 Peace Ln · Glassboro, NJ
Flood risk 1/10 · Minimal
- FEMA flood zone
- X (unshaded)
- Chance of flooding over 30 yrs
- 0.0%
- Est. flood insurance / yr
- $507 – $1,088
Fire risk 1/10 · Minimal
- Est. fire insurance / yr
- $526 – $976
Heat risk 6/10 · Moderate
- Hot days now (above 102°F)
- 7 days/yr
- Hot days in 30 yrs
- 15 days/yr
Wind risk 6/10 · Moderate
- Chance of severe wind over 30 yrs
- 56.0%
Air-quality risk 3/10 · Minor
- Unhealthy air days now
- 2 days/yr
- Unhealthy air days in 30 yrs
- 5 days/yr
Risk factors via First Street. Map © Google.
Why this score? — see what drove the C+ grade
The composite is a weighted blend of 9 inputs, each scored 0–100. Each bar is that input's sub-score; the figure is the points it added to the 100-point composite (weight × sub-score).
- Cash flow +27.1/30.0
- DSCR +9.4/10.0
- 1% rule +8.0/10.0
- ARV discount +6.9/15.0
- Livability +4.0/5.0
- Rent growth +3.7/5.0
- Condition / age +2.5/5.0
- Schools +2.0/10.0
- Appreciation +0.0/10.0
$199,000
🖨 Deal sheet 📄 Offer letter ✓ Due diligence
Listing remarks
Three bedroom one bath ranch available. Included is two deeded lots that may be subdividable. This home needs a total rehab.
Key facts
- Subdividable
- Deeded lots
- 7,449 sq ft lot
Tags
Neighborhood map
What this means for you Summary
Snapshot
- This is a 3-bed/1.0-bath single-family listed at $199k.
Deal economics
- At list price, monthly cash flow is $563 ($7k/yr) — positive.
- The deal already cash-flows at list — no discount required.
- Meets the 1% rule at list price ($3k rent vs $199k).
- Recommended offer: $193k (3.0% below list) — sets the bar for market timing.
- Cap rate 9.7% vs local median 4.5% in Glassboro — top-decile yield for the area; either an underpriced asset or a hidden risk that comps aren't pricing in. Stress-test before assuming the spread holds.
Location & tenants
- Location reads 81/100 on livability (#57 in NJ, #1,498 nationally) — a professional / high-income tenant draw. Strengths: commute A+, housing A+, health & safety A+; Watch: schools D+, cost of living D-.
- Glassboro School District (suburban): math 10% / reading 33% proficiency, ranked #412 of 472 in NJ (top 87%) — low school quality limits family demand, transient renter base, plan for 1-2y turnover.
- Market conditions: Rents rising fast (+4.6%/yr); 75 active listings in the ZIP; 5 comparable units currently listed for rent nearby; rentals at typical pace (median 19d on market — plan ~3-4 weeks tenant-placement turnaround); solid renter incomes; 1,047 units permitted in Gloucester County in 2024 (183 in 5+ unit buildings).
- This rent runs 35% of the median local income ($89k/yr) — at the standard rent-burdened threshold; future hikes will face affordability resistance.
Forward outlook
- Local home prices are declining (-3.0%/yr); year-one equity from $1k of loan paydown is wiped out by about $6k of value loss. Plan a longer hold.
- Gloucester County population projected to shrink 5% by 2050 — rents likely to lag national; underwrite the cash flow, not the appreciation.
- At projected returns (-3.0% appreciation + 4.6% rent growth), your $56k cash investment doubles in ~8 years — after that, you're playing with house money.
Negotiation context
- It's been on market 39 days — a 3% lower offer ($193k) is reasonable based on typical stale-listing flexibility.
- 4 sale attempts since 11y ago with the ask held roughly flat each time — persistent listings suggest the price (not the market) is what's stuck; bring a comps-based counter.
- Current owner paid $155k; 28% above their basis — modest negotiation headroom, anchor on the comps not their cost.
Risks & watch-outs
- Climate carrying-cost: major wind risk, 56% chance of damaging wind over 30y; extreme-heat days projected 7→15/yr by 2055 (HVAC capex compounding) — expect insurance premiums to compound above CPI over the hold.
Questions for the listing agent
- It's been on market 39 days. Have you received any prior offers? Is the seller open to a 3% concession, seller financing, or rate buy-down credit?
- Built in 1962 — when were the roof, HVAC, electrical panel, plumbing, and water heater last replaced?
- Is there a deadline driving the sale (1031 exchange, divorce, estate, relocation)? That informs how much negotiation room exists.
- Schools are D-rated, which usually means shorter tenancies and higher turnover. Who's the typical renter profile here, and what's been the actual vacancy rate?
- What's the average days-on-market for RENTAL listings here right now (not sales)? A rising rental-DOM trend means longer vacancies and softer asking-rent achievability than the comps imply.
- What's the recent tenant-quality profile in this submarket — average credit score on applications, eviction rate, late-payment / NSF rate, and stable-employment percentage? A property-management company in the area should have these aggregated.
- How much new for-sale + rental construction is in the pipeline within 1–3 miles? Heavy new supply typically softens prices + rents 12–24 months out; constrained supply supports both.
Investment metrics
- 1% rule
- 1.30% ✓
- Cap rate
- 9.69%
- Cash-on-cash
- 12.12%
- DSCR
- 1.54
- GRM
- 6.4
CMA / ARV
- ARV (on-the-fly)
- $196,560
- Comps found
- 5
Show comp detail 5 sales within ~0.75 mi
| Address | Dist | Beds/Ba | Sqft | Sold | Price | $/sf | Match |
|---|---|---|---|---|---|---|---|
| 230 Peace Ln | 0.15mi | 3/2.0 | 960 (-11%) | 12mo | $307,450 | $320 | 61 |
| 301 Martin Luther King Dr | 0.32mi | 3/1.0 | 1,143 (+6%) | 18mo | $160,000 | $140 | 60 |
| 529 Fern Rd | 0.46mi | 3/1.0 | 1,216 (+13%) | 7mo | $190,000 | $156 | 52 |
| 215 Deptford Rd | 0.70mi | 2/1.0 (-1) | 1,152 (+7%) | 2mo | $210,000 | $182 | 49 |
| 313 Cornell Rd | 0.66mi | 3/1.5 | 1,200 (+11%) | 14mo | $352,500 | $294 | 37 |
Match score weights: distance 35% · size 25% · config 20% · recency 20%. Top-matched comps best support the ARV.
Projected returns pro-forma
-3.0% appreciation · 4.64% rent growth · sell at horizon
- IRR
- 3.7%
- Equity multiple
- 1.14×
- Total profit
- $8,062
- Equity at exit
- $29,672
- IRR
- 14.8%
- Equity multiple
- 2.29×
- Total profit
- $72,081
- Equity at exit
- $17,206
Cash invested: $55,720 (down + closing). Projections, not guarantees.
Landlord ↔ Tenant lean methodology
- Overall (STATE)
- 21 Tenant-Leaning
- State New Jersey
- 21 Tenant-Leaning · D+6
- County
- — inherits STATE
- City
- — inherits STATE
ZIP-level market 08028
- Home prices YoY
- -21.2%
- Rents YoY
- 4.6%
- Active inventory
- 75
- Price-to-rent
- 6.4×
Monthly cashflow live
- Estimated rent
- $2,594 high interval (Pro) →
- Mortgage (P&I)
- −$1,044
- Tax from tax record
- −$360 /mo · $4,321/yr
- Insurance
- −$83
- HOA
- −$0
- Vacancy / Maint / Mgmt
- −$545
- Net cashflow
- $563
Break-even live
UW: 25.0% down · 7.5% · 30yr · 1.5% tax · 5.0% vac · 8.0% maint · 8.0% mgmt
Financing live
Cash to close
- Down payment
- $49,750
- Closing costs
- $5,970
- Reserves months
- —
- Total cash needed
- —
Loan-product check · same deal, 3 products live
Conventional
25% down · 7.5% · 30yr
- Down + closing
- —
- Monthly P&I
- —
- Monthly cashflow
- —
- DSCR
- —
- Eligible?
- —
Personal DTI + credit; lowest rate.
DSCR
20% down · 8.5% · 30yr
- Down + closing
- —
- Monthly P&I
- —
- Monthly cashflow
- —
- DSCR
- —
- Eligible?
- —
No personal income docs; deal must DSCR.
Hard money
10% down · 12.0% · 12mo
- Down + closing
- —
- Monthly P&I
- —
- Monthly cashflow
- —
- DSCR
- —
- Eligible?
- —
Short-term bridge; refi at stabilization.
Rent comps 5 comps
| Address | Beds | Baths | Sqft | Rent | $/sqft | DOM | Units | Dist |
|---|---|---|---|---|---|---|---|---|
| 32 Beau Rivage Dr Glassboro, NJ | 3.0 | 1.5 | 1152 | $1,725 | $1.50 | 10d | 1 | 1.21mi |
| 310 Ellis St Glassboro, NJ | 4.0 | 2.0 | 1424 | $2,550 | $1.79 | 2d | 1 | 1.27mi |
| 303 Ellis St Glassboro, NJ | 4.0 | 2.0 | 1440 | $2,500 | $1.74 | 18d | 1 | 1.28mi |
| 128-130 Wilmer St Glassboro, NJ | 3.0 | 1.0 | 1140 | $2,100 | $1.84 | 18d | 1 | 1.39mi |
| 200 High St W Glassboro, NJ | 2.0 | 1.0 | 750 | $2,000 | $2.67 | 24d | 1 | 1.50mi |
Listing history 11 events
-
2026-04-28status Pending
-
2026-03-20$199,000 Active
-
2026-02-12soldstatus $155,000
-
2020-02-17historical
-
2019-09-18price $120,000
-
2019-07-05$145,000 Active
-
2018-08-01historical
-
2018-04-12price $90,000
-
2018-02-06$99,999 Active
-
2017-02-15historical
-
2015-08-15$120,000
ⓘ Source: listings_history table (triggers on properties + properties_extension) + one-shot
backfill from property_details.listing_events for pre-trigger history.
Tax reassessment forecast NJ · Partial reset (capped growth)
- Current annual tax
- $4,321 · $360/mo
- Projected year-2 tax
- $4,638 · $386/mo
- Expected delta
- +$317/yr (+$26/mo · 7.3%)
ⓘ Screening estimate from a state-policy table — verify with the county assessor before closing.
Climate risk First Street
- Flood 1/10 Low FEMA zone X (unshaded) · 0% chance over 30 yrs
- Wildfire 1/10 Low
- Heat 6/10 Major 7 d/yr ≥102°F today · 15 d/yr by 30 yrs out
- Wind 6/10 Major 56% chance of damaging wind over 30 yrs
- Air quality 3/10 Moderate 2 unhealthy d/yr today · 5 by 30 yrs out
Nearby sold comps map
Loading sold comps map…
Walkable amenities ~0.75 mi
Loading nearby amenities…
Taxation est. · year 1
- Rental income
- $31,131
- − Mortgage interest
- −$11,147
- − Property taxes
- −$4,321
- − Insurance
- −$995
- − Repairs & maintenance
- −$2,490
- − Management
- −$2,490
- − Depreciation
- −$5,789
- Taxable income
- $3,898
- Est. tax owed @ 24.0%
- −$935
- After-tax cash flow
- $5,819/yr
For passive investors: Depreciation is non-cash, so a rental often shows a tax loss while cash-flowing — sheltering income. Rental losses are passive: they offset passive income freely, and up to $25,000/yr can offset ordinary (W-2) income if you actively participate and your MAGI is under $100k (phasing out to $0 by $150k); unused losses carry forward. On sale, claimed depreciation is recaptured at up to 25%, and gains may owe capital-gains tax (a 1031 exchange can defer both). Figures are a year-1 estimate at your 24.0% rate — not tax advice; consult a CPA.
Schools (NCES district)
- District
- Glassboro School District
- NCES district ID
- 3405880
- Math proficiency
- 10% ▼ -20.00%
- Reading proficiency
- 33% ▼ -3.00%
- Median HH income
- $61,819
- Composite
- 20.19/100
- National rank
- #8631
- State rank
- #412 of 472 in NJ
Livability — Glassboro
- Score
- 81/100
- State rank
- #57
- US rank
- #1498
Category grades
Schools grade is shown separately in the Schools card above.
Census & demographics
- Census place
- Glassboro, NJ
- County
- Gloucester County · 160,422 people
- City population
- 25,098
- Metro
- Philadelphia-Camden-Wilmington, PA-NJ-DE-MD
- Population (ZIP)
- 25,098
- Household income
- $89,130
- Rent vs Own
- Severe rent burden
- 775.0
Population outlook (Gloucester County) Hauer SSP2
- Today (2025)
- 298,895 people
- By 2030
- 299,031 · +0.0%
- By 2040
- 294,020 · -1.6%
- By 2050
- 284,188 · -4.9%
- By 2075
- 260,720 · -12.8%
- By 2100
- 229,565 · -23.2%
Race, ethnicity, and origin ACS 2023
- Neighborhood character
- Diverse neighborhood (Simpson 0.58)
- Race & ethnicity
- White 61% Black 18% Hispanic / Latino 10% Asian 7% Two or more races 6%
- Hispanic origin (detail)
- Mexican 1% Puerto Rican 6%
- Common ancestry
- Romanian 3% Italian 1% Slovak 1%
- Foreign-born
- 9% · Canada, Jamaica, China
- Languages at home
- 85% English-only · Spanish 7% Other Indo-European 3% Other Asian/Pacific 1%
Political lean MEDSL · Gloucester
- 2024 margin
- Toss-up / Even · D 47.8% · R 50.6% · Other 1.6%
- 2008→2024 swing
- -15.0pp toward R · 2008: 12.2pp · 2024: -2.8pp
- All cycles
- 2024: R+2.8 2020: D+1.9 2016: R+0.4 2012: D+10.5 2008: D+12.2
Not yet ingested
- Civics
- —
Market trends
- HPI YoY
- ▼ -79.06%
- Current HPI
- 293.7251
- Rent YoY
- ▲ 4.64%
- Metro
- Philadelphia-Camden-Wilmington, PA-NJ-DE-MD
- State GDP YoY
- ▲ 2.05%
- F500 in state
- 34
Industry mix (Fortune 500 HQ in NJ)
| Industry | F500 HQs | Revenue |
|---|---|---|
| Consumer Goods | 3 | $31B |
|
||
| Pharmaceuticals | 2 | $153B |
|
||
| Technology | 2 | $21B |
|
||
| Insurance | 2 | $20B |
|
||
| Healthcare | 2 | $19B |
|
||
| Financial Services | 1 | $70B |
|
||
Price history
+65.8% since first listed11 events — show timeline
- 2026-04-28 Pending — BRIGHT MLS
- 2026-03-20 Listed $199,000 BRIGHT MLS
- 2026-02-12 Sold (Public Records) $155,000 Public Records
- 2020-02-17 Listing Removed — BRIGHT MLS
- 2019-09-18 Price Changed $120,000 BRIGHT MLS
- 2019-07-05 Listed $145,000 BRIGHT MLS
- 2018-08-01 Listing Removed — BRIGHT MLS
- 2018-04-12 Price Changed $90,000 BRIGHT MLS
- 2018-02-06 Listed $99,999 BRIGHT MLS
- 2017-02-15 Listing Removed — BRIGHT MLS
- 2015-08-15 Listed $120,000 BRIGHT MLS
Property tax history
+1.5%/yrLatest (2025): $4,321 · +3.3% YoY. Source: county tax records.
Cash-flow waterfall
monthlySold comps — $/sqft
last 12 mo · ≤1 miLoading sold comps…