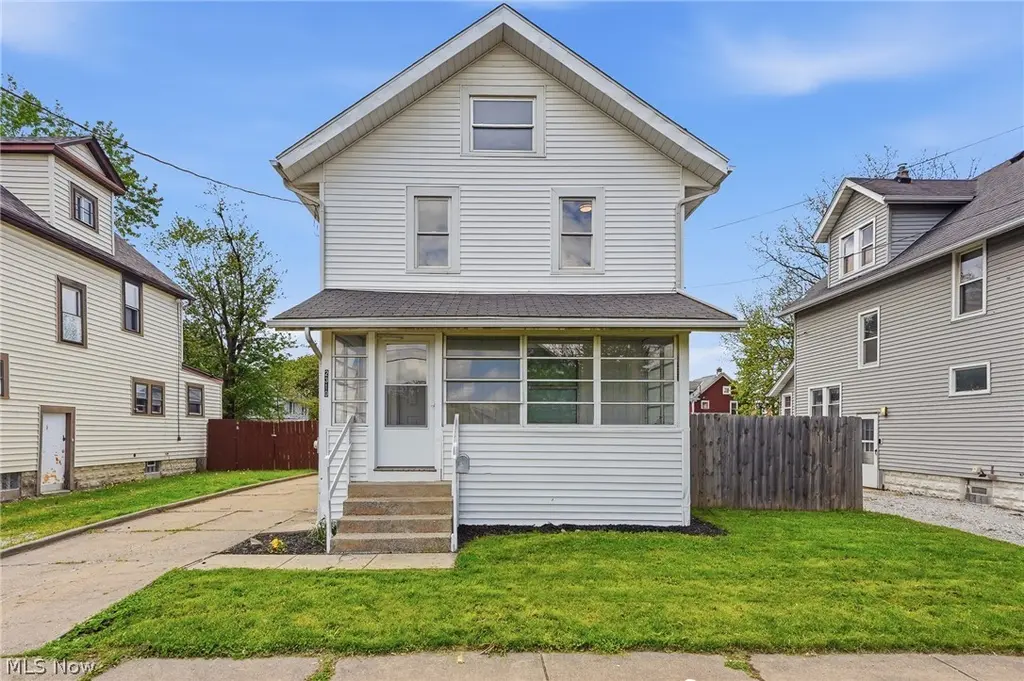
2310 17th St SW · Akron, OH
Flood risk 1/10 · Minimal
- FEMA flood zone
- X (unshaded)
- Chance of flooding over 30 yrs
- 0.0%
- Est. flood insurance / yr
- $473 – $860
Fire risk 1/10 · Minimal
- Est. fire insurance / yr
- $713 – $1,323
Heat risk 3/10 · Minor
- Hot days now (above 97°F)
- 7 days/yr
- Hot days in 30 yrs
- 17 days/yr
Wind risk 1/10 · Minimal
- Chance of severe wind over 30 yrs
- —
Air-quality risk 2/10 · Minimal
- Unhealthy air days now
- 0 days/yr
- Unhealthy air days in 30 yrs
- 1 days/yr
Risk factors via First Street. Map © Google.
Why this score? — see what drove the C grade
The composite is a weighted blend of 9 inputs, each scored 0–100. Each bar is that input's sub-score; the figure is the points it added to the 100-point composite (weight × sub-score).
- Cash flow +26.5/30.0
- DSCR +9.0/10.0
- 1% rule +7.1/10.0
- Livability +4.0/5.0
- Rent growth +3.5/5.0
- Condition / age +2.5/5.0
- Schools +2.1/10.0
- ARV discount +1.4/15.0
- Appreciation +0.0/10.0
$109,000
🖨 Deal sheet (PDF) 📄 Offer letter ✓ Due diligence
Listing remarks MLS
Old World charm in this 3 Bedroom with Finished Attic Colonial!!!
Key facts
- Finished bonus space
- Private back yard
- Paved driveway
Tags
Property features AI
Exterior
- Parking: Attached garage (2 spaces); Paved parking
- Utilities: Public water; Public sewer
- Home design: Vinyl siding construction; Asphalt roof; Above-grade finished area reported by assessor
- Construction: Vinyl siding; Asphalt roof; Year built per public records
- Exterior features: Enclosed glass porch/patio; Patio; Porch; Private backyard
Interior
- Kitchen: Range; Refrigerator
- Bedrooms: Total of 7 rooms (bedroom count not specified)
- Bathrooms: 1 full bathroom
- Heating & cooling: Central air conditioning; Forced air gas heating
- Interior features: Full unfinished basement; Decorative fireplace (1)
- Laundry & utility: Laundry in basement
Neighborhood map
What this means for you Summary
Snapshot
- This is a 3-bed/1.0-bath single-family listed at $109k.
Deal economics
- At list price, monthly cash flow is $288 ($3k/yr) — positive.
- The deal already cash-flows at list — no discount required.
- Meets the 1% rule at list price ($1k rent vs $109k).
- Cap rate 9.5% vs local median 6.6% in Akron — top-decile yield for the area; either an underpriced asset or a hidden risk that comps aren't pricing in. Stress-test before assuming the spread holds.
Location & tenants
- Location reads 81/100 on livability (#104 in OH, #1,591 nationally) — a professional / high-income tenant draw. Strengths: amenities A+, commute A+, cost of living A+; Watch: crime F, employment F.
- Akron City (urban): math 22% / reading 30% proficiency, ranked #602 of 656 in OH (top 92%) — low school quality limits family demand, transient renter base, plan for 1-2y turnover; 66% free/reduced lunch — lower-income household profile, screen leases tightly.
- Zoned schools: Rimer Community Learning Center (math 37% / reading 37%, grade F, #1,087 of 1,584 statewide, top 70%, 278 students, 0% FRL); Innes Community Learning Center (math 8% / reading 15%, grade F, #641 of 654 statewide, top 98%, 641 students, 0% FRL); Akron Early College High School (math 62% / reading 98%, grade A, #34 of 781 statewide, top 4%, 377 students, 0% FRL) — zoned schools average 0% FRL vs 66% district-wide (66 pts lower); this property's tenant base skews higher-income than the district average.
- Zoned-school proficiency averages 43% at this address vs 26% district-wide (+17 pts) — the actual schools serving this property are materially stronger than the Akron City average implies; a family-tenant draw the district grade alone would hide.
- Market conditions: Rents rising (+3.9%/yr); 104 active listings in the ZIP; 20 comparable units currently listed for rent nearby; rentals at typical pace (median 25d on market — plan ~3-4 weeks tenant-placement turnaround); 1,114 units permitted in Summit County in 2024 (397 in 5+ unit buildings).
- This rent runs 33% of the median local income ($47k/yr) — at the standard rent-burdened threshold; future hikes will face affordability resistance.
Forward outlook
- Local home prices are declining (-3.0%/yr); year-one equity from $754 of loan paydown is wiped out by about $3k of value loss. Plan a longer hold.
- Summit County population projected to shrink 6% by 2050 — rents likely to lag national; underwrite the cash flow, not the appreciation.
- At projected returns (-3.0% appreciation + 3.9% rent growth), your $31k cash investment doubles in ~9 years — after that, you're playing with house money.
Negotiation context
- Only 5 days on market — expect competitive offers; lowballing is unlikely to land.
- 3 sale attempts since 13y ago with the ask held roughly flat each time — persistent listings suggest the price (not the market) is what's stuck; bring a comps-based counter.
Risks & watch-outs
- Watch-outs: built in 1914 — expect roof / HVAC / electrical / plumbing capex.
Questions for the listing agent
- Built in 1914 — when were the roof, HVAC, electrical panel, plumbing, and water heater last replaced?
- Is there a deadline driving the sale (1031 exchange, divorce, estate, relocation)? That informs how much negotiation room exists.
- Crime grade is F in this area — have there been break-ins, vandalism, or insurance claims at this property in the last 3 years? What carrier currently insures it and at what premium?
- What's the average days-on-market for RENTAL listings here right now (not sales)? A rising rental-DOM trend means longer vacancies and softer asking-rent achievability than the comps imply.
- What's the recent tenant-quality profile in this submarket — average credit score on applications, eviction rate, late-payment / NSF rate, and stable-employment percentage? A property-management company in the area should have these aggregated.
- How much new for-sale + rental construction is in the pipeline within 1–3 miles? Heavy new supply typically softens prices + rents 12–24 months out; constrained supply supports both.
Investment metrics
- 1% rule
- 1.21% ✓
- Cap rate
- 9.46%
- Cash-on-cash
- 11.31%
- DSCR
- 1.50
- GRM
- 6.9
CMA / ARV
- ARV (median comp)
- $96,079
- List price
- $109,000
- Delta
- 13.45%
- Verdict
- OVERPRICED
- Comps
- 20 within 1.0 mi
Show comp detail 12 sales within ~0.75 mi
| Address | Dist | Beds/Ba | Sqft | Sold | Price | $/sf | Match |
|---|---|---|---|---|---|---|---|
| 2342 16th St SW | 0.08mi | 4/1.0 (+1) | 1,303 (-8%) | 2mo | $77,000 | $59 | 77 |
| 962 Iona Ave | 0.50mi | 3/1.0 | 1,443 (+2%) | 2mo | $132,000 | $91 | 70 |
| 1223 Florida Ave | 0.50mi | 3/2.0 | 1,391 (-1%) | 2mo | $143,000 | $103 | 68 |
| 2323 SW 11th St SW | 0.36mi | 3/1.5 | 1,272 (-10%) | 5mo | $117,000 | $92 | 61 |
| 2246 7th St SW | 0.56mi | 3/1.5 | 1,487 (+6%) | 5mo | $106,000 | $71 | 59 |
| 600 Florida Ave | 0.70mi | 3/1.5 | 1,368 (-3%) | 4mo | $120,000 | $88 | 57 |
| 2140 18th St SW | 0.33mi | 3/2.0 | 1,242 (-12%) | 5mo | $68,000 | $55 | 56 |
| 721 Polk Ave | 0.64mi | 3/1.5 | 1,500 (+6%) | 4mo | $70,000 | $47 | 54 |
| 2186 5th St SW | 0.69mi | 3/1.0 | 1,288 (-9%) | 5mo | $82,000 | $64 | 50 |
| 2271 5th St SW | 0.67mi | 2/2.0 (-1) | 1,508 (+7%) | 3mo | $95,000 | $63 | 45 |
| 2134 7th St SW | 0.64mi | 3/2.0 | 1,256 (-11%) | 4mo | $95,000 | $76 | 45 |
| 2045 9th St SW | 0.68mi | 3/2.0 | 1,232 (-13%) | 5mo | $160,000 | $130 | 39 |
Match score weights: distance 35% · size 25% · config 20% · recency 20%. Top-matched comps best support the ARV.
Projected returns pro-forma
-3.0% appreciation · 3.91% rent growth · sell at horizon
- IRR
- 1.6%
- Equity multiple
- 1.06×
- Total profit
- $1,895
- Equity at exit
- $16,252
- IRR
- 12.1%
- Equity multiple
- 2.00×
- Total profit
- $30,434
- Equity at exit
- $9,424
Cash invested: $30,520 (down + closing). Projections, not guarantees.
Landlord ↔ Tenant lean methodology
- Overall (STATE)
- 73 Landlord-Friendly
- State Ohio
- 73 Landlord-Friendly · R+6
- County
- — inherits STATE
- City
- — inherits STATE
ZIP-level market 44314
- Rents YoY
- 3.9%
- Active inventory
- 104
- Price-to-rent
- 6.9×
Monthly cashflow live
- Estimated rent
- $1,323 high interval (Pro) →
- Mortgage (P&I)
- −$572
- Tax from tax record
- −$141 /mo · $1,689/yr
- Insurance
- −$45
- HOA
- −$0
- Vacancy / Maint / Mgmt
- −$278
- Net cashflow
- $288
Break-even live
Sensitivity live
| Price | -10% $349 | -5% $318 | +0% $288 | +5% $257 | +10% $226 |
|---|---|---|---|---|---|
| Rent | -10% $183 | -5% $235 | +0% $288 | +5% $340 | +10% $392 |
| Rate | -1.0pp $342 | -0.5pp $315 | base $288 | +0.5pp $259 | +1.0pp $231 |
UW: 25.0% down · 7.5% · 30yr · 1.5% tax · 5.0% vac · 8.0% maint · 8.0% mgmt
Financing live
Cash to close
- Down payment
- $27,250
- Closing costs
- $3,270
- Reserves months
- —
- Total cash needed
- —
Loan-product check · same deal, 3 products live
Conventional
25% down · 7.5% · 30yr
- Down + closing
- —
- Monthly P&I
- —
- Monthly cashflow
- —
- DSCR
- —
- Eligible?
- —
Personal DTI + credit; lowest rate.
DSCR
20% down · 8.5% · 30yr
- Down + closing
- —
- Monthly P&I
- —
- Monthly cashflow
- —
- DSCR
- —
- Eligible?
- —
No personal income docs; deal must DSCR.
Hard money
10% down · 12.0% · 12mo
- Down + closing
- —
- Monthly P&I
- —
- Monthly cashflow
- —
- DSCR
- —
- Eligible?
- —
Short-term bridge; refi at stabilization.
Rent comps 20 comps
| Address | Beds | Baths | Sqft | Rent | $/sqft | DOM | Units | Dist |
|---|---|---|---|---|---|---|---|---|
| 2211 18th St SW Akron, OH | 3.0 | 1.0 | 1332 | $1,250 | $0.94 | 16d | 1 | 0.18mi |
| 1029 Harpster Ave Akron, OH | 4.0 | 1.0 | 1403 | $1,250 | $0.89 | 16d | 1 | 0.27mi |
| 2139 18th St SW Akron, OH | 2.0 | 1.0 | 992 | $1,100 | $1.11 | 45d | 1 | 0.31mi |
| 2222 12th St SW Akron, OH | 3.0 | 1.5 | 1270 | $1,050 | $0.83 | 45d | 1 | 0.32mi |
| 2250 11th St SW Akron, OH | 3.0 | 1.0 | 1308 | $1,350 | $1.03 | 16d | 1 | 0.35mi |
| 2163 13th St SW Akron, OH | 3.0 | 2.5 | 1480 | $1,150 | $0.78 | 45d | 1 | 0.36mi |
| 2160 12th St SW Akron, OH | 3.0 | 1.0 | 1445 | $1,300 | $0.90 | 45d | 1 | 0.39mi |
| 720 Florida Ave Akron, OH | 4.0 | 1.0 | 1124 | $1,500 | $1.33 | 16d | 1 | 0.47mi |
| 773 Montana Ave Akron, OH | 3.0 | 1.5 | 1128 | $1,195 | $1.06 | 25d | 1 | 0.51mi |
| 875 Harrison Ave Akron, OH | 3.0 | 1.0 | 1157 | $1,150 | $0.99 | 16d | 1 | 0.57mi |
| 2138 East Ave Akron, OH | 3.0 | 1.0 | 990 | $1,100 | $1.11 | 25d | 1 | 0.59mi |
| 1292 W Wilbeth Rd Akron, OH | 3.0 | 1.0 | 1248 | $1,200 | $0.96 | 22d | 1 | 0.62mi |
| 721 Polk Ave Akron, OH | 3.0 | 1.5 | 1500 | $1,600 | $1.07 | 25d | 1 | 0.63mi |
| 1138 Kohler Ave Akron, OH | 3.0 | 1.0 | 1000 | $1,250 | $1.25 | 16d | 1 | 0.67mi |
| 1304 Kellogg Ave Akron, OH | 2.0 | 2.0 | 1148 | $2,000 | $1.74 | 16d | 1 | 0.70mi |
| 1453 Woodbirch Ave Akron, OH | 3.0 | 2.0 | 1008 | $1,500 | $1.49 | 45d | 1 | 0.88mi |
| 1455 Woodbirch Ave Akron, OH | 3.0 | 2.0 | 1008 | $1,500 | $1.49 | 22d | 1 | 0.88mi |
| 960 Jason Ave Akron, OH | 3.0 | 1.5 | 935 | $1,095 | $1.17 | 22d | 1 | 0.92mi |
| 760 Lakewood Blvd Akron, OH | 3.0 | 2.0 | 1398 | $1,150 | $0.82 | 25d | 1 | 1.10mi |
| 527 Brady Ave Akron, OH | 3.0 | 1.5 | 1416 | $1,395 | $0.99 | 45d | 1 | 1.12mi |
Listing history 6 events
-
2026-05-05status Pending 617-char remark
-
2026-04-29$109,000 Active 617-char remark
-
2024-11-04historical $1,300
-
2024-10-03$1,300
-
2013-06-28soldstatus $25,000 65-char remark
Show marketing remark (65 chars)
Old World charm in this 3 Bedroom with Finished Attic Colonial!!!
-
2013-04-16$29,900 65-char remark
Show marketing remark (65 chars)
Old World charm in this 3 Bedroom with Finished Attic Colonial!!!
ⓘ Source: listings_history table (triggers on properties + properties_extension) + one-shot
backfill from property_details.listing_events for pre-trigger history.
Tax reassessment forecast OH · Partial reset (capped growth)
- Current annual tax
- $1,689 · $141/mo
- Projected year-2 tax
- $1,695 · $141/mo
- Expected delta
- +$5/yr ($0/mo · 0.3%)
ⓘ Screening estimate from a state-policy table — verify with the county assessor before closing.
Climate risk First Street
- Flood 1/10 Low FEMA zone X (unshaded) · 0% chance over 30 yrs
- Wildfire 1/10 Low
- Heat 3/10 Moderate 7 d/yr ≥97°F today · 17 d/yr by 30 yrs out
- Wind 1/10 Low
- Air quality 2/10 Low 0 unhealthy d/yr today · 1 by 30 yrs out
Nearby sold comps map
Loading sold comps map…
Walkable amenities ~0.75 mi
Loading nearby amenities…
Taxation est. · year 1
- Rental income
- $15,879
- − Mortgage interest
- −$6,106
- − Property taxes
- −$1,689
- − Insurance
- −$545
- − Repairs & maintenance
- −$1,270
- − Management
- −$1,270
- − Depreciation
- −$3,171
- Taxable income
- $1,827
- Est. tax owed @ 24.0%
- −$438
- After-tax cash flow
- $3,012/yr
For passive investors: Depreciation is non-cash, so a rental often shows a tax loss while cash-flowing — sheltering income. Rental losses are passive: they offset passive income freely, and up to $25,000/yr can offset ordinary (W-2) income if you actively participate and your MAGI is under $100k (phasing out to $0 by $150k); unused losses carry forward. On sale, claimed depreciation is recaptured at up to 25%, and gains may owe capital-gains tax (a 1031 exchange can defer both). Figures are a year-1 estimate at your 24.0% rate — not tax advice; consult a CPA.
Schools (NCES district)
- District
- Akron City
- NCES district ID
- 3904348
- Math proficiency
- 22% ▼ -17.00%
- Reading proficiency
- 30% ▼ -12.00%
- Median HH income
- $33,811
- Composite
- 21.31/100
- National rank
- #8383
- State rank
- #602 of 656 in OH
Livability — Akron
- Score
- 81/100
- State rank
- #104
- US rank
- #1591
Category grades
Schools grade is shown separately in the Schools card above.
Census & demographics
- Census place
- Akron, OH
- County
- Summit County · 440,783 people
- City population
- 174,375
- Metro
- Akron, OH
- Population (ZIP)
- 17,885
- Household income
- $47,468
- Rent vs Own
- Severe rent burden
- 975.0
Population outlook (Summit County) Hauer SSP2
- Today (2025)
- 546,583 people
- By 2030
- 544,028 · -0.5%
- By 2040
- 531,363 · -2.8%
- By 2050
- 514,923 · -5.8%
- By 2075
- 481,765 · -11.9%
- By 2100
- 432,265 · -20.9%
Race, ethnicity, and origin ACS 2023
- Neighborhood character
- Predominantly White (69%)
- Race & ethnicity
- White 69% Black 16% Two or more races 12% Hispanic / Latino 3% Asian 3%
- Common ancestry
- Slovak 2% Romanian 2% Lithuanian 1%
- Foreign-born
- 3% · India, Canada, Philippines
- Languages at home
- 96% English-only · Chinese 2% Russian/Polish/Slavic 1% Spanish 1%
Political lean MEDSL · Summit
- 2024 margin
- Lean D (+7.0) · D 53.0% · R 46.0%
- 2008→2024 swing
- -9.6pp toward R · 2008: 16.6pp · 2024: 7.0pp
- All cycles
- 2024: D+7.0 2020: D+9.6 2016: D+8.2 2012: D+14.8 2008: D+16.6
Not yet ingested
- Civics
- —
Market trends
- HPI YoY
- ▼ -166.61%
- Current HPI
- 151.066
- Rent YoY
- ▲ 3.91%
- Metro
- Akron, OH
- State GDP YoY
- ▲ 1.98%
- F500 in state
- 48
Industry mix (Fortune 500 HQ in OH)
| Industry | F500 HQs | Revenue |
|---|---|---|
| Insurance | 3 | $145B |
|
||
| Industrial Machinery | 3 | $49B |
|
||
| Financial Services | 3 | $24B |
|
||
| Consumer Goods | 2 | $93B |
|
||
| Aerospace / Defense | 2 | $47B |
|
||
| Utilities | 2 | $33B |
|
||
Price history
+293.0% since first listed7 events — show timeline
- 2026-06-04 Sold (MLS) $117,500 MLSNOW
- 2026-05-05 Pending — MLSNOW
- 2026-04-29 Listed $109,000 MLSNOW
- 2024-11-04 Rental Removed $1,300 Avail
- 2024-10-03 Listed for Rent $1,300 Avail
- 2013-06-28 Sold (MLS) $25,000 MLSNOW
- 2013-04-16 Listed $29,900 MLSNOW
Property tax history
+8.7%/yrLatest (2025): $1,689 · +0.2% YoY. Source: county tax records.
Cash-flow waterfall
monthlySold comps — $/sqft
last 12 mo · ≤1 miLoading sold comps…