 🏗️ New Construction
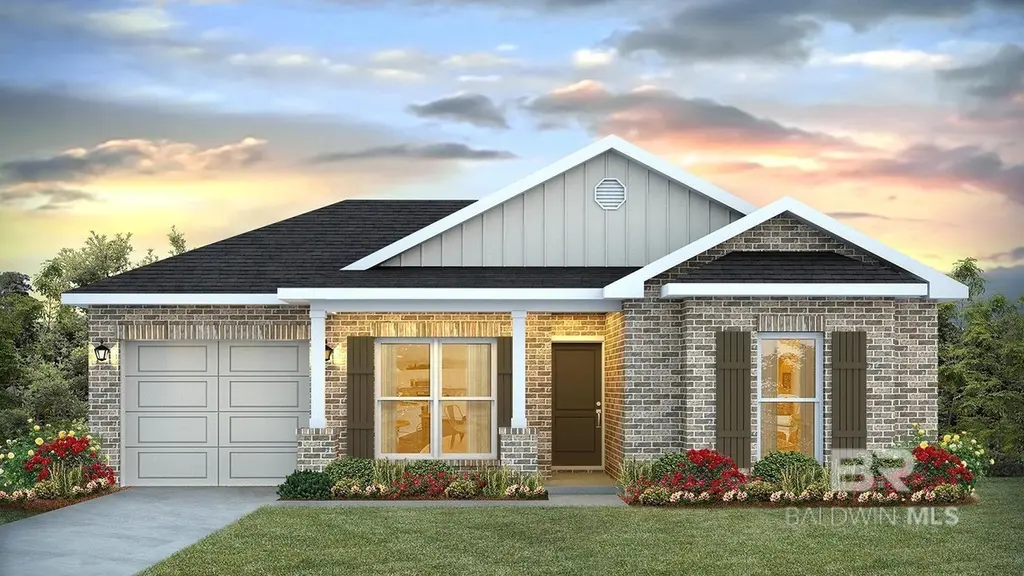
13356 Shea Cir · Foley, AL
Flood risk No data
- FEMA flood zone
- —
- Chance of flooding over 30 yrs
- —
- Est. flood insurance / yr
- —
Fire risk No data
- Est. fire insurance / yr
- —
Heat risk No data
- Hot days now (above threshold)
- —
- Hot days in 30 yrs
- —
Wind risk No data
- Chance of severe wind over 30 yrs
- —
Air-quality risk No data
- Unhealthy air days now
- —
- Unhealthy air days in 30 yrs
- —
Risk factors via First Street. Map © Google.
Why this score? — see what drove the D- grade
The composite is a weighted blend of 9 inputs, each scored 0–100. Each bar is that input's sub-score; the figure is the points it added to the 100-point composite (weight × sub-score).
- Cash flow +11.3/30.0
- ARV discount +7.5/15.0
- Condition / age +4.0/5.0
- Schools +3.9/10.0
- 1% rule +3.3/10.0
- DSCR +3.3/10.0
- Livability +3.1/5.0
- Rent growth +3.0/5.0
- Appreciation +0.0/10.0
$272,540
🖨 Deal sheet (PDF) 📄 Offer letter ✓ Due diligence
Listing remarks
The Sullivan is a stunning single-story floor plan available in Magnolia Pines, located in Foley, Alabama. With sixteen exterior options to choose from, the Sullivan is sure to catch the eye. This 4-bedroom, 2-bathroom, 1-car garage floor plan offers 1,417 square feet of living space. It features an inviting foyer that leads passed the bedrooms and into a spacious kitchen filled with natural light. The kitchen is equipped with shaker-style cabinets, stainless-steel Whirlpool appliances, granite countertops, a pantry for extra storage, and plenty of counter space for all your cooking needs. The open-concept layout blends the kitchen, dining, and living areas together, making it perfect for e
Key facts
- Inviting foyer
- Spacious kitchen
- Granite countertops
Tags
Property features AI
Finance
- Other: Whole/full ownership
- HOA & community: No transfer fees; No community amenities
Exterior
- Parking: Attached single garage (1 covered space)
- Utilities: Riviera Utilities; Has heating (electric)
- Home design: New construction; One story
- Construction: Brick, concrete board, vinyl siding and wood siding exterior; Composition roof; Slab foundation; Approximately 1,440 square feet
- Exterior features: Termite contract; Subdivision lot
Interior
- Kitchen: Dishwasher; Disposal; Microwave; Electric range
- Flooring: Vinyl; Laminate
- Bathrooms: 2 full bathrooms
- Heating & cooling: Electric heating
- Interior features: Split bedroom plan; No fireplace
Neighborhood map
What this means for you Summary
Snapshot
- This is a 4-bed/2.0-bath single-family listed at $273k. Condition is rated good.
Deal economics
- At list price, monthly cash flow is $-104 ($-1k/yr) — negative.
- To cash-flow at today's rent, offer at most $263k (3.5% below list).
- To meet the 1% rule (rent ≥ 1% of price), the offer needs to be $230k (15.6% below list).
- Recommended offer: $230k (15.6% below list) — sets the bar for 1% rule.
- Cap rate 5.8% vs local median 4.0% in Foley — top-decile yield for the area; either an underpriced asset or a hidden risk that comps aren't pricing in. Stress-test before assuming the spread holds.
Location & tenants
- Location reads 61/100 on livability (#241 in AL) — a middle-class / working-renter tenant base. Strengths: housing A+, cost of living A-, crime B; Watch: employment D+, amenities F, commute F.
- Baldwin County (rural): math 33% / reading 57% proficiency, ranked #18 of 129 in AL (top 14%) — families likely to look elsewhere, expect single-tenant / working-renter base with shorter leases.
- Zoned schools: Foley Elementary School (math 22% / reading 44%, grade F, #323 of 627 statewide, top 52%, 992 students, 76% FRL); Foley Middle School (math 11% / reading 36%, grade F, #172 of 257 statewide, top 68%, 783 students, 82% FRL); Foley High School (math 24% / reading 25%, grade F, #118 of 305 statewide, top 45%, 1,578 students, 75% FRL) — zoned schools average 78% FRL vs 38% district-wide (40 pts higher); higher-poverty schools than district average — tighter screening recommended.
- Zoned-school proficiency averages 27% at this address vs 45% district-wide (-18 pts) — the specific schools serving this property underperform the Baldwin County average; the district grade overstates school quality for this exact location.
- Market conditions: Rents rising (+1.8%/yr); 875 active listings in the ZIP; 2 comparable units currently listed for rent nearby; 3,883 units permitted in Baldwin County in 2024 (481 in 5+ unit buildings).
- This rent runs 41% of the median local income ($67k/yr) — at the standard rent-burdened threshold; future hikes will face affordability resistance.
Forward outlook
- Local home prices are declining (-3.0%/yr); year-one equity from $2k of loan paydown is wiped out by about $8k of value loss. Plan a longer hold.
- Baldwin County population projected at +42% by 2050 — long-run rental-demand tailwind backs the buy-and-hold thesis.
Negotiation context
- It's been on market 26 days — a 2% lower offer ($268k) is reasonable based on typical stale-listing flexibility.
Questions for the listing agent
- What do current leases actually rent for vs. the listed asking? Can we see a recent rent roll and the last 12 months of T-12 income?
- Is there a deadline driving the sale (1031 exchange, divorce, estate, relocation)? That informs how much negotiation room exists.
- Schools are D-rated, which usually means shorter tenancies and higher turnover. Who's the typical renter profile here, and what's been the actual vacancy rate?
- The area grade is low — what's the realistic commute time and amenity access for the typical tenant pool here? Any planned neighborhood developments (good or bad) we should know about?
- What's the average days-on-market for RENTAL listings here right now (not sales)? A rising rental-DOM trend means longer vacancies and softer asking-rent achievability than the comps imply.
- What's the recent tenant-quality profile in this submarket — average credit score on applications, eviction rate, late-payment / NSF rate, and stable-employment percentage? A property-management company in the area should have these aggregated.
- How much new for-sale + rental construction is in the pipeline within 1–3 miles? Heavy new supply typically softens prices + rents 12–24 months out; constrained supply supports both.
Investment metrics
- 1% rule
- 0.83% ✗
- Cap rate
- 5.85%
- Cash-on-cash
- -1.60%
- DSCR
- 0.93
- GRM
- 10.1
CMA / ARV
- ARV (on-the-fly)
- $277,920
- Comps found
- 12
Show comp detail 12 sales within ~0.75 mi
| Address | Dist | Beds/Ba | Sqft | Sold | Price | $/sf | Match |
|---|---|---|---|---|---|---|---|
| 13782 Logan Pl | 0.15mi | 4/2.0 | 1,410 (-2%) | 3mo | $272,040 | $193 | 87 |
| 13763 Logan Pl | 0.13mi | 4/2.0 | 1,410 (-2%) | 4mo | $271,540 | $193 | 87 |
| 13816 Shea Cir | 0.22mi | 4/2.0 | 1,417 (-2%) | 1mo | $275,000 | $194 | 86 |
| 13765 Shea Cir | 0.17mi | 4/2.0 | 1,410 (-2%) | 4mo | $250,000 | $177 | 85 |
| 13773 Logan Pl | 0.14mi | 3/2.0 (-1) | 1,443 (+0%) | 4mo | $260,000 | $180 | 85 |
| 13772 Logan Pl | 0.14mi | 4/2.0 | 1,504 (+4%) | 3mo | $245,000 | $163 | 84 |
| 17015 Sugar Loop | 0.30mi | 3/2.0 (-1) | 1,481 (+3%) | 2mo | $250,000 | $169 | 74 |
| 16603 Vanilla Dr | 0.27mi | 3/2.0 (-1) | 1,509 (+5%) | 4mo | $192,000 | $127 | 71 |
| 13753 Logan Pl | 0.13mi | 3/2.0 (-1) | 1,281 (-11%) | 3mo | $250,000 | $195 | 68 |
| 13742 Logan Pl | 0.13mi | 3/2.0 (-1) | 1,281 (-11%) | 4mo | $269,524 | $210 | 68 |
| 16423 Absalom St | 0.39mi | 3/2.0 (-1) | 1,353 (-6%) | 2mo | $235,000 | $174 | 66 |
| 16377 Mansion St | 0.42mi | 3/2.0 (-1) | 1,330 (-8%) | 1mo | $259,900 | $195 | 62 |
Match score weights: distance 35% · size 25% · config 20% · recency 20%. Top-matched comps best support the ARV.
Projected returns pro-forma
-3.0% appreciation · 1.81% rent growth · sell at horizon
- IRR
- -20.3%
- Equity multiple
- 0.30×
- Total profit
- $-54,318
- Equity at exit
- $41,439
- IRR
- -16.1%
- Equity multiple
- 0.14×
- Total profit
- $-66,556
- Equity at exit
- $24,029
Cash invested: $77,818 (down + closing). Projections, not guarantees.
Landlord ↔ Tenant lean methodology
- Overall (STATE)
- 90 Strongly Landlord-Friendly
- State Alabama
- 90 Strongly Landlord-Friendly · R+15
- County
- — inherits STATE
- City
- — inherits STATE
ZIP-level market 36535
- Home prices YoY
- -24.9%
- Rents YoY
- 1.8%
- Active inventory
- 875
- Price-to-rent
- 9.9×
Monthly cashflow live
- Estimated rent
- $2,300 medium interval (Pro) →
- Mortgage (P&I)
- −$1,457
- Tax est. 1.5%
- −$347 /mo · $4,169/yr
- Insurance
- −$116
- HOA
- −$0
- Vacancy / Maint / Mgmt
- −$483
- Net cashflow
- $-104
Break-even live
Sensitivity live
| Price | -10% $89 | -5% $-8 | +0% $-104 | +5% $-200 | +10% $-296 |
|---|---|---|---|---|---|
| Rent | -10% $-285 | -5% $-194 | +0% $-104 | +5% $-13 | +10% $78 |
| Rate | -1.0pp $36 | -0.5pp $-33 | base $-104 | +0.5pp $-176 | +1.0pp $-249 |
UW: 25.0% down · 7.5% · 30yr · 1.5% tax · 5.0% vac · 8.0% maint · 8.0% mgmt
Financing live
Cash to close
- Down payment
- $69,480
- Closing costs
- $8,338
- Reserves months
- —
- Total cash needed
- —
Loan-product check · same deal, 3 products live
Conventional
25% down · 7.5% · 30yr
- Down + closing
- —
- Monthly P&I
- —
- Monthly cashflow
- —
- DSCR
- —
- Eligible?
- —
Personal DTI + credit; lowest rate.
DSCR
20% down · 8.5% · 30yr
- Down + closing
- —
- Monthly P&I
- —
- Monthly cashflow
- —
- DSCR
- —
- Eligible?
- —
No personal income docs; deal must DSCR.
Hard money
10% down · 12.0% · 12mo
- Down + closing
- —
- Monthly P&I
- —
- Monthly cashflow
- —
- DSCR
- —
- Eligible?
- —
Short-term bridge; refi at stabilization.
Rent comps 2 comps
| Address | Beds | Baths | Sqft | Rent | $/sqft | DOM | Units | Dist |
|---|---|---|---|---|---|---|---|---|
| 13691 Logan Pl , AL | 4.0 | 2.0 | 1417 | $1,995 | $1.41 | 21d | 1 | 0.15mi |
| 13634 Logan Pl , AL | 3.0 | 2.0 | 1281 | $1,895 | $1.48 | 21d | 1 | 0.18mi |
Listing history 13 events
-
2026-06-14statusdays on market $272,540 Pending 26 DOM
-
2026-06-13days on market $272,540 Active New Construction 25 DOM
-
2026-06-10days on market $272,540 Active New Construction 23 DOM
-
2026-06-09days on market $272,540 Active New Construction 22 DOM
-
2026-06-08days on market $272,540 Active New Construction 21 DOM
-
2026-06-07days on market $272,540 Active New Construction 20 DOM
-
2026-06-05days on market $272,540 Active New Construction 17 DOM
-
2026-06-03days on market $272,540 Active New Construction 16 DOM
-
2026-06-02days on market $272,540 Active New Construction 15 DOM
-
2026-06-01days on market $272,540 Active New Construction 14 DOM
-
2026-05-31days on market $272,540 Active New Construction 13 DOM
-
2026-05-30days on market $272,540 Active New Construction 12 DOM
-
2026-05-18$272,540 Active New Construction
ⓘ Source: listings_history table (triggers on properties + properties_extension) + one-shot
backfill from property_details.listing_events for pre-trigger history.
Nearby sold comps map
Loading sold comps map…
Walkable amenities ~0.75 mi
Loading nearby amenities…
Taxation est. · year 1
- Rental income
- $27,601
- − Mortgage interest
- −$15,568
- − Property taxes
- −$4,169
- − Insurance
- −$1,390
- − Repairs & maintenance
- −$2,208
- − Management
- −$2,208
- − Depreciation
- −$8,085
- Taxable loss
- −$6,026
- Est. tax savings @ 24.0%
- +$1,446
- After-tax cash flow
- $204/yr
For passive investors: Depreciation is non-cash, so a rental often shows a tax loss while cash-flowing — sheltering income. Rental losses are passive: they offset passive income freely, and up to $25,000/yr can offset ordinary (W-2) income if you actively participate and your MAGI is under $100k (phasing out to $0 by $150k); unused losses carry forward. On sale, claimed depreciation is recaptured at up to 25%, and gains may owe capital-gains tax (a 1031 exchange can defer both). Figures are a year-1 estimate at your 24.0% rate — not tax advice; consult a CPA.
Condition & rehab AI · 15 photos
This single-story home in Foley, Alabama, is in excellent condition with a good layout and features. It is move-in ready and has the potential for further value increases with minor improvements.
Value-add opportunities
- Both Painting exterior and interior — Enhances curb appeal and interior aesthetics
- Both Landscaping improvements — Enhances curb appeal and adds value
- Both Add smart home features — Improves convenience and adds value
- Rental Install smart thermostat — Improves energy efficiency and adds value
Renovation cost estimate screening
Value-add ROI direction
- Both Painting exterior and interior — Enhances curb appeal and interior aesthetics ↑
- Both Landscaping improvements — Enhances curb appeal and adds value ↑
- Both Add smart home features — Improves convenience and adds value ↑
- Rental Install smart thermostat — Improves energy efficiency and adds value ↑
ⓘ Cost ranges are severity-bucket heuristics (US national rule-of-thumb). Get contractor quotes + a written scope before underwriting a rehab budget.
Schools (NCES district)
- District
- Baldwin County
- NCES district ID
- 0100270
- Math proficiency
- 33% ▼ -26.00%
- Reading proficiency
- 57% ▲ 1.00%
- Median HH income
- $50,677
- Composite
- 38.61/100
- National rank
- #4157
- State rank
- #18 of 129 in AL
Livability — Foley
- Score
- 61/100
- State rank
- #241
- US rank
- #17616
Category grades
Schools grade is shown separately in the Schools card above.
Census & demographics
- County
- Baldwin County · 181,514 people
- City population
- 40,628
- Metro
- Daphne-Fairhope-Foley, AL
- Population (ZIP)
- 40,628
- Household income
- $66,714
- Rent vs Own
- Severe rent burden
- 803.0
Population outlook (Baldwin County) Hauer SSP2
- Today (2025)
- 248,264 people
- By 2030
- 270,315 · +8.9%
- By 2040
- 312,967 · +26.1%
- By 2050
- 352,262 · +41.9%
- By 2075
- 438,841 · +76.8%
- By 2100
- 487,736 · +96.5%
Race, ethnicity, and origin ACS 2023
- Neighborhood character
- Predominantly White (78%)
- Race & ethnicity
- White 78% Hispanic / Latino 10% Two or more races 8% Black 5% Asian 2%
- Hispanic origin (detail)
- Mexican 6%
- Common ancestry
- Lithuanian 2% Romanian 2% Slovak 1%
- Foreign-born
- 6% · Canada, China
- Languages at home
- 89% English-only · Spanish 7% Other Indo-European 2% Chinese 1%
Political lean MEDSL · Baldwin
- 2024 margin
- Solid R (+58.2) · D 20.5% · R 78.7%
- 2008→2024 swing
- -6.7pp toward R · 2008: -51.5pp · 2024: -58.2pp
- All cycles
- 2024: R+58.2 2020: R+53.8 2016: R+57.8 2012: R+55.8 2008: R+51.5
Not yet ingested
- Civics
- —
Market trends
- HPI YoY
- ▼ -86.82%
- Current HPI
- 262.2796
- Rent YoY
- ▲ 1.81%
- Metro
- Daphne-Fairhope-Foley, AL
- State GDP YoY
- ▲ 2.94%
- F500 in state
- 4
Industry mix (Fortune 500 HQ in AL)
| Industry | F500 HQs | Revenue |
|---|---|---|
| Financial Services | 1 | $8B |
|
||
| Healthcare | 1 | $5B |
|
||
Price history
1 event — show timeline
- 2026-05-18 Listed $272,540 BCAR
Cash-flow waterfall
monthlySold comps — $/sqft
last 12 mo · ≤1 miLoading sold comps…