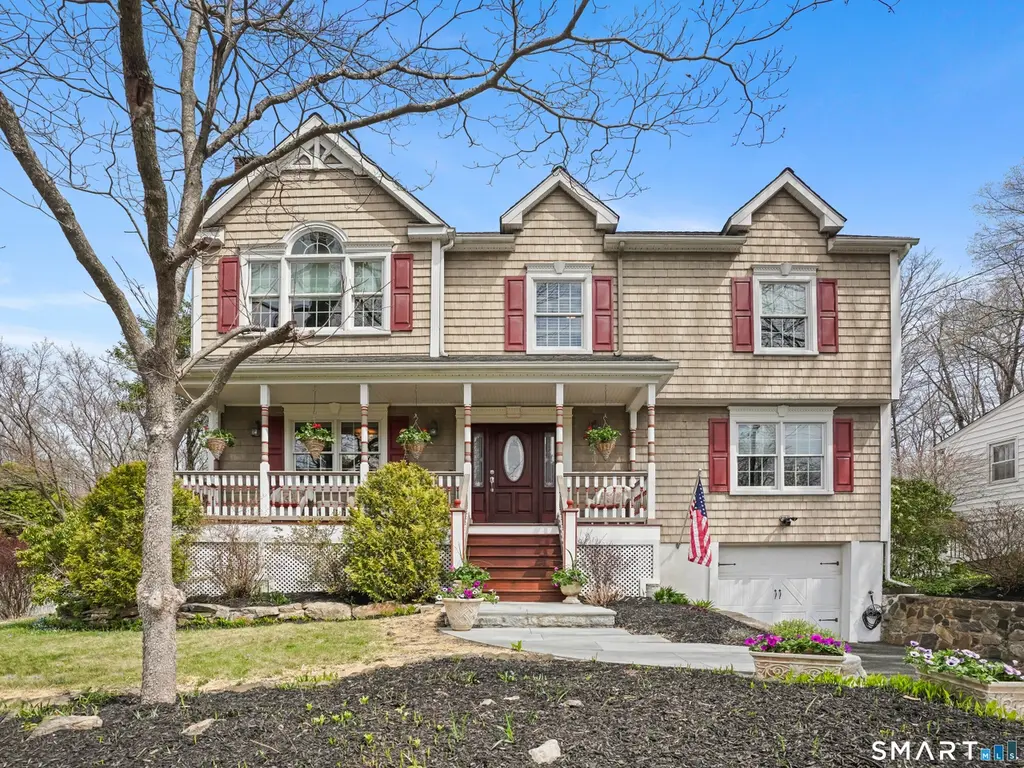
82 Ramapoo Rd · Ridgefield, CT
Flood risk 1/10 · Minimal
- FEMA flood zone
- X (unshaded)
- Chance of flooding over 30 yrs
- 0.0%
- Est. flood insurance / yr
- $473 – $860
Fire risk 1/10 · Minimal
- Est. fire insurance / yr
- $829 – $1,539
Heat risk 4/10 · Minor
- Hot days now (above 98°F)
- 7 days/yr
- Hot days in 30 yrs
- 15 days/yr
Wind risk 5/10 · Moderate
- Chance of severe wind over 30 yrs
- 25.0%
Air-quality risk 4/10 · Minor
- Unhealthy air days now
- 3 days/yr
- Unhealthy air days in 30 yrs
- 5 days/yr
Risk factors via First Street. Map © Google.
Why this score? — see what drove the F grade
The composite is a weighted blend of 9 inputs, each scored 0–100. Each bar is that input's sub-score; the figure is the points it added to the 100-point composite (weight × sub-score).
- ARV discount +10.5/15.0
- Schools +7.1/10.0
- Cash flow +5.6/30.0
- Livability +3.9/5.0
- Rent growth +2.5/5.0
- Condition / age +2.5/5.0
- 1% rule +0.6/10.0
- DSCR +0.0/10.0
- Appreciation +0.0/10.0
$949,900
🖨 Deal sheet (PDF) 📄 Offer letter ✓ Due diligence
Listing remarks
This is your chance to live close to town in a truly turn-key home! This stunning custom Colonial is perfectly situated for the ultimate Ridgefield lifestyle! Enjoy a short stroll to historic Main St, Ballard Park concerts, the Prospector Theater, and premier dining & shopping. Completely rebuilt in 2005, this 4BR/3.1BA home features gleaming hardwood floors and a true Chef's Kitchen equipped with a Viking stove and two ovens. The main level offers a bright, welcoming foyer flanked by a formal dining/living room and an open-concept kitchen/family room. The upper level boasts a large primary with soaring ceilings, a spa-like ensuite with a large tile shower, and ample closet space. Thr
Key facts
- Private deck
- Manicured backyard
- Large tile shower
Tags
Property features AI
Exterior
- Parking: Under-house garage (1 garage); Paved areas and driveway; Total 3 parking spaces
- Utilities: Public water connected; Public sewer connected
- Home design: Single-family home; Private driveway; Under-house garage; Tan exterior
- Construction: Built with frame construction; Vinyl siding; Concrete foundation; Asphalt shingle roof
- Exterior features: Level lot; Deck; Shed; Gutters; French doors
Interior
- Kitchen: Gas range; Wall oven; Range hood; Refrigerator; Dishwasher
- Bedrooms: 4 bedrooms (laundry on upper level)
- Bathrooms: 3 full bathrooms; 1 half bathroom
- Heating & cooling: Hot air heating (oil-fired); Hot water: propane, 50-gallon tank; Ceiling fans; Central air; Generator ready; Thermopane windows
- Interior features: Open floor plan; Auto garage door opener; One fireplace; Attic with pull-down stairs; Foyer
- Laundry & utility: Washer and dryer included; Laundry room on upper level
Neighborhood map
What this means for you Summary
Snapshot
- This is a 4-bed/2.5-bath single-family listed at $950k.
Deal economics
- At list price, monthly cash flow is $-2k ($-24k/yr) — negative.
- To cash-flow at today's rent, offer at most $596k (37.2% below list).
- To meet the 1% rule (rent ≥ 1% of price), the offer needs to be $534k (43.8% below list).
- Recommended offer: $534k (43.8% below list) — sets the bar for 1% rule.
- Cap rate 3.8% vs local median 2.5% in Ridgefield — top-decile yield for the area; either an underpriced asset or a hidden risk that comps aren't pricing in. Stress-test before assuming the spread holds.
Location & tenants
- Location reads 78/100 on livability (#38 in CT, #2,615 nationally) — a middle-class / working-renter tenant base. Strengths: schools A+, crime A+, employment A+; Watch: amenities F, cost of living F.
- Ridgefield School District (suburban): math 69% / reading 79% proficiency, ranked #6 of 153 in CT (top 4%) — strong family-tenant draw, lease renewals of 3-5y typical; only 2% free/reduced lunch — higher-income household profile.
- Market conditions: 140 active listings in the ZIP; 2 comparable units currently listed for rent nearby; high-income renter base; 1,151 units permitted in Western Connecticut Planning Region in 2024 (714 in 5+ unit buildings).
- This rent runs 36% of the median local income ($179k/yr) — at the standard rent-burdened threshold; future hikes will face affordability resistance.
Forward outlook
- Local home prices are declining (-3.0%/yr); year-one equity from $7k of loan paydown is wiped out by about $28k of value loss. Plan a longer hold.
Negotiation context
- It's been on market 26 days — a 2% lower offer ($936k) is reasonable based on typical stale-listing flexibility.
- 5 sale attempts since 33y ago with the ask held roughly flat each time — persistent listings suggest the price (not the market) is what's stuck; bring a comps-based counter.
- Current owner paid $175k; list at $950k implies a 443% gain — meaningful room to come down on a strong offer.
Risks & watch-outs
- Climate carrying-cost: moderate wind risk, 25% chance of damaging wind over 30y — expect insurance premiums to compound above CPI over the hold.
Questions for the listing agent
- What do current leases actually rent for vs. the listed asking? Can we see a recent rent roll and the last 12 months of T-12 income?
- Built in 1960 — when were the roof, HVAC, electrical panel, plumbing, and water heater last replaced?
- Is there a deadline driving the sale (1031 exchange, divorce, estate, relocation)? That informs how much negotiation room exists.
- Schools are A-rated — typically a magnet for longer-tenancy family renters. What's the average tenant stay here, and is there a school-zone premium baked into asking?
- The area grade is low — what's the realistic commute time and amenity access for the typical tenant pool here? Any planned neighborhood developments (good or bad) we should know about?
- What's the average days-on-market for RENTAL listings here right now (not sales)? A rising rental-DOM trend means longer vacancies and softer asking-rent achievability than the comps imply.
- What's the recent tenant-quality profile in this submarket — average credit score on applications, eviction rate, late-payment / NSF rate, and stable-employment percentage? A property-management company in the area should have these aggregated.
- How much new for-sale + rental construction is in the pipeline within 1–3 miles? Heavy new supply typically softens prices + rents 12–24 months out; constrained supply supports both.
Investment metrics
- 1% rule
- 0.56% ✗
- Cap rate
- 3.76%
- Cash-on-cash
- -9.03%
- DSCR
- 0.60
- GRM
- 14.8
CMA / ARV
- ARV (median comp)
- $1,018,570
- List price
- $949,900
- Delta
- -6.73%
- Verdict
- FAIR
- Comps
- 20 within 1.0 mi
Show comp detail 11 sales within ~0.75 mi
| Address | Dist | Beds/Ba | Sqft | Sold | Price | $/sf | Match |
|---|---|---|---|---|---|---|---|
| 4 Abbott Ave | 0.40mi | 3/2.5 (-1) | 1,943 (-5%) | 2mo | $1,100,000 | $566 | 67 |
| 22 Abbott Ave | 0.45mi | 3/2.0 (-1) | 1,931 (-5%) | 9mo | $825,000 | $427 | 56 |
| 8 Mulberry St | 0.40mi | 4/2.5 | 2,184 (+7%) | 19mo | $870,000 | $398 | 54 |
| 1 Saw Mill Hill Rd | 0.39mi | 3/2.5 (-1) | 1,846 (-10%) | 14mo | $870,000 | $471 | 50 |
| 159 Barry Ave | 0.54mi | 5/3.0 (+1) | 2,229 (+9%) | 7mo | $951,000 | $427 | 46 |
| 17 Continental Dr | 0.73mi | 4/2.5 | 2,128 (+4%) | 18mo | $765,000 | $359 | 44 |
| 13 Hillsdale Ave | 0.70mi | 3/2.0 (-1) | 1,932 (-5%) | 10mo | $960,000 | $497 | 44 |
| 17 Lafayette Ave | 0.73mi | 5/2.0 (+1) | 2,098 (+3%) | 16mo | $829,000 | $395 | 41 |
| 13 Rochambeau Ave | 0.66mi | 3/1.5 (-1) | 2,195 (+8%) | 12mo | $1,050,000 | $478 | 37 |
| 137 Holmes Rd | 0.59mi | 4/2.5 | 2,339 (+15%) | 14mo | $1,111,000 | $475 | 37 |
| 4 Washington Ave | 0.66mi | 3/2.5 (-1) | 1,872 (-8%) | 20mo | $920,000 | $491 | 34 |
Match score weights: distance 35% · size 25% · config 20% · recency 20%. Top-matched comps best support the ARV.
Projected returns pro-forma
-3.0% appreciation · 3.0% rent growth · sell at horizon
- IRR
- -32.4%
- Equity multiple
- -0.06×
- Total profit
- $-281,577
- Equity at exit
- $141,633
- IRR
- -37.9%
- Equity multiple
- -0.54×
- Total profit
- $-409,925
- Equity at exit
- $82,130
Cash invested: $265,972 (down + closing). Projections, not guarantees.
Landlord ↔ Tenant lean methodology
- Overall (STATE)
- 27 Tenant-Leaning
- State Connecticut
- 27 Tenant-Leaning · D+7
- County
- — inherits STATE
- City
- — inherits STATE
ZIP-level market 06877
- Active inventory
- 140
- Price-to-rent
- 14.8×
Monthly cashflow live
- Estimated rent
- $5,342 medium interval (Pro) →
- Mortgage (P&I)
- −$4,981
- Tax from tax record
- −$846 /mo · $10,146/yr
- Insurance
- −$396
- HOA
- −$0
- Vacancy / Maint / Mgmt
- −$1,122
- Net cashflow
- $-2,002
Break-even live
Sensitivity live
| Price | -10% $-1,465 | -5% $-1,733 | +0% $-2,002 | +5% $-2,271 | +10% $-2,540 |
|---|---|---|---|---|---|
| Rent | -10% $-2,424 | -5% $-2,213 | +0% $-2,002 | +5% $-1,791 | +10% $-1,580 |
| Rate | -1.0pp $-1,524 | -0.5pp $-1,761 | base $-2,002 | +0.5pp $-2,248 | +1.0pp $-2,499 |
UW: 25.0% down · 7.5% · 30yr · 1.5% tax · 5.0% vac · 8.0% maint · 8.0% mgmt
Financing live
Cash to close
- Down payment
- $237,475
- Closing costs
- $28,497
- Reserves months
- —
- Total cash needed
- —
Loan-product check · same deal, 3 products live
Conventional
25% down · 7.5% · 30yr
- Down + closing
- —
- Monthly P&I
- —
- Monthly cashflow
- —
- DSCR
- —
- Eligible?
- —
Personal DTI + credit; lowest rate.
DSCR
20% down · 8.5% · 30yr
- Down + closing
- —
- Monthly P&I
- —
- Monthly cashflow
- —
- DSCR
- —
- Eligible?
- —
No personal income docs; deal must DSCR.
Hard money
10% down · 12.0% · 12mo
- Down + closing
- —
- Monthly P&I
- —
- Monthly cashflow
- —
- DSCR
- —
- Eligible?
- —
Short-term bridge; refi at stabilization.
Rent comps 2 comps
| Address | Beds | Baths | Sqft | Rent | $/sqft | DOM | Units | Dist |
|---|---|---|---|---|---|---|---|---|
| 15 N Salem Rd Ridgefield, CT | 4.0 | 3.0 | 2111 | $6,300 | $2.98 | 12d | 1 | 0.44mi |
| 19 Greenfield Ave Ridgefield, CT | 3.0 | 2.0 | 1690 | $3,950 | $2.34 | 3d | 1 | 0.52mi |
Listing history 23 events
-
2026-06-13days on market $949,900 Active 26 DOM
-
2026-06-13days on market $949,900 Active 25 DOM
-
2026-06-10days on market $949,900 Active 23 DOM
-
2026-06-09days on market $949,900 Active 22 DOM
-
2026-06-08days on market $949,900 Active 21 DOM
-
2026-06-07days on market $949,900 Active 20 DOM
-
2026-06-05pricedays on market $949,900 Active 17 DOM
-
2026-06-03days on market $965,000 Active 16 DOM
-
2026-06-03days on market $965,000 Active 15 DOM
-
2026-06-01days on market $965,000 Active 14 DOM
-
2026-05-31days on market $965,000 Active 13 DOM
-
2026-05-18historical
-
2026-05-18$965,000 Active 1068-char remark
-
2026-05-09historical Under Contract - Continue to Show
-
2026-04-28status Active
-
2026-04-25historical Under Contract - Continue to Show
-
2026-04-17$950,000 Active
-
2026-04-15historical
-
1995-12-19soldstatus $175,000
-
1995-12-19soldstatus $175,000
-
1994-10-17$194,900
-
1994-10-17historical
-
1993-10-17$199,900
ⓘ Source: listings_history table (triggers on properties + properties_extension) + one-shot
backfill from property_details.listing_events for pre-trigger history.
Tax reassessment forecast CT · Partial reset (capped growth)
- Current annual tax
- $10,146 · $846/mo
- Projected year-2 tax
- $15,237 · $1,270/mo
- Expected delta
- +$5,091/yr (+$424/mo · 50.2%)
ⓘ Screening estimate from a state-policy table — verify with the county assessor before closing.
Climate risk First Street
- Flood 1/10 Low FEMA zone X (unshaded) · 0% chance over 30 yrs
- Wildfire 1/10 Low
- Heat 4/10 Moderate 7 d/yr ≥98°F today · 15 d/yr by 30 yrs out
- Wind 5/10 Major 25% chance of damaging wind over 30 yrs
- Air quality 4/10 Moderate 3 unhealthy d/yr today · 5 by 30 yrs out
Nearby sold comps map
Loading sold comps map…
Walkable amenities ~0.75 mi
Loading nearby amenities…
Taxation est. · year 1
- Rental income
- $64,108
- − Mortgage interest
- −$53,209
- − Property taxes
- −$10,146
- − Insurance
- −$4,750
- − Repairs & maintenance
- −$5,129
- − Management
- −$5,129
- − Depreciation
- −$27,633
- Taxable loss
- −$41,887
- Est. tax savings @ 24.0%
- +$10,053
- After-tax cash flow
- $-13,974/yr
For passive investors: Depreciation is non-cash, so a rental often shows a tax loss while cash-flowing — sheltering income. Rental losses are passive: they offset passive income freely, and up to $25,000/yr can offset ordinary (W-2) income if you actively participate and your MAGI is under $100k (phasing out to $0 by $150k); unused losses carry forward. On sale, claimed depreciation is recaptured at up to 25%, and gains may owe capital-gains tax (a 1031 exchange can defer both). Figures are a year-1 estimate at your 24.0% rate — not tax advice; consult a CPA.
Schools (NCES district)
- District
- Ridgefield School District
- NCES district ID
- 0903810
- Math proficiency
- 69% ▼ -9.00%
- Reading proficiency
- 79% ▼ -6.00%
- Median HH income
- $140,316
- Composite
- 71.28/100
- National rank
- #231
- State rank
- #6 of 153 in CT
Livability — Ridgefield
- Score
- 78/100
- State rank
- #38
- US rank
- #2615
Category grades
Schools grade is shown separately in the Schools card above.
Census & demographics
- Census place
- Ridgefield, CT
- County
- Fairfield County · 765,532 people
- City population
- 25,110
- Metro
- Bridgeport-Stamford-Norwalk, CT
- Population (ZIP)
- 25,110
- Household income
- $179,219
- Rent vs Own
- Severe rent burden
- 365.0
Population outlook (Western Connecticut County) Hauer SSP2
- By 2040
- 685,031
Race, ethnicity, and origin ACS 2023
- Neighborhood character
- Predominantly White (83%)
- Race & ethnicity
- White 83% Two or more races 7% Hispanic / Latino 6% Asian 4% Black 2%
- Hispanic origin (detail)
- Puerto Rican 1% Dominican 1%
- Common ancestry
- Romanian 5% Slovak 2% Lithuanian 2%
- Foreign-born
- 12% · Canada, South Korea, China
- Languages at home
- 85% English-only · Other Indo-European 7% Spanish 3% Russian/Polish/Slavic 2%
Political lean MEDSL · Western Connecticut
- 2024 margin
- D (+19.1) · D 58.8% · R 39.7% · Other 1.6%
- All cycles
- 2024: D+19.1
Not yet ingested
- Civics
- —
Market trends
- HPI YoY
- ▼ -449.63%
- Current HPI
- 234.8817
- Rent YoY
- —
- Metro
- Bridgeport-Stamford-Norwalk, CT
- State GDP YoY
- ▲ 1.06%
- F500 in state
- 38
Industry mix (Fortune 500 HQ in CT)
| Industry | F500 HQs | Revenue |
|---|---|---|
| Industrial Machinery | 4 | $38B |
|
||
| Insurance | 3 | $71B |
|
||
| Financial Services | 2 | $25B |
|
||
| Transportation / Logistics | 2 | $18B |
|
||
| Healthcare | 1 | $247B |
|
||
| Telecommunications | 1 | $55B |
|
||
Price history
+375.2% since first listed14 events — show timeline
- 2026-06-15 Listing Removed — Smart MLS
- 2026-06-03 Price Changed $949,900 Smart MLS
- 2026-05-18 Listing Removed — Smart MLS
- 2026-05-18 Listed $965,000 Smart MLS
- 2026-05-09 Contingent — Smart MLS
- 2026-04-28 Relisted — Smart MLS
- 2026-04-25 Contingent — Smart MLS
- 2026-04-17 Listed $950,000 Smart MLS
- 2026-04-15 Coming Soon — Smart MLS
- 1995-12-19 Sold (Public Records) $175,000 Public Records
- 1995-12-19 Sold (MLS) $175,000 Smart MLS
- 1994-10-17 Listing Removed — Smart MLS
- 1994-10-17 Listed $194,900 Smart MLS
- 1993-10-17 Listed $199,900 Smart MLS
Property tax history
+1.1%/yrLatest (2022): $10,146 · +0.8% YoY. Source: county tax records.
Cash-flow waterfall
monthlySold comps — $/sqft
last 12 mo · ≤1 miLoading sold comps…