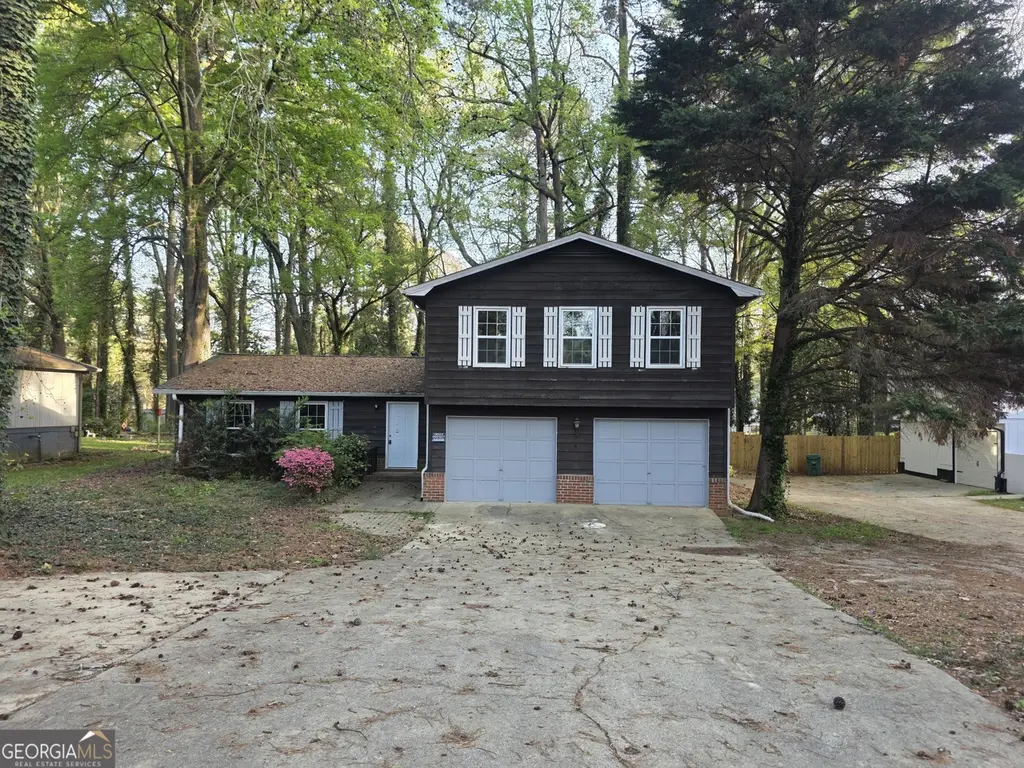
5382 Rockbridge Rd · Stone Mountain, GA
Flood risk 1/10 · Minimal
- FEMA flood zone
- X (unshaded)
- Chance of flooding over 30 yrs
- 0.0%
- Est. flood insurance / yr
- $507 – $1,088
Fire risk 1/10 · Minimal
- Est. fire insurance / yr
- $963 – $1,789
Heat risk 5/10 · Moderate
- Hot days now (above 104°F)
- 7 days/yr
- Hot days in 30 yrs
- 18 days/yr
Wind risk 5/10 · Moderate
- Chance of severe wind over 30 yrs
- 25.0%
Air-quality risk 6/10 · Moderate
- Unhealthy air days now
- 8 days/yr
- Unhealthy air days in 30 yrs
- 11 days/yr
Risk factors via First Street. Map © Google.
Why this score? — see what drove the D grade
The composite is a weighted blend of 9 inputs, each scored 0–100. Each bar is that input's sub-score; the figure is the points it added to the 100-point composite (weight × sub-score).
- ARV discount +15.0/15.0
- Cash flow +8.1/30.0
- Livability +4.0/5.0
- Rent growth +3.4/5.0
- 1% rule +3.1/10.0
- Condition / age +2.5/5.0
- DSCR +2.2/10.0
- Schools +2.1/10.0
- Appreciation +0.0/10.0
$240,000
🖨 Deal sheet (PDF) 📄 Offer letter ✓ Due diligence
Listing remarks
Unlock the potential in this spacious 4-bedroom, 2.5-bath split-level home, ready for your vision and transformation. All bedrooms situated upstairs. Main floor offers living area, kitchen, and dining room. Downstairs is another living room. This home is a true value-add opportunity, in need of a full remodel-making it the perfect canvas for investors, renovators, or buyers looking to customize every detail to their taste. Major systems have already been addressed, including a newer hot water heater, HVAC system, and updated electrical-providing a strong starting point for your renovation. Eligible buyers may explore renovation financing options such as the FHA 203(k) Loan or Fannie Mae Hom
Key facts
- 0.34 acre lot
- Garage
- Built 1974
Property features AI
Finance
- Other: Parcel number 18 038 11 029
- Financial info: Listing sold As-Is; Financing accepted: Cash, Conventional, FHA
- HOA & community: No HOA; No community features
Exterior
- Parking: Garage parking
- Utilities: Public water; Septic tank sewer; Electricity available; Cable available; High-speed internet available; Phone available
- Home design: Single-family residence (house); Multi/split levels; Built in 1974; Property listed as fixer
- Construction: Composition roof; Slab foundation; Other construction materials
- Exterior features: Lot approximately 0.34 acre; No notable lot features
Interior
- Kitchen: Other appliances
- Bedrooms: 4 bedrooms
- Flooring: Other flooring
- Bathrooms: 2 full bathrooms; 1 half bathroom (plus a lower-level half bathroom)
- Heating & cooling: Central heating (forced air); Central air conditioning; Ceiling fan(s)
- Interior features: Walk-in closet(s); Den; Family room; One fireplace
- Laundry & utility: Laundry in garage
Neighborhood map
What this means for you Summary
Snapshot
- This is a 4-bed/2.5-bath single-family listed at $240k.
Deal economics
- At list price, monthly cash flow is $-230 ($-3k/yr) — negative.
- To cash-flow at today's rent, offer at most $199k (16.9% below list).
- To meet the 1% rule (rent ≥ 1% of price), the offer needs to be $195k (18.5% below list).
- Recommended offer: $195k (18.5% below list) — sets the bar for 1% rule.
Location & tenants
- Location reads 79/100 on livability (#11 in GA, #1,977 nationally) — a middle-class / working-renter tenant base. Strengths: commute A+, cost of living A+, housing A+; Watch: employment D+, crime F.
- Dekalb County (suburban): math 19% / reading 28% proficiency, ranked #125 of 174 in GA (top 72%) — low school quality limits family demand, transient renter base, plan for 1-2y turnover; 68% free/reduced lunch — lower-income household profile, screen leases tightly.
- Zoned schools: Rockbridge Elementary School (math 8% / reading 17%, grade F, #1,032 of 1,228 statewide, top 85%, 894 students, 100% FRL); Stone Mountain Middle School (math 12% / reading 15%, grade F, #407 of 470 statewide, top 87%, 1,072 students, 100% FRL); Stone Mountain High School (math 8% / reading 12%, grade F, #365 of 424 statewide, top 88%, 1,202 students, 100% FRL) — zoned schools average 100% FRL vs 68% district-wide (32 pts higher); higher-poverty schools than district average — tighter screening recommended.
- Market conditions: Rents rising (+3.7%/yr); 220 active listings in the ZIP; 19 comparable units currently listed for rent nearby; rentals at typical pace (median 23d on market — plan ~3-4 weeks tenant-placement turnaround); 1,240 units permitted in DeKalb County in 2024 (385 in 5+ unit buildings).
- This rent runs 33% of the median local income ($70k/yr) — at the standard rent-burdened threshold; future hikes will face affordability resistance.
Forward outlook
- Local home prices are declining (-3.0%/yr); year-one equity from $2k of loan paydown is wiped out by about $7k of value loss. Plan a longer hold.
- DeKalb County population projected at +28% by 2050 — long-run rental-demand tailwind backs the buy-and-hold thesis.
Negotiation context
- It's been on market 51 days — a 3% lower offer ($233k) is reasonable based on typical stale-listing flexibility.
- 3 sale attempts with the ask held roughly flat each time — persistent listings suggest the price (not the market) is what's stuck; bring a comps-based counter.
- Current owner paid $114k; list at $240k implies a 111% gain — meaningful room to come down on a strong offer.
Risks & watch-outs
- Climate carrying-cost: moderate wind risk, 25% chance of damaging wind over 30y; extreme-heat days projected 7→18/yr by 2055 (HVAC capex compounding) — expect insurance premiums to compound above CPI over the hold.
Questions for the listing agent
- What do current leases actually rent for vs. the listed asking? Can we see a recent rent roll and the last 12 months of T-12 income?
- It's been on market 51 days. Have you received any prior offers? Is the seller open to a 19% concession, seller financing, or rate buy-down credit?
- Built in 1974 — when were the roof, HVAC, electrical panel, plumbing, and water heater last replaced?
- Is there a deadline driving the sale (1031 exchange, divorce, estate, relocation)? That informs how much negotiation room exists.
- Schools are F-rated, which usually means shorter tenancies and higher turnover. Who's the typical renter profile here, and what's been the actual vacancy rate?
- Crime grade is F in this area — have there been break-ins, vandalism, or insurance claims at this property in the last 3 years? What carrier currently insures it and at what premium?
- The area grade is low — what's the realistic commute time and amenity access for the typical tenant pool here? Any planned neighborhood developments (good or bad) we should know about?
- What's the average days-on-market for RENTAL listings here right now (not sales)? A rising rental-DOM trend means longer vacancies and softer asking-rent achievability than the comps imply.
- What's the recent tenant-quality profile in this submarket — average credit score on applications, eviction rate, late-payment / NSF rate, and stable-employment percentage? A property-management company in the area should have these aggregated.
- How much new for-sale + rental construction is in the pipeline within 1–3 miles? Heavy new supply typically softens prices + rents 12–24 months out; constrained supply supports both.
Investment metrics
- 1% rule
- 0.81% ✗
- Cap rate
- 5.14%
- Cash-on-cash
- -4.10%
- DSCR
- 0.82
- GRM
- 10.2
CMA / ARV
- ARV (median comp)
- $320,702
- List price
- $240,000
- Delta
- -25.16%
- Verdict
- UNDERPRICED
- Comps
- 20 within 1.0 mi
Show comp detail 12 sales within ~0.75 mi
| Address | Dist | Beds/Ba | Sqft | Sold | Price | $/sf | Match |
|---|---|---|---|---|---|---|---|
| 5350 Rockbridge Rd | 0.06mi | 4/2.5 | 2,280 (+7%) | 1mo | $239,000 | $105 | 84 |
| 730 Rockborough Dr | 0.24mi | 4/2.5 | 2,173 (+2%) | 1mo | $270,000 | $124 | 84 |
| 618 Rockborough Dr | 0.28mi | 4/2.5 | 2,100 (-1%) | 1mo | $265,000 | $126 | 84 |
| 5385 Martins Ln | 0.18mi | 4/2.5 | 2,000 (-6%) | 8mo | $220,000 | $110 | 75 |
| 5322 Oshea Ln | 0.39mi | 4/2.5 | 2,218 (+4%) | 2mo | $297,000 | $134 | 73 |
| 432 Rock Meadow Dr | 0.51mi | 4/2.5 | 2,086 (-2%) | 5mo | $297,000 | $142 | 69 |
| 366 O Brian Dr | 0.25mi | 4/2.0 | 2,328 (+10%) | 6mo | $275,000 | $118 | 66 |
| 439 Orchard Dr | 0.55mi | 4/2.5 | 2,275 (+7%) | 4mo | $65,000 | $29 | 60 |
| 348 Shelton Woods Ct | 0.54mi | 4/2.5 | 2,358 (+11%) | 0mo | $252,000 | $107 | 57 |
| 5242 Cindy Way | 0.58mi | 4/3.0 | 1,956 (-8%) | 2mo | $340,000 | $174 | 56 |
| 5240 Omalley Ln | 0.49mi | 4/2.5 | 1,856 (-13%) | 4mo | $295,000 | $159 | 52 |
| 709 Pepperwood Trl | 0.69mi | 3/2.5 (-1) | 1,988 (-6%) | 7mo | $282,000 | $142 | 46 |
Match score weights: distance 35% · size 25% · config 20% · recency 20%. Top-matched comps best support the ARV.
Projected returns pro-forma
-3.0% appreciation · 3.72% rent growth · sell at horizon
- IRR
- -22.3%
- Equity multiple
- 0.23×
- Total profit
- $-52,002
- Equity at exit
- $35,785
- IRR
- -14.5%
- Equity multiple
- 0.14×
- Total profit
- $-57,784
- Equity at exit
- $20,751
Cash invested: $67,200 (down + closing). Projections, not guarantees.
Landlord ↔ Tenant lean methodology
- Overall (STATE)
- 90 Strongly Landlord-Friendly
- State Georgia
- 90 Strongly Landlord-Friendly · R+3
- County
- — inherits STATE
- City
- — inherits STATE
ZIP-level market 30088
- Rents YoY
- 3.7%
- Active inventory
- 220
- Price-to-rent
- 10.2×
Monthly cashflow live
- Estimated rent
- $1,955 high interval (Pro) →
- Mortgage (P&I)
- −$1,259
- Tax from tax record
- −$416 /mo · $4,988/yr
- Insurance
- −$100
- HOA
- −$0
- Vacancy / Maint / Mgmt
- −$411
- Net cashflow
- $-230
Break-even live
Sensitivity live
| Price | -10% $-94 | -5% $-162 | +0% $-230 | +5% $-298 | +10% $-366 |
|---|---|---|---|---|---|
| Rent | -10% $-384 | -5% $-307 | +0% $-230 | +5% $-153 | +10% $-75 |
| Rate | -1.0pp $-109 | -0.5pp $-169 | base $-230 | +0.5pp $-292 | +1.0pp $-355 |
UW: 25.0% down · 7.5% · 30yr · 1.5% tax · 5.0% vac · 8.0% maint · 8.0% mgmt
Financing live
Cash to close
- Down payment
- $60,000
- Closing costs
- $7,200
- Reserves months
- —
- Total cash needed
- —
Loan-product check · same deal, 3 products live
Conventional
25% down · 7.5% · 30yr
- Down + closing
- —
- Monthly P&I
- —
- Monthly cashflow
- —
- DSCR
- —
- Eligible?
- —
Personal DTI + credit; lowest rate.
DSCR
20% down · 8.5% · 30yr
- Down + closing
- —
- Monthly P&I
- —
- Monthly cashflow
- —
- DSCR
- —
- Eligible?
- —
No personal income docs; deal must DSCR.
Hard money
10% down · 12.0% · 12mo
- Down + closing
- —
- Monthly P&I
- —
- Monthly cashflow
- —
- DSCR
- —
- Eligible?
- —
Short-term bridge; refi at stabilization.
Rent comps 19 comps
| Address | Beds | Baths | Sqft | Rent | $/sqft | DOM | Units | Dist |
|---|---|---|---|---|---|---|---|---|
| 5370 Zachary Dr Stone Mountain, GA | 4.0 | 2.0 | 1556 | $1,150 | $0.74 | 25d | 1 | 0.35mi |
| 5308 Omalley Ln Stone Mountain, GA | 4.0 | 2.5 | 1950 | $1,949 | $1.00 | 45d | 1 | 0.50mi |
| 5509 Stonehaven Way Stone Mountain, GA | 4.0 | 3.0 | 1635 | $1,899 | $1.16 | 23d | 1 | 0.64mi |
| 697 Pepperwood Trl Stone Mountain, GA | 3.0 | 2.0 | 1576 | $1,650 | $1.05 | 45d | 1 | 0.68mi |
| 779 Pepperwood Trl Stone Mountain, GA | 3.0 | 2.0 | 1458 | $1,980 | $1.36 | 0d | 1 | 0.79mi |
| 5025 Brittany Dr Stone Mountain, GA | 3.0 | 2.5 | 1484 | $1,845 | $1.24 | 14d | 1 | 0.82mi |
| 4980 Fairforest Dr Stone Mountain, GA | 3.0 | 2.0 | 2181 | $2,075 | $0.95 | 14d | 1 | 1.01mi |
| 450 Pennybrook Dr Stone Mountain, GA | 3.0 | 2.0 | 1404 | $1,750 | $1.25 | 25d | 1 | 1.05mi |
| 5482 Martins Crossing Rd Stone Mountain, GA | 3.0 | 2.0 | 1482 | $1,575 | $1.06 | 14d | 1 | 1.08mi |
| 469 Sherwood Grn Stone Mountain, GA | 3.0 | 2.0 | 1792 | $1,810 | $1.01 | 12d | 1 | 1.09mi |
| 524 Julius Dr Stone Mountain, GA | 3.0 | 2.0 | 1780 | $1,795 | $1.01 | 45d | 1 | 1.11mi |
| 905 Hemingway Rd Stone Mountain, GA | 3.0 | 2.0 | 1400 | $1,625 | $1.16 | 14d | 1 | 1.19mi |
| 5100 W Mountain St Stone Mountain, GA | 1.0–3.0 | 1.0–2.0 | 1150 | $1,484 | $1.29 | 4d | 11 | 1.26mi |
| 1047 Ridge Ave Stone Mountain, GA | 3.0 | 1.0 | 1402 | $2,150 | $1.53 | 25d | 1 | 1.29mi |
| 5811 Navarre Ct Stone Mountain, GA | 3.0 | 2.0 | 1864 | $1,911 | $1.03 | 4d | 1 | 1.41mi |
| 811 King Rd Stone Mountain, GA | 3.0 | 3.0 | 1840 | $3,300 | $1.79 | 45d | 1 | 1.42mi |
| 855 Lost Creek Cir Stone Mountain, GA | 4.0 | 2.5 | 2619 | $1,946 | $0.74 | 45d | 1 | 1.44mi |
| 1150 Rankin St Stone Mountain, GA | 2.0–3.0 | 2.5 | 1437 | $1,850 | $1.29 | 45d | 2 | 1.45mi |
| 4757 Fellswood Dr Stone Mountain, GA | 3.0 | 2.0 | 1665 | $1,900 | $1.14 | 0d | 1 | 1.46mi |
Listing history 23 events
-
2026-06-21days on market $240,000 Active 51 DOM
-
2026-06-18days on market $240,000 Active 48 DOM
-
2026-06-17days on market $240,000 Active 47 DOM
-
2026-06-16days on market $240,000 Active 46 DOM
-
2026-06-15days on market $240,000 Active 45 DOM
-
2026-06-13days on market $240,000 Active 43 DOM
-
2026-06-09days on market $240,000 Active 39 DOM
-
2026-06-08days on market $240,000 Active 38 DOM
-
2026-06-07days on market $240,000 Active 37 DOM
-
2026-06-04days on market $240,000 Active 34 DOM
-
2026-06-03days on market $240,000 Active 33 DOM
-
2026-06-02days on market $240,000 Active 32 DOM
-
2026-06-01days on market $240,000 Active 31 DOM
-
2026-05-31days on market $240,000 Active 30 DOM
-
2026-04-28$240,000 New 967-char remark
-
2025-09-30historical
-
2025-09-30historical
-
2025-06-11$244,900 Active
-
2025-06-11$244,900 New
-
2000-09-05soldstatus $113,500
-
1986-05-14soldstatus $72,500
-
1984-07-01soldstatus $16,250
-
1981-05-22soldstatus $67,800
ⓘ Source: listings_history table (triggers on properties + properties_extension) + one-shot
backfill from property_details.listing_events for pre-trigger history.
Tax reassessment forecast GA · Resets to sale price
- Current annual tax
- $4,988 · $416/mo
- Projected year-2 tax
- $4,988 · $416/mo
- Expected delta
- $0/yr ($0/mo · 0.0%)
ⓘ Screening estimate from a state-policy table — verify with the county assessor before closing.
Climate risk First Street
- Flood 1/10 Low FEMA zone X (unshaded) · 0% chance over 30 yrs
- Wildfire 1/10 Low
- Heat 5/10 Major 7 d/yr ≥104°F today · 18 d/yr by 30 yrs out
- Wind 5/10 Major 25% chance of damaging wind over 30 yrs
- Air quality 6/10 Major 8 unhealthy d/yr today · 11 by 30 yrs out
Nearby sold comps map
Loading sold comps map…
Walkable amenities ~0.75 mi
Loading nearby amenities…
Taxation est. · year 1
- Rental income
- $23,460
- − Mortgage interest
- −$13,444
- − Property taxes
- −$4,988
- − Insurance
- −$1,200
- − Repairs & maintenance
- −$1,877
- − Management
- −$1,877
- − Depreciation
- −$6,982
- Taxable loss
- −$6,908
- Est. tax savings @ 24.0%
- +$1,658
- After-tax cash flow
- $-1,100/yr
For passive investors: Depreciation is non-cash, so a rental often shows a tax loss while cash-flowing — sheltering income. Rental losses are passive: they offset passive income freely, and up to $25,000/yr can offset ordinary (W-2) income if you actively participate and your MAGI is under $100k (phasing out to $0 by $150k); unused losses carry forward. On sale, claimed depreciation is recaptured at up to 25%, and gains may owe capital-gains tax (a 1031 exchange can defer both). Figures are a year-1 estimate at your 24.0% rate — not tax advice; consult a CPA.
Schools (NCES district)
- District
- Dekalb County
- NCES district ID
- 1301740
- Math proficiency
- 19% ▼ -12.00%
- Reading proficiency
- 28% ▼ -7.00%
- Median HH income
- $51,448
- Composite
- 20.92/100
- National rank
- #8482
- State rank
- #125 of 174 in GA
Livability — Stone Mountain
- Score
- 79/100
- State rank
- #11
- US rank
- #1977
Category grades
Schools grade is shown separately in the Schools card above.
Census & demographics
- Census place
- Stone Mountain, GA
- County
- Dekalb County · 782,738 people
- City population
- 130,941
- Metro
- Atlanta-Sandy Springs-Alpharetta, GA
- Population (ZIP)
- 29,240
- Household income
- $70,325
- Rent vs Own
- Severe rent burden
- 1106.0
Population outlook (DeKalb County) Hauer SSP2
- Today (2025)
- 839,977 people
- By 2030
- 891,768 · +6.2%
- By 2040
- 988,894 · +17.7%
- By 2050
- 1,074,583 · +27.9%
- By 2075
- 1,245,026 · +48.2%
- By 2100
- 1,303,135 · +55.1%
Race, ethnicity, and origin ACS 2023
- Neighborhood character
- Predominantly Black (84%)
- Race & ethnicity
- Black 84% White 5% Hispanic / Latino 5% Two or more races 5%
- Common ancestry
- Swedish 1% Russian 1%
- Foreign-born
- 11% · Canada
- Languages at home
- 90% English-only · Spanish 4% French/Haitian/Cajun 1% Other Indo-European 1%
Political lean MEDSL · DeKalb
- 2024 margin
- Solid D (+64.8) · D 81.9% · R 17.1% · Other 1.0%
- 2008→2024 swing
- +6.1pp toward D · 2008: 58.6pp · 2024: 64.8pp
- All cycles
- 2024: D+64.8 2020: D+67.4 2016: D+64.8 2012: D+56.8 2008: D+58.6
Not yet ingested
- Civics
- —
Market trends
- HPI YoY
- ▼ -169.92%
- Current HPI
- 206.5421
- Rent YoY
- ▲ 3.72%
- Metro
- Atlanta-Sandy Springs-Alpharetta, GA
- State GDP YoY
- ▲ 2.66%
- F500 in state
- 28
Industry mix (Fortune 500 HQ in GA)
| Industry | F500 HQs | Revenue |
|---|---|---|
| Paper / Packaging | 2 | $29B |
|
||
| Retail | 1 | $160B |
|
||
| Transportation / Logistics | 1 | $91B |
|
||
| Airlines | 1 | $62B |
|
||
| Consumer Goods | 1 | $47B |
|
||
| Utilities | 1 | $25B |
|
||
Price history
+254.0% since first listed9 events — show timeline
- 2026-04-28 Listed $240,000 GAMLS
- 2025-09-30 Listing Removed — GAMLS
- 2025-09-30 Listing Removed — FMLS
- 2025-06-11 Listed $244,900 GAMLS
- 2025-06-11 Listed $244,900 FMLS
- 2000-09-05 Sold (Public Records) $113,500 Public Records
- 1986-05-14 Sold (Public Records) $72,500 Public Records
- 1984-07-01 Sold (Public Records) $16,250 Public Records
- 1981-05-22 Sold (Public Records) $67,800 Public Records
Property tax history
+4.3%/yrLatest (2025): $4,988 · -4.4% YoY. Source: county tax records.
Cash-flow waterfall
monthlySold comps — $/sqft
last 12 mo · ≤1 miLoading sold comps…