2717 Old Us Highway 64 · Plymouth, NC
Flood risk 1/10 · Minimal
- FEMA flood zone
- X (unshaded)
- Chance of flooding over 30 yrs
- 0.0%
- Est. flood insurance / yr
- $507 – $1,088
Fire risk 4/10 · Minor
- Est. fire insurance / yr
- $906 – $1,684
Heat risk 8/10 · Major
- Hot days now (above 108°F)
- 7 days/yr
- Hot days in 30 yrs
- 17 days/yr
Wind risk 8/10 · Major
- Chance of severe wind over 30 yrs
- 80.0%
Air-quality risk 2/10 · Minimal
- Unhealthy air days now
- 1 days/yr
- Unhealthy air days in 30 yrs
- 1 days/yr
Risk factors via First Street. Map © Google.
Why this score? — see what drove the C grade
The composite is a weighted blend of 9 inputs, each scored 0–100. Each bar is that input's sub-score; the figure is the points it added to the 100-point composite (weight × sub-score).
- Cash flow +15.0/30.0
- ARV discount +14.7/15.0
- Appreciation +9.7/10.0
- 1% rule +5.0/10.0
- DSCR +5.0/10.0
- Livability +2.8/5.0
- Rent growth +2.5/5.0
- Condition / age +2.5/5.0
- Schools +2.4/10.0
$21,000
🖨 Deal sheet 📄 Offer letter ✓ Due diligence
Listing remarks
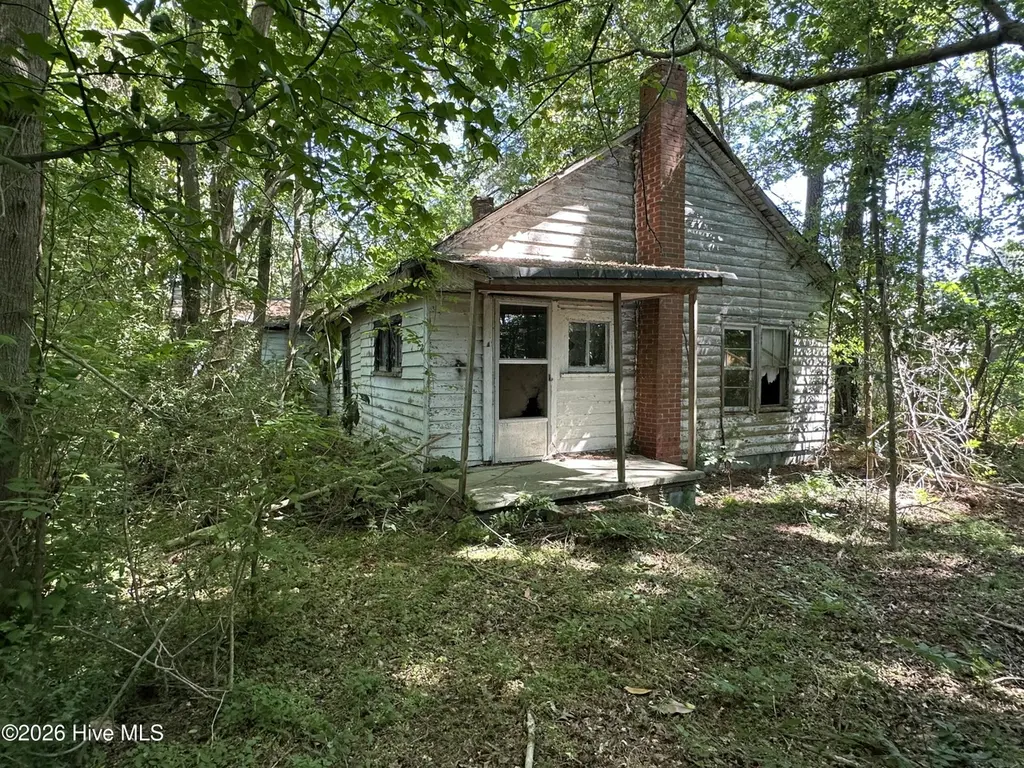
Opportunity awaits with this 4-bedroom, 1-bathroom home situated on a spacious 0.53-acre lot in Jamesville. Featuring wood siding and wood floors, this property is great for those looking to renovate, invest, or create a home with character and charm. The home includes both a covered front porch and a covered back porch, providing great outdoor space to relax or entertain while overlooking the generous yard. Inside, the layout offers ample space with four bedrooms, making it ideal for a variety of uses once updated. This property does need significant repairs but with the right vision, it presents an excellent opportunity to add value. Don't miss your chance to bring this property back to l
Key facts
- Covered front porch
- Generous yard
- Wood floors
Tags
Property features AI
Finance
- Other: Zoning: RR
Exterior
- Parking: On-site parking
- Utilities: Well water; Septic tank; No listed utilities
- Home design: Single-family residence; One story; Entry level on main floor; Wood siding/frame construction; Shingle roof; Facing information not provided
- Construction: Wood siding and frame construction; Shingle roof; Crawl space foundation; Built year not provided
- Exterior features: Covered front and rear porches; Paved road access; Has view
Interior
- Flooring: Wood flooring
- Bathrooms: One full bathroom
- Heating & cooling: No heating; No cooling
- Interior features: Wood flooring; Crawl space basement; Six total rooms; No heating or cooling
Neighborhood map
What this means for you Summary
Snapshot
- This is a 4-bed/1.0-bath single-family listed at $21k.
Deal economics
- At list price, monthly cash flow is $620 ($7k/yr) — positive.
- The deal already cash-flows at list — no discount required.
- Meets the 1% rule at list price ($948 rent vs $21k).
- Recommended offer: $20k (3.0% below list) — sets the bar for market timing.
Location & tenants
- Location reads 56/100 on livability (#627 in NC) — a working-class tenant base; expect higher turnover. Strengths: cost of living A+, health & safety A+; Watch: crime F, amenities D-, commute F.
- Martin County Schools (rural): math 24% / reading 34% proficiency, ranked #150 of 178 in NC (top 84%) — low school quality limits family demand, transient renter base, plan for 1-2y turnover; 62% free/reduced lunch — lower-income household profile, screen leases tightly.
- Zoned schools: Jamesville Elementary (math 52% / reading 57%, grade C, #302 of 1,410 statewide, top 23%, 208 students, 99% FRL); Riverside High (math 22% / reading 37%, grade F, #459 of 535 statewide, top 87%, 447 students, 99% FRL) — zoned schools average 99% FRL vs 62% district-wide (37 pts higher); higher-poverty schools than district average — tighter screening recommended.
- Zoned-school proficiency averages 42% at this address vs 29% district-wide (+13 pts) — the actual schools serving this property are materially stronger than the Martin County Schools average implies; a family-tenant draw the district grade alone would hide.
- Market conditions: 6 active listings in the ZIP.
Forward outlook
- In year one you build about $2k of equity ($145 loan paydown + $2k appreciation (9.5% local appreciation)).
- Martin County population projected at -33% by 2050 — secular population decline; favor cash flow + early exit over multi-decade hold.
- At projected returns (9.5% appreciation + 3.0% rent growth), your $6k cash investment doubles in ~1 year — after that, you're playing with house money.
Negotiation context
- It's been on market 58 days — a 3% lower offer ($20k) is reasonable based on typical stale-listing flexibility.
Risks & watch-outs
- Watch-outs: built in 1941 — expect roof / HVAC / electrical / plumbing capex.
- Climate carrying-cost: severe wind risk, 80% chance of damaging wind over 30y; extreme-heat days projected 7→17/yr by 2055 (HVAC capex compounding) — expect insurance premiums to compound above CPI over the hold.
Questions for the listing agent
- It's been on market 58 days. Have you received any prior offers? Is the seller open to a 3% concession, seller financing, or rate buy-down credit?
- Built in 1941 — when were the roof, HVAC, electrical panel, plumbing, and water heater last replaced?
- Is there a deadline driving the sale (1031 exchange, divorce, estate, relocation)? That informs how much negotiation room exists.
- Schools are F-rated, which usually means shorter tenancies and higher turnover. Who's the typical renter profile here, and what's been the actual vacancy rate?
- Crime grade is F in this area — have there been break-ins, vandalism, or insurance claims at this property in the last 3 years? What carrier currently insures it and at what premium?
- What's the average days-on-market for RENTAL listings here right now (not sales)? A rising rental-DOM trend means longer vacancies and softer asking-rent achievability than the comps imply.
- What's the recent tenant-quality profile in this submarket — average credit score on applications, eviction rate, late-payment / NSF rate, and stable-employment percentage? A property-management company in the area should have these aggregated.
- How much new for-sale + rental construction is in the pipeline within 1–3 miles? Heavy new supply typically softens prices + rents 12–24 months out; constrained supply supports both.
Investment metrics
- 1% rule
- 4.51% ✓
- Cap rate
- 41.75%
- Cash-on-cash
- 126.62%
- DSCR
- 6.63
- GRM
- 1.8
CMA / ARV
- ARV (on-the-fly)
- $24,992
- Comps found
- 1
Show comp detail 1 sale within ~0.75 mi
| Address | Dist | Beds/Ba | Sqft | Sold | Price | $/sf | Match |
|---|---|---|---|---|---|---|---|
| 1075 Apple Ln | 0.18mi | 3/2.0 (-1) | 1,012 (-11%) | 17mo | $22,000 | $22 | 50 |
Match score weights: distance 35% · size 25% · config 20% · recency 20%. Top-matched comps best support the ARV.
Projected returns pro-forma
9.48% appreciation · 3.0% rent growth · sell at horizon
- IRR
- —
- Equity multiple
- 9.54×
- Total profit
- $50,208
- Equity at exit
- $18,121
- IRR
- —
- Equity multiple
- 20.83×
- Total profit
- $116,608
- Equity at exit
- $38,260
Cash invested: $5,880 (down + closing). Projections, not guarantees.
Landlord ↔ Tenant lean methodology
- Overall (STATE)
- 85 Strongly Landlord-Friendly
- State North Carolina
- 85 Strongly Landlord-Friendly · R+3
- County
- — inherits STATE
- City
- — inherits STATE
ZIP-level market 27846
- Home prices YoY
- 6.5%
- Active inventory
- 6
- Price-to-rent
- 1.8×
Monthly cashflow live
- Estimated rent
- $948 medium interval (Pro) →
- Mortgage (P&I)
- −$110
- Tax from tax record
- −$10 /mo · $115/yr
- Insurance
- −$9
- HOA
- −$0
- Vacancy / Maint / Mgmt
- −$199
- Net cashflow
- $620
Break-even live
UW: 25.0% down · 7.5% · 30yr · 1.5% tax · 5.0% vac · 8.0% maint · 8.0% mgmt
Financing live
Cash to close
- Down payment
- $5,250
- Closing costs
- $630
- Reserves months
- —
- Total cash needed
- —
Loan-product check · same deal, 3 products live
Conventional
25% down · 7.5% · 30yr
- Down + closing
- —
- Monthly P&I
- —
- Monthly cashflow
- —
- DSCR
- —
- Eligible?
- —
Personal DTI + credit; lowest rate.
DSCR
20% down · 8.5% · 30yr
- Down + closing
- —
- Monthly P&I
- —
- Monthly cashflow
- —
- DSCR
- —
- Eligible?
- —
No personal income docs; deal must DSCR.
Hard money
10% down · 12.0% · 12mo
- Down + closing
- —
- Monthly P&I
- —
- Monthly cashflow
- —
- DSCR
- —
- Eligible?
- —
Short-term bridge; refi at stabilization.
Listing history 17 events
-
2026-06-19days on market $21,000 Active 58 DOM
-
2026-06-18days on market $21,000 Active 57 DOM
-
2026-06-17days on market $21,000 Active 56 DOM
-
2026-06-16days on market $21,000 Active 55 DOM
-
2026-06-15days on market $21,000 Active 54 DOM
-
2026-06-14days on market $21,000 Active 52 DOM
-
2026-06-12days on market $21,000 Active 51 DOM
-
2026-06-09days on market $21,000 Active 48 DOM
-
2026-06-08days on market $21,000 Active 47 DOM
-
2026-06-07pricedays on market $21,000 Active 46 DOM
-
2026-06-03days on market $23,000 Active 42 DOM
-
2026-06-02days on market $23,000 Active 41 DOM
-
2026-06-01days on market $23,000 Active 40 DOM
-
2026-05-31days on market $23,000 Active 39 DOM
-
2026-05-30days on market $23,000 Active 38 DOM
-
2026-05-21price $23,000
-
2026-04-22$25,000 Active
ⓘ Source: listings_history table (triggers on properties + properties_extension) + one-shot
backfill from property_details.listing_events for pre-trigger history.
Tax reassessment forecast NC · Resets to sale price
- Current annual tax
- $115 · $10/mo
- Projected year-2 tax
- $172 · $14/mo
- Expected delta
- +$57/yr (+$5/mo · 49.1%)
ⓘ Screening estimate from a state-policy table — verify with the county assessor before closing.
Climate risk First Street
- Flood 1/10 Low FEMA zone X (unshaded) · 0% chance over 30 yrs
- Wildfire 4/10 Moderate
- Heat 8/10 Severe 7 d/yr ≥108°F today · 17 d/yr by 30 yrs out
- Wind 8/10 Severe 80% chance of damaging wind over 30 yrs
- Air quality 2/10 Low 1 unhealthy d/yr today · 1 by 30 yrs out
Nearby sold comps map
Loading sold comps map…
Walkable amenities ~0.75 mi
Loading nearby amenities…
Taxation est. · year 1
- Rental income
- $11,376
- − Mortgage interest
- −$1,176
- − Property taxes
- −$115
- − Insurance
- −$105
- − Repairs & maintenance
- −$910
- − Management
- −$910
- − Depreciation
- −$611
- Taxable income
- $7,548
- Est. tax owed @ 24.0%
- −$1,812
- After-tax cash flow
- $5,634/yr
For passive investors: Depreciation is non-cash, so a rental often shows a tax loss while cash-flowing — sheltering income. Rental losses are passive: they offset passive income freely, and up to $25,000/yr can offset ordinary (W-2) income if you actively participate and your MAGI is under $100k (phasing out to $0 by $150k); unused losses carry forward. On sale, claimed depreciation is recaptured at up to 25%, and gains may owe capital-gains tax (a 1031 exchange can defer both). Figures are a year-1 estimate at your 24.0% rate — not tax advice; consult a CPA.
Schools (NCES district)
- District
- Martin County Schools
- NCES district ID
- 3702880
- Math proficiency
- 24% ▼ -2.00%
- Reading proficiency
- 34% ▲ 1.00%
- Median HH income
- $35,403
- Composite
- 23.94/100
- National rank
- #7781
- State rank
- #150 of 178 in NC
Livability — Plymouth
- Score
- 56/100
- State rank
- #627
- US rank
- #22812
Category grades
Schools grade is shown separately in the Schools card above.
Census & demographics
- Population (ZIP)
- 2,689
Population outlook (Martin County) Hauer SSP2
- Today (2025)
- 21,018 people
- By 2030
- 19,693 · -6.3%
- By 2040
- 16,793 · -20.1%
- By 2050
- 14,171 · -32.6%
- By 2075
- 9,804 · -53.4%
- By 2100
- 6,894 · -67.2%
Race, ethnicity, and origin ACS 2023
- Neighborhood character
- Predominantly White (73%)
- Race & ethnicity
- White 73% Black 23% Two or more races 3% Hispanic / Latino 2%
- Common ancestry
- Slovak 1% German 1% Italian 1%
- Foreign-born
- 0%
Political lean MEDSL · Martin
- 2024 margin
- R (+10.3) · D 44.6% · R 54.9%
- 2008→2024 swing
- -15.0pp toward R · 2008: 4.6pp · 2024: -10.3pp
- All cycles
- 2024: R+10.3 2020: R+5.0 2016: R+0.5 2012: D+4.4 2008: D+4.6
Not yet ingested
- Civics
- —
Market trends
- HPI YoY
- ▲ 9.48%
- Current HPI
- 155.5151
- Rent YoY
- —
- Metro
- —
- State GDP YoY
- ▲ 3.28%
- F500 in state
- 26
Industry mix (Fortune 500 HQ in NC)
| Industry | F500 HQs | Revenue |
|---|---|---|
| Financial Services | 2 | $213B |
|
||
| Retail | 2 | $95B |
|
||
| Industrial Conglomerate | 1 | $38B |
|
||
| Metals / Steel | 1 | $35B |
|
||
| Utilities | 1 | $30B |
|
||
| Industrial Machinery | 1 | $19B |
|
||
Price history
-8.0% since first listed2 events — show timeline
- 2026-05-21 Price Changed $23,000 Hive MLS
- 2026-04-22 Listed $25,000 Hive MLS
Property tax history
-7.0%/yrLatest (2025): $115 · -3.9% YoY. Source: county tax records.
Cash-flow waterfall
monthlySold comps — $/sqft
last 12 mo · ≤1 miLoading sold comps…