 Fourplex
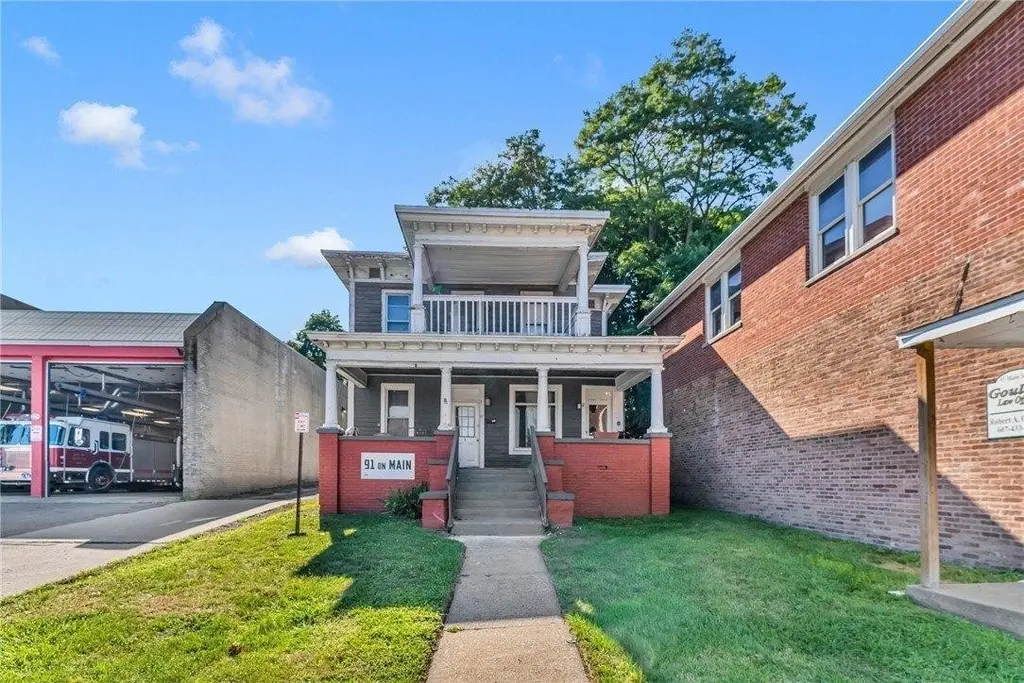
91 Main St · Oneonta, NY
Flood risk 1/10 · Minimal
- FEMA flood zone
- X (unshaded)
- Chance of flooding over 30 yrs
- 0.0%
- Est. flood insurance / yr
- $473 – $860
Fire risk 3/10 · Minor
- Est. fire insurance / yr
- $691 – $1,283
Heat risk 3/10 · Minor
- Hot days now (above 93°F)
- 8 days/yr
- Hot days in 30 yrs
- 19 days/yr
Wind risk 2/10 · Minimal
- Chance of severe wind over 30 yrs
- 1.0%
Air-quality risk 1/10 · Minimal
- Unhealthy air days now
- 0 days/yr
- Unhealthy air days in 30 yrs
- 0 days/yr
Risk factors via First Street. Map © Google.
Why this score? — see what drove the B grade
The composite is a weighted blend of 9 inputs, each scored 0–100. Each bar is that input's sub-score; the figure is the points it added to the 100-point composite (weight × sub-score).
- Cash flow +30.0/30.0
- 1% rule +10.0/10.0
- DSCR +10.0/10.0
- Appreciation +10.0/10.0
- Schools +4.3/10.0
- Livability +3.8/5.0
- Rent growth +2.5/5.0
- Condition / age +2.5/5.0
- ARV discount +0.0/15.0
$295,000
🖨 Deal sheet (PDF) 📄 Offer letter ✓ Due diligence
Multi-family units
County records classify this as Multi-Family (2-4 Unit). Listing-text estimate: 4 units. confirmed
Listing remarks
Annual income of over $36,000/year. This fully occupied 4-unit property is located right on Main St, close to both colleges, and the shopping and restaurants of downtown Oneonta. Fully occupied with an excellent rental history. This would make a great addition to anyone's portfolio.
Key facts
- 6,098 sq ft lot
- Built 1900
- Listed 23 days
Property features AI
Finance
- Other: Property taxed and assessed (assessed value and tax amounts withheld from this summary)
- Financial info: Nine total units in the building; four units in the immediate community count; Separate gas meters: 4; Separate electric meters: 4; Listed unit rents shown roughly $725–$785 for one-bedroom units; Owner pays snow removal, trash collection and water; rent includes those services; Operating expense details: see remarks
Exterior
- Parking: Gravel parking
- Utilities: Public water connected; Sewer connected; Electric and gas on separate meters for multiple units
- Home design: Two-story building; Resale property; Existing structure
- Construction: Wood frame construction; Blown-in insulation; Metal and shingle roof
- Exterior features: Rectangular lot (approximately 40 x 155)
Interior
- Kitchen: No kitchen appliance list provided
- Bedrooms: Multiple 1-bedroom units (several one-bedroom apartments)
- Flooring: Hardwood; Vinyl; Varies
- Bathrooms: Four full bathrooms total in the building; Each listed unit includes one full bathroom
- Heating & cooling: Gas forced-air heating (see remarks)
- Interior features: Hardwood, vinyl and varied flooring throughout; Full dirt-floor basement
- Laundry & utility: Gas water heater
Neighborhood map
What this means for you Summary
Snapshot
- This is a 4 × 4-bed/1.0-bath units multifamily listed at $295k.
Deal economics
- At list price, monthly cash flow is $3k ($38k/yr) — positive. Per door: $800/mo.
- The deal already cash-flows at list — no discount required.
- Meets the 1% rule at list price ($6k rent vs $295k).
- Recommended offer: $291k (1.5% below list) — sets the bar for market timing.
- Cap rate 19.3% vs local median 5.5% in Oneonta — top-decile yield for the area; either an underpriced asset or a hidden risk that comps aren't pricing in. Stress-test before assuming the spread holds.
Location & tenants
- Location reads 75/100 on livability (#253 in NY, #4,021 nationally) — a middle-class / working-renter tenant base. Strengths: housing A+, health & safety A+, cost of living B+; Watch: amenities C-, crime F, commute F.
- Oneonta City School District (town): math 46% / reading 57% proficiency, ranked #374 of 590 in NY (top 63%) — acceptable for families but not a draw, mixed tenant base, ~2y average lease.
- Zoned schools: Greater Plains Elementary School (math 37% / reading 57%, grade D-, #1,195 of 2,108 statewide, top 60%, 284 students, 40% FRL); Oneonta Middle School (math 28% / reading 56%, grade D-, #379 of 729 statewide, top 54%, 378 students, 44% FRL); Oneonta Senior High School (math 92% / reading 75%, grade A, #409 of 1,100 statewide, top 39%, 502 students, 37% FRL).
- Market conditions: 119 active listings in the ZIP; 133 units permitted in Otsego County in 2024 (10 in 5+ unit buildings).
Forward outlook
- In year one you build about $32k of equity ($2k loan paydown + $30k appreciation (10.0% local appreciation)).
- Otsego County population projected at -21% by 2050 — secular population decline; favor cash flow + early exit over multi-decade hold.
- At projected returns (10.0% appreciation + 3.0% rent growth), your $83k cash investment doubles in ~2 years — after that, you're playing with house money.
- By year 2, paydown + projected appreciation supports a ~$51k cash-out refi (75% LTV) — recoverable capital for the next deal without selling this one.
Negotiation context
- It's been on market 23 days — a 2% lower offer ($291k) is reasonable based on typical stale-listing flexibility.
- 10 sale attempts since 22y ago with the ask held roughly flat each time — persistent listings suggest the price (not the market) is what's stuck; bring a comps-based counter.
- Current owner paid $96k; list at $295k implies a 207% gain — meaningful room to come down on a strong offer.
Risks & watch-outs
- Watch-outs: built in 1900 — expect roof / HVAC / electrical / plumbing capex.
Questions for the listing agent
- Can we see the unit-by-unit rent roll, current vacancy, and any below-market leases? What's the average tenancy length?
- What capital expenditures (roof, boiler, parking lot, exteriors) have been made in the last 5 years, and what's planned in the next 2?
- Built in 1900 — when were the roof, HVAC, electrical panel, plumbing, and water heater last replaced?
- Is there a deadline driving the sale (1031 exchange, divorce, estate, relocation)? That informs how much negotiation room exists.
- Crime grade is F in this area — have there been break-ins, vandalism, or insurance claims at this property in the last 3 years? What carrier currently insures it and at what premium?
- What's the average days-on-market for RENTAL listings here right now (not sales)? A rising rental-DOM trend means longer vacancies and softer asking-rent achievability than the comps imply.
- What's the recent tenant-quality profile in this submarket — average credit score on applications, eviction rate, late-payment / NSF rate, and stable-employment percentage? A property-management company in the area should have these aggregated.
- How much new apartment / multifamily construction is in the pipeline within 1–3 miles? Heavy new supply (>2% of stock underway) typically softens rents 12–24 months out; light construction supports rent growth.
Investment metrics
- 1% rule
- 2.18% ✓
- Cap rate
- 19.30%
- Cash-on-cash
- 46.46%
- DSCR
- 3.07
- GRM
- 3.8
CMA / ARV
- ARV (on-the-fly)
- $251,576
- Comps found
- 8
Show comp detail 8 sales within ~0.75 mi
| Address | Dist | Beds/Ba | Sqft | Sold | Price | $/sf | Match |
|---|---|---|---|---|---|---|---|
| 14 Ann St | 0.24mi | 5/2.0 (-1) | 2,140 (+0%) | 9mo | $179,900 | $84 | 71 |
| 36 Grove St | 0.21mi | 6/2.0 | 2,124 (-0%) | 21mo | $215,000 | $101 | 68 |
| 27 Church St | 0.32mi | 7/2.0 (+1) | 2,354 (+10%) | 1mo | $360,000 | $153 | 58 |
| 3 Reynolds Ave | 0.35mi | 6/2.0 | 1,950 (-8%) | 15mo | $240,000 | $123 | 53 |
| 16-18 Brook St | 0.66mi | 5/2.0 (-1) | 2,000 (-6%) | 1mo | $140,000 | $70 | 49 |
| 22 Fair St | 0.58mi | 5/3.0 (-1) | 2,024 (-5%) | 23mo | $202,000 | $100 | 40 |
| 74 Ford Ave | 0.69mi | 5/2.0 (-1) | 2,076 (-3%) | 20mo | $245,000 | $118 | 38 |
| 34 Cherry St | 0.46mi | 5/2.0 (-1) | 1,882 (-12%) | 20mo | $257,000 | $137 | 33 |
Match score weights: distance 35% · size 25% · config 20% · recency 20%. Top-matched comps best support the ARV.
Projected returns pro-forma
10.0% appreciation · 3.0% rent growth · sell at horizon
- IRR
- 60.6%
- Equity multiple
- 5.41×
- Total profit
- $364,354
- Equity at exit
- $265,759
- IRR
- 54.1%
- Equity multiple
- 12.05×
- Total profit
- $912,768
- Equity at exit
- $573,120
Cash invested: $82,600 (down + closing). Projections, not guarantees.
Landlord ↔ Tenant lean methodology
- Overall (STATE)
- 15 Strongly Tenant-Friendly
- State New York
- 15 Strongly Tenant-Friendly · D+10
- County
- — inherits STATE
- City
- — inherits STATE
ZIP-level market 13820
- Home prices YoY
- 22.7%
- Active inventory
- 119
- Price-to-rent
- 15.3×
Monthly cashflow live
- Estimated rent
- $6,419 medium interval (Pro) →
- Mortgage (P&I)
- −$1,547
- Tax from tax record
- −$203 /mo · $2,435/yr
- Insurance
- −$123
- HOA
- −$0
- Vacancy / Maint / Mgmt
- −$1,348
- Net cashflow
- $3,198
Break-even live
Sensitivity live
| Price | -10% $3,365 | -5% $3,282 | +0% $3,198 | +5% $3,115 | +10% $3,031 |
|---|---|---|---|---|---|
| Rent | -10% $2,691 | -5% $2,945 | +0% $3,198 | +5% $3,452 | +10% $3,705 |
| Rate | -1.0pp $3,347 | -0.5pp $3,273 | base $3,198 | +0.5pp $3,122 | +1.0pp $3,044 |
4-unit breakdown (identical units grouped — click to expand)
| Units | Beds | Baths | Est. rent |
|---|---|---|---|
| 4× units | 4 | 1 | $6,420 |
| #1 | 4 | 1 | $1,605 |
| #2 | 4 | 1 | $1,605 |
| #3 | 4 | 1 | $1,605 |
| #4 | 4 | 1 | $1,605 |
| Total (4 units) | $6,419 | ||
UW: 25.0% down · 7.5% · 30yr · 1.5% tax · 5.0% vac · 8.0% maint · 8.0% mgmt
Financing live
Cash to close
- Down payment
- $73,750
- Closing costs
- $8,850
- Reserves months
- —
- Total cash needed
- —
Loan-product check · same deal, 3 products live
Conventional
25% down · 7.5% · 30yr
- Down + closing
- —
- Monthly P&I
- —
- Monthly cashflow
- —
- DSCR
- —
- Eligible?
- —
Personal DTI + credit; lowest rate.
DSCR
20% down · 8.5% · 30yr
- Down + closing
- —
- Monthly P&I
- —
- Monthly cashflow
- —
- DSCR
- —
- Eligible?
- —
No personal income docs; deal must DSCR.
Hard money
10% down · 12.0% · 12mo
- Down + closing
- —
- Monthly P&I
- —
- Monthly cashflow
- —
- DSCR
- —
- Eligible?
- —
Short-term bridge; refi at stabilization.
Listing history 35 events
-
2026-06-21days on market $295,000 Active 23 DOM
-
2026-06-19days on market $295,000 Active 21 DOM
-
2026-06-18days on market $295,000 Active 20 DOM
-
2026-06-17days on market $295,000 Active 19 DOM
-
2026-06-16days on market $295,000 Active 18 DOM
-
2026-06-15days on market $295,000 Active 17 DOM
-
2026-06-14days on market $295,000 Active 15 DOM
-
2026-06-12days on market $295,000 Active 14 DOM
-
2026-06-09days on market $295,000 Active 11 DOM
-
2026-06-08days on market $295,000 Active 10 DOM
-
2026-06-07days on market $295,000 Active 9 DOM
-
2026-06-07days on market $295,000 Active 8 DOM
-
2026-06-02days on market $295,000 Active 4 DOM
-
2026-06-01days on market $295,000 Active 3 DOM
-
2026-05-31days on market $295,000 Active 2 DOM
-
2026-05-29$295,000 Active
-
2026-05-03historical
-
2026-03-04price $290,000
-
2026-02-03$299,750 Active
-
2025-12-21historical
-
2025-12-20historical
-
2025-12-09price $319,750
-
2025-10-22$349,000 Active
-
2025-09-23price $849,000
-
2025-08-31$899,000 Active
-
2019-06-28soldstatus $96,000
-
2019-06-28soldstatus $96,000
-
2018-04-18$124,500
-
2018-04-18$124,500
-
2016-09-16soldstatus $60,000
-
2016-02-12$59,000
-
2008-04-10$159,500
-
2007-08-13$165,000
-
2004-09-02$169,900
-
1998-09-03soldstatus $40,000
ⓘ Source: listings_history table (triggers on properties + properties_extension) + one-shot
backfill from property_details.listing_events for pre-trigger history.
Tax reassessment forecast NY · Partial reset (capped growth)
- Current annual tax
- $2,435 · $203/mo
- Projected year-2 tax
- $3,710 · $309/mo
- Expected delta
- +$1,275/yr (+$106/mo · 52.4%)
ⓘ Screening estimate from a state-policy table — verify with the county assessor before closing.
Climate risk First Street
- Flood 1/10 Low FEMA zone X (unshaded) · 0% chance over 30 yrs
- Wildfire 3/10 Moderate
- Heat 3/10 Moderate 8 d/yr ≥93°F today · 19 d/yr by 30 yrs out
- Wind 2/10 Low 100% chance of damaging wind over 30 yrs
- Air quality 1/10 Low 0 unhealthy d/yr today · 0 by 30 yrs out
Nearby sold comps map
Loading sold comps map…
Walkable amenities ~0.75 mi
Loading nearby amenities…
Taxation est. · year 1
- Rental income
- $77,028
- − Mortgage interest
- −$16,525
- − Property taxes
- −$2,435
- − Insurance
- −$1,475
- − Repairs & maintenance
- −$6,162
- − Management
- −$6,162
- − Depreciation
- −$8,582
- Taxable income
- $35,687
- Est. tax owed @ 24.0%
- −$8,565
- After-tax cash flow
- $29,813/yr
For passive investors: Depreciation is non-cash, so a rental often shows a tax loss while cash-flowing — sheltering income. Rental losses are passive: they offset passive income freely, and up to $25,000/yr can offset ordinary (W-2) income if you actively participate and your MAGI is under $100k (phasing out to $0 by $150k); unused losses carry forward. On sale, claimed depreciation is recaptured at up to 25%, and gains may owe capital-gains tax (a 1031 exchange can defer both). Figures are a year-1 estimate at your 24.0% rate — not tax advice; consult a CPA.
Schools (NCES district)
- District
- Oneonta City School District
- NCES district ID
- 3621780
- Math proficiency
- 46% ▼ -2.00%
- Reading proficiency
- 57% ▲ 14.00%
- Median HH income
- $41,631
- Composite
- 43.19/100
- National rank
- #3066
- State rank
- #374 of 590 in NY
Livability — Oneonta
- Score
- 75/100
- State rank
- #253
- US rank
- #4021
Category grades
Schools grade is shown separately in the Schools card above.
Census & demographics
- Census place
- Oneonta, NY
- County
- Otsego County · 23,056 people
- City population
- 23,056
- Metro
- Oneonta, NY
- Population (ZIP)
- 23,056
- Household income
- $65,953
- Rent vs Own
- Severe rent burden
- 662.0
Population outlook (Otsego County) Hauer SSP2
- Today (2025)
- 57,987 people
- By 2030
- 55,403 · -4.5%
- By 2040
- 50,336 · -13.2%
- By 2050
- 45,715 · -21.2%
- By 2075
- 38,769 · -33.1%
- By 2100
- 33,468 · -42.3%
Race, ethnicity, and origin ACS 2023
- Neighborhood character
- Predominantly White (84%)
- Race & ethnicity
- White 84% Hispanic / Latino 6% Black 5% Two or more races 5% Asian 2%
- Hispanic origin (detail)
- Puerto Rican 2%
- Common ancestry
- Romanian 4% Slovak 2% Lithuanian 2%
- Foreign-born
- 5% · Canada, China
- Languages at home
- 94% English-only · Spanish 3% Russian/Polish/Slavic 1% Other Indo-European 1%
Political lean MEDSL · Otsego
- 2024 margin
- Lean R (+7.9) · D 46.1% · R 53.9%
- 2008→2024 swing
- -13.8pp toward R · 2008: 5.9pp · 2024: -7.9pp
- All cycles
- 2024: R+7.9 2020: R+5.0 2016: R+13.0 2012: D+2.0 2008: D+5.9
Not yet ingested
- Civics
- —
Market trends
- HPI YoY
- ▲ 67.86%
- Current HPI
- 366.3391
- Rent YoY
- —
- Metro
- Oneonta, NY
- State GDP YoY
- ▲ 2.60%
- F500 in state
- 92
Industry mix (Fortune 500 HQ in NY)
| Industry | F500 HQs | Revenue |
|---|---|---|
| Financial Services | 10 | $950B |
|
||
| Consumer Goods | 9 | $162B |
|
||
| Insurance | 4 | $225B |
|
||
| Telecommunications | 2 | $144B |
|
||
| Pharmaceuticals | 2 | $112B |
|
||
| Media / Entertainment | 2 | $69B |
|
||
Price history
+637.5% since first listed20 events — show timeline
- 2026-05-29 Listed $295,000 UNYREIS
- 2026-05-03 Listing Removed — UNYREIS
- 2026-03-04 Price Changed $290,000 UNYREIS
- 2026-02-03 Listed $299,750 UNYREIS
- 2025-12-21 Listing Removed — UNYREIS
- 2025-12-20 Listing Removed — UNYREIS
- 2025-12-09 Price Changed $319,750 UNYREIS
- 2025-10-22 Listed $349,000 UNYREIS
- 2025-09-23 Price Changed $849,000 UNYREIS
- 2025-08-31 Listed $899,000 UNYREIS
- 2019-06-28 Sold (MLS) $96,000 ODBOR
- 2019-06-28 Sold (MLS) $96,000 UNYREIS
- 2018-04-18 Listed $124,500 ODBOR
- 2018-04-18 Listed $124,500 UNYREIS
- 2016-09-16 Sold (MLS) $60,000 UNYREIS
- 2016-02-12 Listed $59,000 UNYREIS
- 2008-04-10 Listed $159,500 UNYREIS
- 2007-08-13 Listed $165,000 UNYREIS
- 2004-09-02 Listed $169,900 UNYREIS
- 1998-09-03 Sold (Public Records) $40,000 Public Records
Property tax history
-9.3%/yrLatest (2025): $2,435 · +5.8% YoY. Source: county tax records.
Cash-flow waterfall
monthlySold comps — $/sqft
last 12 mo · ≤1 miLoading sold comps…