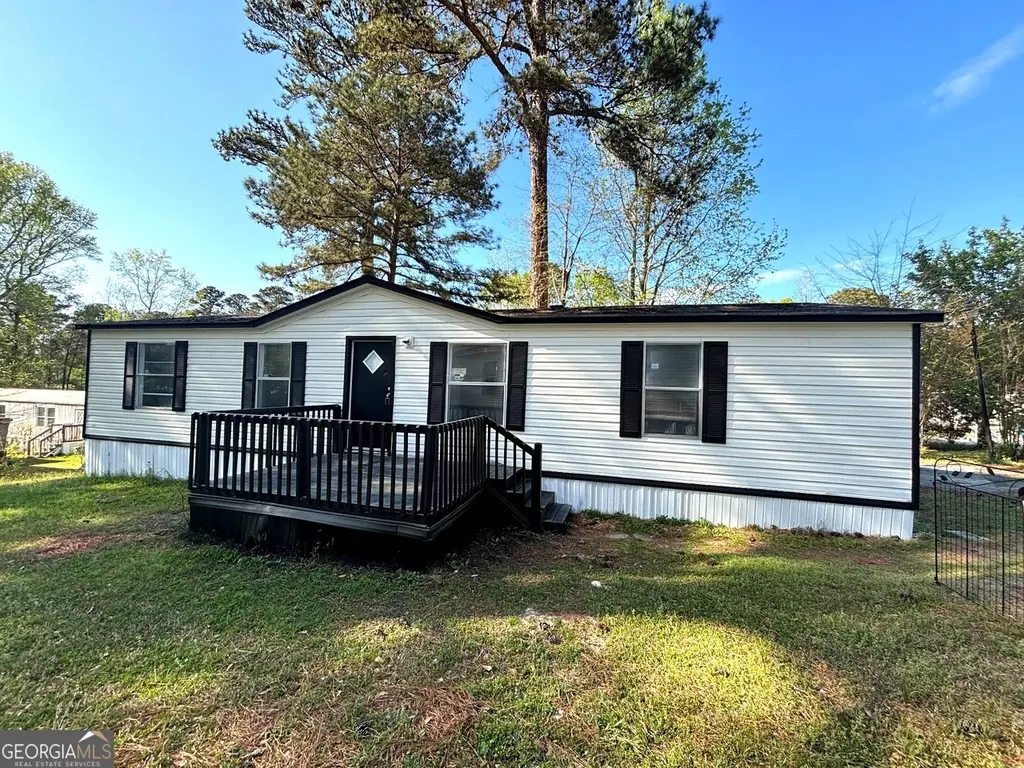
479 Windsor Pkwy · Hampton, GA
Flood risk No data
- FEMA flood zone
- —
- Chance of flooding over 30 yrs
- —
- Est. flood insurance / yr
- —
Fire risk No data
- Est. fire insurance / yr
- —
Heat risk No data
- Hot days now (above threshold)
- —
- Hot days in 30 yrs
- —
Wind risk No data
- Chance of severe wind over 30 yrs
- —
Air-quality risk No data
- Unhealthy air days now
- —
- Unhealthy air days in 30 yrs
- —
Risk factors via First Street. Map © Google.
Why this score? — see what drove the B grade
The composite is a weighted blend of 9 inputs, each scored 0–100. Each bar is that input's sub-score; the figure is the points it added to the 100-point composite (weight × sub-score).
- Cash flow +30.0/30.0
- 1% rule +10.0/10.0
- DSCR +10.0/10.0
- ARV discount +7.5/15.0
- Condition / age +4.0/5.0
- Livability +3.2/5.0
- Rent growth +3.1/5.0
- Schools +2.6/10.0
- Appreciation +0.0/10.0
$65,500
🖨 Deal sheet 📄 Offer letter ✓ Due diligence
Listing remarks
Awesome Henry County Home For Sale! * * Have a home to sell? BUY THIS HOME AND WE'LL BUY YOURS! Welcome home to this spacious 3 bedroom, 2 bathroom mobile home with 1,600 square feet of living space, providing a bright open layout. The interior has been completely renovated from subfloors up with brand new finishes throughout. You'll find modern flooring, updated lighting, a beautiful large kitchen with new cabinets, countertops, and appliances, and fully updated bathrooms featuring ceramic tile finishes. This home is located in the Clover Ranch, a peaceful and welcoming community offering various amenities such as a swimming pool, clubhouse, basketball court, soccer field, and a picnic a
Key facts
- Modern flooring
- Large kitchen
- New cabinets
Tags
Property features AI
Finance
- Other: Listing offers cash and private financing options
- Financial info: Land lease
- HOA & community: No HOA; Community clubhouse, playground, and pool
Exterior
- Parking: Parking pad / open parking
- Utilities: Public water; Public sewer; Electricity available; High speed internet available; Cable available; Sewer connected; Water available
- Home design: Manufactured home (manufactured house); Single-family residence; Residential property; Built in 1998
- Construction: Vinyl siding; Composition roof; Built in 1998
- Exterior features: Deck; Level lot
Interior
- Kitchen: Refrigerator; Electric water heater
- Bedrooms: 3 bedrooms on the main level
- Flooring: Hardwood floors
- Bathrooms: 2 full bathrooms on the main level
- Heating & cooling: Central heating; Central air; Ceiling fan(s)
- Interior features: Updated/remodeled condition; One level (single-story); Owner-reported living area 1600; Family room; Mud room
- Laundry & utility: Laundry area (mud room)
Neighborhood map
What this means for you Summary
Snapshot
- This is a 3-bed/2.0-bath single-family listed at $66k. Condition is rated good.
Deal economics
- At list price, monthly cash flow is $1k ($14k/yr) — positive.
- The deal already cash-flows at list — no discount required.
- Meets the 1% rule at list price ($2k rent vs $66k).
- Recommended offer: $64k (3.0% below list) — sets the bar for market timing.
- Cap rate 27.0% vs local median 4.5% in Hampton — top-decile yield for the area; either an underpriced asset or a hidden risk that comps aren't pricing in. Stress-test before assuming the spread holds.
Location & tenants
- Location reads 65/100 on livability (#213 in GA) — a middle-class / working-renter tenant base. Strengths: cost of living A+, housing A+, crime A-; Watch: amenities F, commute F, health & safety F.
- Henry County (rural): math 24% / reading 33% proficiency, ranked #89 of 174 in GA (top 51%) — low school quality limits family demand, transient renter base, plan for 1-2y turnover.
- Zoned schools: Hampton Middle School (math 18% / reading 33%, grade F, #288 of 470 statewide, top 62%, 850 students, 62% FRL) — zoned schools average 62% FRL vs 43% district-wide (19 pts higher); higher-poverty schools than district average — tighter screening recommended.
- Market conditions: Rents rising (+2.2%/yr); 547 active listings in the ZIP; 11 comparable units currently listed for rent nearby; rentals at typical pace (median 24d on market — plan ~3-4 weeks tenant-placement turnaround); solid renter incomes; 1,989 units permitted in Henry County in 2024 (92 in 5+ unit buildings).
Forward outlook
- Local home prices are declining (-3.0%/yr); year-one equity from $453 of loan paydown is wiped out by about $2k of value loss. Plan a longer hold.
- Henry County population projected at +29% by 2050 — long-run rental-demand tailwind backs the buy-and-hold thesis.
- At projected returns (-3.0% appreciation + 2.2% rent growth), your $18k cash investment doubles in ~2 years — after that, you're playing with house money.
Negotiation context
- It's been on market 32 days — a 3% lower offer ($64k) is reasonable based on typical stale-listing flexibility.
Questions for the listing agent
- It's been on market 32 days. Have you received any prior offers? Is the seller open to a 3% concession, seller financing, or rate buy-down credit?
- Is there a deadline driving the sale (1031 exchange, divorce, estate, relocation)? That informs how much negotiation room exists.
- Schools are F-rated, which usually means shorter tenancies and higher turnover. Who's the typical renter profile here, and what's been the actual vacancy rate?
- What's the average days-on-market for RENTAL listings here right now (not sales)? A rising rental-DOM trend means longer vacancies and softer asking-rent achievability than the comps imply.
- What's the recent tenant-quality profile in this submarket — average credit score on applications, eviction rate, late-payment / NSF rate, and stable-employment percentage? A property-management company in the area should have these aggregated.
- How much new for-sale + rental construction is in the pipeline within 1–3 miles? Heavy new supply typically softens prices + rents 12–24 months out; constrained supply supports both.
Investment metrics
- 1% rule
- 3.06% ✓
- Cap rate
- 27.02%
- Cash-on-cash
- 74.03%
- DSCR
- 4.29
- GRM
- 2.7
CMA / ARV
- ARV (on-the-fly)
- $251,200
- Comps found
- 12
Show comp detail 12 sales within ~0.75 mi
| Address | Dist | Beds/Ba | Sqft | Sold | Price | $/sf | Match |
|---|---|---|---|---|---|---|---|
| 130 Nicki Ct | 0.45mi | 3/2.0 | 1,593 (-0%) | 2mo | $263,000 | $165 | 76 |
| 2 Cindy Ct | 0.46mi | 3/2.0 | 1,568 (-2%) | 2mo | $258,000 | $165 | 74 |
| 108 Nicki Ct | 0.44mi | 3/2.0 | 1,742 (+9%) | 1mo | $240,000 | $138 | 64 |
| 25 Georgia Ave | 0.73mi | 3/2.0 | 1,518 (-5%) | 1mo | $195,000 | $128 | 56 |
| 106 June Ct | 0.28mi | 3/2.0 | 1,398 (-13%) | 11mo | $270,000 | $193 | 56 |
| 5 Jeriana Dr | 0.52mi | 4/2.0 (+1) | 1,718 (+7%) | 7mo | $270,000 | $157 | 52 |
| 1669 Graystone Dr | 0.55mi | 3/2.0 | 1,400 (-12%) | 2mo | $249,900 | $179 | 52 |
| 16 Jeriana Dr | 0.61mi | 4/2.0 (+1) | 1,681 (+5%) | 8mo | $195,000 | $116 | 51 |
| 1013 Bluecoat Cir | 0.46mi | 3/2.0 | 1,397 (-13%) | 13mo | $265,000 | $190 | 46 |
| 15 Porter Cir | 0.57mi | 3/2.0 | 1,796 (+12%) | 11mo | $246,500 | $137 | 44 |
| 8 Central Ave | 0.70mi | 2/2.0 (-1) | 1,661 (+4%) | 18mo | $220,000 | $132 | 41 |
| 20 Porter Ct | 0.59mi | 4/1.5 (+1) | 1,375 (-14%) | 14mo | $215,000 | $156 | 30 |
Match score weights: distance 35% · size 25% · config 20% · recency 20%. Top-matched comps best support the ARV.
Projected returns pro-forma
-3.0% appreciation · 2.2% rent growth · sell at horizon
- IRR
- 72.9%
- Equity multiple
- 4.26×
- Total profit
- $59,878
- Equity at exit
- $9,766
- IRR
- 76.6%
- Equity multiple
- 8.56×
- Total profit
- $138,590
- Equity at exit
- $5,663
Cash invested: $18,340 (down + closing). Projections, not guarantees.
Landlord ↔ Tenant lean methodology
- Overall (STATE)
- 90 Strongly Landlord-Friendly
- State Georgia
- 90 Strongly Landlord-Friendly · R+3
- County
- — inherits STATE
- City
- — inherits STATE
ZIP-level market 30228
- Home prices YoY
- -24.3%
- Rents YoY
- 2.2%
- Active inventory
- 547
- Price-to-rent
- 2.7×
Monthly cashflow live
- Estimated rent
- $2,005 high interval (Pro) →
- Mortgage (P&I)
- −$343
- Tax est. 1.5%
- −$82 /mo · $982/yr
- Insurance
- −$27
- HOA
- −$0
- Vacancy / Maint / Mgmt
- −$421
- Net cashflow
- $1,131
Break-even live
UW: 25.0% down · 7.5% · 30yr · 1.5% tax · 5.0% vac · 8.0% maint · 8.0% mgmt
Financing live
Cash to close
- Down payment
- $16,375
- Closing costs
- $1,965
- Reserves months
- —
- Total cash needed
- —
Loan-product check · same deal, 3 products live
Conventional
25% down · 7.5% · 30yr
- Down + closing
- —
- Monthly P&I
- —
- Monthly cashflow
- —
- DSCR
- —
- Eligible?
- —
Personal DTI + credit; lowest rate.
DSCR
20% down · 8.5% · 30yr
- Down + closing
- —
- Monthly P&I
- —
- Monthly cashflow
- —
- DSCR
- —
- Eligible?
- —
No personal income docs; deal must DSCR.
Hard money
10% down · 12.0% · 12mo
- Down + closing
- —
- Monthly P&I
- —
- Monthly cashflow
- —
- DSCR
- —
- Eligible?
- —
Short-term bridge; refi at stabilization.
Rent comps 11 comps
| Address | Beds | Baths | Sqft | Rent | $/sqft | DOM | Units | Dist |
|---|---|---|---|---|---|---|---|---|
| 925 Revere Way Hampton, GA | 4.0 | 2.5 | 2159 | $1,995 | $0.92 | 24d | 1 | 0.43mi |
| 637 Lynchburg St Hampton, GA | 4.0 | 2.5 | 1867 | $2,100 | $1.12 | 24d | 1 | 0.62mi |
| 1299 N Hampton Dr Hampton, GA | 3.0 | 2.0 | 1232 | $1,790 | $1.45 | 5d | 1 | 0.78mi |
| 1514 N Hampton Ct Hampton, GA | 3.0 | 2.0 | 1208 | $1,700 | $1.41 | 12d | 1 | 0.82mi |
| 1323 N Hampton Dr Hampton, GA | 3.0 | 2.0 | 1208 | $1,794 | $1.49 | 43d | 1 | 0.83mi |
| 2074 Boatswain Dr Hampton, GA | 3.0 | 2.5 | 1490 | $1,965 | $1.32 | 20d | 1 | 0.84mi |
| 1330 N Hampton Dr Hampton, GA | 3.0 | 2.0 | 1228 | $1,685 | $1.37 | 12d | 1 | 0.86mi |
| 9 W Main St Hampton, GA | 3.0 | 2.0 | 1560 | $1,713 | $1.10 | 24d | 1 | 0.89mi |
| 1905 Elm Park Dr Hampton, GA | 3.0 | 2.5 | 1739 | $1,905 | $1.10 | 1d | 1 | 1.04mi |
| 816 Marcus Ln Hampton, GA | 3.0 | 2.5 | 2084 | $1,889 | $0.91 | 43d | 1 | 1.05mi |
| 20 Windpher Rdg Hampton, GA | 3.0 | 2.0 | 1694 | $2,090 | $1.23 | 43d | 1 | 1.46mi |
Listing history 14 events
-
2026-06-18days on market $65,500 Active 32 DOM
-
2026-06-17days on market $65,500 Active 31 DOM
-
2026-06-16days on market $65,500 Active 30 DOM
-
2026-06-15days on market $65,500 Active 29 DOM
-
2026-06-13days on market $65,500 Active 27 DOM
-
2026-06-09days on market $65,500 Active 23 DOM
-
2026-06-08days on market $65,500 Active 22 DOM
-
2026-06-07days on market $65,500 Active 21 DOM
-
2026-06-04days on market $65,500 Active 18 DOM
-
2026-06-03days on market $65,500 Active 17 DOM
-
2026-06-02days on market $65,500 Active 16 DOM
-
2026-06-01days on market $65,500 Active 15 DOM
-
2026-05-31statusdays on market $65,500 Active 14 DOM
-
2026-05-15$65,500 New
ⓘ Source: listings_history table (triggers on properties + properties_extension) + one-shot
backfill from property_details.listing_events for pre-trigger history.
Nearby sold comps map
Loading sold comps map…
Walkable amenities ~0.75 mi
Loading nearby amenities…
Taxation est. · year 1
- Rental income
- $24,062
- − Mortgage interest
- −$3,669
- − Property taxes
- −$982
- − Insurance
- −$328
- − Repairs & maintenance
- −$1,925
- − Management
- −$1,925
- − Depreciation
- −$1,905
- Taxable income
- $13,328
- Est. tax owed @ 24.0%
- −$3,199
- After-tax cash flow
- $10,379/yr
For passive investors: Depreciation is non-cash, so a rental often shows a tax loss while cash-flowing — sheltering income. Rental losses are passive: they offset passive income freely, and up to $25,000/yr can offset ordinary (W-2) income if you actively participate and your MAGI is under $100k (phasing out to $0 by $150k); unused losses carry forward. On sale, claimed depreciation is recaptured at up to 25%, and gains may owe capital-gains tax (a 1031 exchange can defer both). Figures are a year-1 estimate at your 24.0% rate — not tax advice; consult a CPA.
Condition & rehab AI · 9 photos
This mobile home is in excellent condition with recent renovations, making it move-in ready and ideal for both resale and rental.
Value-add opportunities
- Both Paint exterior trim — Enhances curb appeal and value
- Both Replace outdoor lighting — Improves safety and enhances curb appeal
- Both Install smart home devices — Enhances convenience and adds modern appeal
Renovation cost estimate screening
Value-add ROI direction
- Both Paint exterior trim — Enhances curb appeal and value ↑
- Both Replace outdoor lighting — Improves safety and enhances curb appeal ↑
- Both Install smart home devices — Enhances convenience and adds modern appeal ↑
ⓘ Cost ranges are severity-bucket heuristics (US national rule-of-thumb). Get contractor quotes + a written scope before underwriting a rehab budget.
Schools (NCES district)
- District
- Henry County
- NCES district ID
- 1302820
- Math proficiency
- 24% ▼ -9.00%
- Reading proficiency
- 33% ▼ -7.00%
- Median HH income
- $62,594
- Composite
- 26.13/100
- National rank
- #7279
- State rank
- #89 of 174 in GA
Livability — Hampton
- Score
- 65/100
- State rank
- #213
- US rank
- #12664
Category grades
Schools grade is shown separately in the Schools card above.
Census & demographics
- Census place
- Hampton, GA
- County
- Henry County · 316,359 people
- City population
- 52,402
- Metro
- Atlanta-Sandy Springs-Alpharetta, GA
- Population (ZIP)
- 52,402
- Household income
- $82,619
- Rent vs Own
- Severe rent burden
- 1285.0
Population outlook (Henry County) Hauer SSP2
- Today (2025)
- 249,041 people
- By 2030
- 264,369 · +6.2%
- By 2040
- 294,459 · +18.2%
- By 2050
- 322,249 · +29.4%
- By 2075
- 392,310 · +57.5%
- By 2100
- 437,836 · +75.8%
Race, ethnicity, and origin ACS 2023
- Neighborhood character
- Majority Black (63%)
- Race & ethnicity
- Black 63% White 23% Hispanic / Latino 8% Two or more races 6% Asian 2%
- Hispanic origin (detail)
- Mexican 5% Puerto Rican 1%
- Common ancestry
- Hispanic 4% Lithuanian 1% Italian 1%
- Foreign-born
- 9% · Canada, Vietnam, Jamaica
- Languages at home
- 89% English-only · Spanish 6% French/Haitian/Cajun 2% Vietnamese 1%
Political lean MEDSL · Henry
- 2024 margin
- Strong D (+29.7) · D 64.5% · R 34.9%
- 2008→2024 swing
- +37.1pp toward D · 2008: -7.5pp · 2024: 29.7pp
- All cycles
- 2024: D+29.7 2020: D+20.5 2016: D+4.3 2012: R+3.2 2008: R+7.5
Not yet ingested
- Civics
- —
Market trends
- HPI YoY
- ▼ -71.11%
- Current HPI
- 222.0357
- Rent YoY
- ▲ 2.20%
- Metro
- Atlanta-Sandy Springs-Alpharetta, GA
- State GDP YoY
- ▲ 2.66%
- F500 in state
- 28
Industry mix (Fortune 500 HQ in GA)
| Industry | F500 HQs | Revenue |
|---|---|---|
| Paper / Packaging | 2 | $29B |
|
||
| Retail | 1 | $160B |
|
||
| Transportation / Logistics | 1 | $91B |
|
||
| Airlines | 1 | $62B |
|
||
| Consumer Goods | 1 | $47B |
|
||
| Utilities | 1 | $25B |
|
||
Price history
1 event — show timeline
- 2026-05-15 Listed $65,500 GAMLS
Cash-flow waterfall
monthlySold comps — $/sqft
last 12 mo · ≤1 miLoading sold comps…