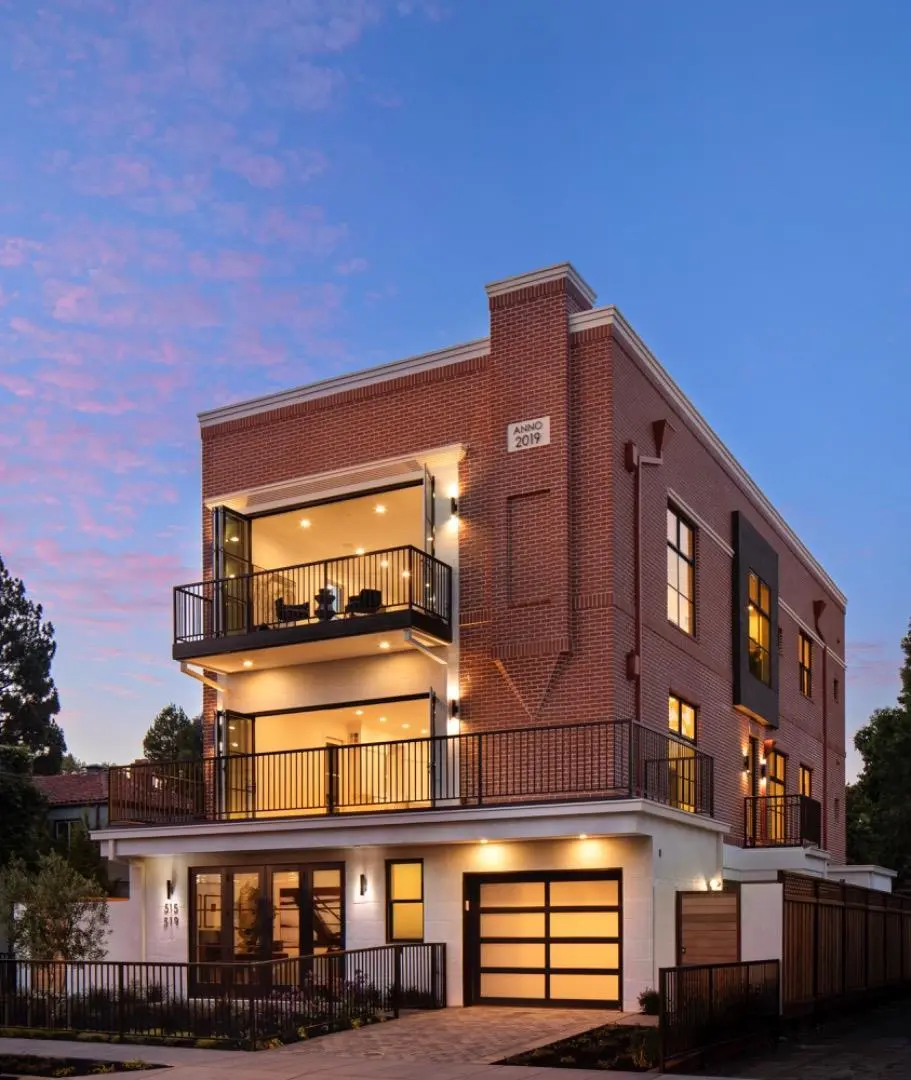
519 Webster · Palo Alto, CA
Flood risk 1/10 · Minimal
- FEMA flood zone
- AH
- Chance of flooding over 30 yrs
- 0.0%
- Est. flood insurance / yr
- $1,142 – $2,507
Fire risk 1/10 · Minimal
- Est. fire insurance / yr
- $659 – $1,223
Heat risk 3/10 · Minor
- Hot days now (above 90°F)
- 7 days/yr
- Hot days in 30 yrs
- 14 days/yr
Wind risk 1/10 · Minimal
- Chance of severe wind over 30 yrs
- —
Air-quality risk 7/10 · Major
- Unhealthy air days now
- 12 days/yr
- Unhealthy air days in 30 yrs
- 12 days/yr
Risk factors via First Street. Map © Google.
Why this score? — see what drove the D- grade
The composite is a weighted blend of 9 inputs, each scored 0–100. Each bar is that input's sub-score; the figure is the points it added to the 100-point composite (weight × sub-score).
- ARV discount +15.0/15.0
- Schools +7.4/10.0
- Appreciation +5.5/10.0
- Rent growth +4.3/5.0
- Livability +4.2/5.0
- Condition / age +2.5/5.0
- Cash flow +0.0/30.0
- 1% rule +0.0/10.0
- DSCR +0.0/10.0
$6,495,000
🖨 Deal sheet (PDF) 📄 Offer letter ✓ Due diligence
Listing remarks MLS
Downtown Palo Alto's most exclusive & high-end Penthouse now available for sale. Live among the birds on the 3rd & 4th floor living spaces and expansive roof deck with ultimate privacy and unparalleled natural light in every direction. Enter your private vestibule on the main floor and head up to your exclusive retreat via elevator. Elevator opens directly into penthouse foyer. Features stunning great room with 10' ceilings & nana door/walls of glass that fold open to the west. High-end chefs kitchens with custom cabinetry & Thermador appliances. Palo Altos most exclusive and private roof terrace is roughly 1,900sf and accessed through an interior atrium, a space unlike any other outdoor living space in all of downtown Palo Alto. Sizable and elegant alike, the roof deck includes a fire pit with several different living & dining spaces and views of the Palo Alto skyline and western hills. Primary suite with spa-like bath, two other bedrooms with en-suite bathrooms, plus a board room/office/gym with half bath. Oversized, private 2 car garage with EV charging. 2 Parcels off University Ave in the heart of vibrant, sought after downtown Palo Alto makes this Penthouse living a once in a generation opportunity.
Key facts
- Custom cabinetry
- Private roof terrace
- Thermador appliances
Tags
Property features AI
Finance
- HOA & community: Common interest development
Exterior
- Parking: Detached 2-car garage with gate/door opener; Electric vehicle Level 1 (120V) hookup
- Security: Fire sprinkler system; Secured garage/parking
- Utilities: Public sewer; Individual electric meters; Individual gas meters; Individual water meter (public water); Public utilities
- Home design: Common interest development; 3 stories
- Construction: Concrete slab foundation; 3-story building
- Exterior features: Tile roof; Barbecue area; Fire pit; Low-maintenance yard; Other outdoor features (see remarks)
Interior
- Kitchen: Dishwasher; Garbage disposal; Range hood; Kitchen island; Microwave; Gas range; Refrigerator
- Bedrooms: 3 bedrooms including a primary suite with walk-in closet
- Flooring: Hardwood floors
- Bathrooms: 3 full bathrooms; 2 half bathrooms; Primary bathroom with stall shower(s), marble surfaces, and double sinks
- Heating & cooling: Central forced air heating; Central forced air cooling
- Interior features: Den/Study/Office; Fireplace in living room; Elevator/Lift; Fire sprinkler system; Secured garage/parking
- Laundry & utility: Indoor laundry with washer and dryer
Neighborhood map
What this means for you Summary
Snapshot
- This is a 3-bed/4.0-bath townhouse listed at $6.50M.
Deal economics
- At list price, monthly cash flow is $-38k ($-459k/yr) — negative.
- To cash-flow at today's rent, offer at most $660k (89.8% below list).
- To meet the 1% rule (rent ≥ 1% of price), the offer needs to be $596k (90.8% below list).
- Recommended offer: $596k (90.8% below list) — sets the bar for 1% rule.
- Cap rate -0.7% vs local median 0.4% in Palo Alto — below-typical yield; the buyer is paying a premium for something (appreciation thesis, condition, location) that the cap rate doesn't capture.
Location & tenants
- Location reads 84/100 on livability (#19 in CA, #821 nationally) — a professional / high-income tenant draw. Strengths: amenities A+, commute A+, employment A+; Watch: cost of living F.
- Palo Alto Unified (urban): math 79% / reading 80% proficiency, ranked #19 of 517 in CA (top 4%) — strong family-tenant draw, lease renewals of 3-5y typical; only 7% free/reduced lunch — higher-income household profile.
- Zoned schools: Ohlone Elementary (math 81% / reading 81%, grade A+, #54 of 1,571 statewide, top 3%, 463 students, 7% FRL); Frank S. Greene Jr. Middle (math 74% / reading 77%, grade A, #24 of 498 statewide, top 5%, 755 students, 13% FRL); Palo Alto High (math 87% / reading 87%, grade A, #21 of 1,170 statewide, top 2%, 1,992 students, 10% FRL) — zoned schools at 10% FRL track the district average.
- Market conditions: Rents rising fast (+7.4%/yr); 33 active listings in the ZIP; high-income renter base; 3,838 units permitted in Santa Clara County in 2024 (1,886 in 5+ unit buildings).
Forward outlook
- In year one you build about $106k of equity ($45k loan paydown + $61k appreciation (0.9% local appreciation)).
- Santa Clara County population projected at +24% by 2050 — long-run rental-demand tailwind backs the buy-and-hold thesis.
- By year 4, paydown + projected appreciation supports a ~$388k cash-out refi (75% LTV) — recoverable capital for the next deal without selling this one.
Negotiation context
- It's been on market 25 days — a 2% lower offer ($6.40M) is reasonable based on typical stale-listing flexibility.
- 5 sale attempts with the ask held roughly flat each time — persistent listings suggest the price (not the market) is what's stuck; bring a comps-based counter.
Risks & watch-outs
- Watch-outs: flood insurance adds $152/mo.
- Climate carrying-cost: in FEMA flood zone AH (mandatory federal flood insurance) — expect insurance premiums to compound above CPI over the hold.
Questions for the listing agent
- What do current leases actually rent for vs. the listed asking? Can we see a recent rent roll and the last 12 months of T-12 income?
- What's the actual annual flood-insurance premium (NFIP or private), and is the property in a SFHA with mandatory coverage?
- Is there a deadline driving the sale (1031 exchange, divorce, estate, relocation)? That informs how much negotiation room exists.
- Schools are A-rated — typically a magnet for longer-tenancy family renters. What's the average tenant stay here, and is there a school-zone premium baked into asking?
- The area grade is low — what's the realistic commute time and amenity access for the typical tenant pool here? Any planned neighborhood developments (good or bad) we should know about?
- What's the average days-on-market for RENTAL listings here right now (not sales)? A rising rental-DOM trend means longer vacancies and softer asking-rent achievability than the comps imply.
- What's the recent tenant-quality profile in this submarket — average credit score on applications, eviction rate, late-payment / NSF rate, and stable-employment percentage? A property-management company in the area should have these aggregated.
- How much new for-sale + rental construction is in the pipeline within 1–3 miles? Heavy new supply typically softens prices + rents 12–24 months out; constrained supply supports both.
Investment metrics
- 1% rule
- 0.09% ✗
- Cap rate
- -0.75%
- Cash-on-cash
- -25.14%
- DSCR
- -0.12
- GRM
- 90.7
CMA / ARV
- ARV (median comp)
- $8,793,256
- List price
- $6,495,000
- Delta
- 30.78%
- Verdict
- OVERPRICED
- Comps
- 3 within 1.0 mi
Projected returns pro-forma
0.94% appreciation · 7.38% rent growth · sell at horizon
- IRR
- -25.5%
- Equity multiple
- -0.27×
- Total profit
- $-2,306,843
- Equity at exit
- $2,197,647
- IRR
- -17.1%
- Equity multiple
- -1.11×
- Total profit
- $-3,829,901
- Equity at exit
- $2,905,355
Cash invested: $1,818,600 (down + closing). Projections, not guarantees.
Landlord ↔ Tenant lean methodology
- Overall (STATE)
- 18 Strongly Tenant-Friendly
- State California
- 18 Strongly Tenant-Friendly · D+13
- County
- — inherits STATE
- City
- — inherits STATE
ZIP-level market 94301
- Home prices YoY
- 0.3%
- Rents YoY
- 7.4%
- Active inventory
- 33
- Price-to-rent
- 90.7×
Monthly cashflow live
- Estimated rent
- $5,964 medium interval (Pro) →
- Mortgage (P&I)
- −$34,060
- Tax from tax record
- −$6,043 /mo · $72,521/yr
- Insurance
- −$2,706
- Flood insurance flood zone
- −$152 /mo · $1,824/yr
- HOA
- −$0
- Vacancy / Maint / Mgmt
- −$1,252
- Net cashflow
- $-38,250
Break-even live
Sensitivity live
| Price | -10% $-34,574 | -5% $-36,412 | +0% $-38,250 | +5% $-40,089 | +10% $-41,927 |
|---|---|---|---|---|---|
| Rent | -10% $-38,722 | -5% $-38,486 | +0% $-38,250 | +5% $-38,015 | +10% $-37,779 |
| Rate | -1.0pp $-34,980 | -0.5pp $-36,599 | base $-38,250 | +0.5pp $-39,933 | +1.0pp $-41,646 |
UW: 25.0% down · 7.5% · 30yr · 1.5% tax · 5.0% vac · 8.0% maint · 8.0% mgmt
Financing live
Cash to close
- Down payment
- $1,623,750
- Closing costs
- $194,850
- Reserves months
- —
- Total cash needed
- —
Loan-product check · same deal, 3 products live
Conventional
25% down · 7.5% · 30yr
- Down + closing
- —
- Monthly P&I
- —
- Monthly cashflow
- —
- DSCR
- —
- Eligible?
- —
Personal DTI + credit; lowest rate.
DSCR
20% down · 8.5% · 30yr
- Down + closing
- —
- Monthly P&I
- —
- Monthly cashflow
- —
- DSCR
- —
- Eligible?
- —
No personal income docs; deal must DSCR.
Hard money
10% down · 12.0% · 12mo
- Down + closing
- —
- Monthly P&I
- —
- Monthly cashflow
- —
- DSCR
- —
- Eligible?
- —
Short-term bridge; refi at stabilization.
Listing history 22 events
-
2026-06-21days on market $6,495,000 Active 25 DOM
-
2026-06-18days on market $6,495,000 Active 22 DOM
-
2026-06-17days on market $6,495,000 Active 21 DOM
-
2026-06-16days on market $6,495,000 Active 20 DOM
-
2026-06-15days on market $6,495,000 Active 19 DOM
-
2026-06-13days on market $6,495,000 Active 17 DOM
-
2026-06-13days on market $6,495,000 Active 16 DOM
-
2026-06-09days on market $6,495,000 Active 13 DOM
-
2026-06-08days on market $6,495,000 Active 12 DOM
-
2026-06-07days on market $6,495,000 Active 11 DOM
-
2026-06-03days on market $6,495,000 Active 7 DOM
-
2026-06-02days on market $6,495,000 Active 6 DOM
-
2026-06-01days on market $6,495,000 Active 5 DOM
-
2026-05-31days on market $6,495,000 Active 4 DOM
-
2026-03-19$12,800,000 Active 1360-char remark
-
2026-03-19$12,800,000 Active 1360-char remark
-
2025-06-28historical
-
2025-06-28historical
-
2025-06-18status Pending
-
2025-06-18status Pending
-
2025-03-18Active
-
2025-03-18Active
ⓘ Source: listings_history table (triggers on properties + properties_extension) + one-shot
backfill from property_details.listing_events for pre-trigger history.
Tax reassessment forecast CA · Resets to sale price
- Current annual tax
- $72,521 · $6,043/mo
- Projected year-2 tax
- $72,521 · $6,043/mo
- Expected delta
- $0/yr ($0/mo · 0.0%)
ⓘ Screening estimate from a state-policy table — verify with the county assessor before closing.
Climate risk First Street
- Flood 1/10 Low FEMA zone AH · 0% chance over 30 yrs
- Wildfire 1/10 Low
- Heat 3/10 Moderate 7 d/yr ≥90°F today · 14 d/yr by 30 yrs out
- Wind 1/10 Low
- Air quality 7/10 Severe 12 unhealthy d/yr today · 12 by 30 yrs out
Nearby sold comps map
Loading sold comps map…
Walkable amenities ~0.75 mi
Loading nearby amenities…
Taxation est. · year 1
- Rental income
- $71,571
- − Mortgage interest
- −$363,821
- − Property taxes
- −$72,521
- − Insurance
- −$34,300
- − Repairs & maintenance
- −$5,726
- − Management
- −$5,726
- − Depreciation
- −$188,945
- Taxable loss
- −$599,468
- Est. tax savings @ 24.0%
- +$143,872
- After-tax cash flow
- $-315,133/yr
For passive investors: Depreciation is non-cash, so a rental often shows a tax loss while cash-flowing — sheltering income. Rental losses are passive: they offset passive income freely, and up to $25,000/yr can offset ordinary (W-2) income if you actively participate and your MAGI is under $100k (phasing out to $0 by $150k); unused losses carry forward. On sale, claimed depreciation is recaptured at up to 25%, and gains may owe capital-gains tax (a 1031 exchange can defer both). Figures are a year-1 estimate at your 24.0% rate — not tax advice; consult a CPA.
Schools (NCES district)
- District
- Palo Alto Unified
- NCES district ID
- 0629610
- Math proficiency
- 79% ▼ -2.00%
- Reading proficiency
- 80% ▼ -1.00%
- Median HH income
- $124,038
- Composite
- 74.33/100
- National rank
- #161
- State rank
- #19 of 517 in CA
Livability — Palo Alto
- Score
- 84/100
- State rank
- #19
- US rank
- #821
Category grades
Schools grade is shown separately in the Schools card above.
Census & demographics
- Census place
- Palo Alto, CA
- County
- Santa Clara County · 1,806,974 people
- City population
- 44,691
- Metro
- San Jose-Sunnyvale-Santa Clara, CA
- Population (ZIP)
- 17,508
- Household income
- $242,006
- Rent vs Own
- Severe rent burden
- 609.0
Population outlook (Santa Clara County) Hauer SSP2
- Today (2025)
- 2,179,074 people
- By 2030
- 2,301,297 · +5.6%
- By 2040
- 2,528,195 · +16.0%
- By 2050
- 2,712,135 · +24.5%
- By 2075
- 2,998,701 · +37.6%
- By 2100
- 2,931,429 · +34.5%
Race, ethnicity, and origin ACS 2023
- Neighborhood character
- Diverse neighborhood (Simpson 0.60)
- Race & ethnicity
- White 58% Asian 26% Two or more races 11% Hispanic / Latino 6% Black 2%
- Hispanic origin (detail)
- Mexican 1%
- Common ancestry
- Romanian 3% Scotch-Irish 3% Lithuanian 3%
- Foreign-born
- 32% · China, Canada, South Korea
- Languages at home
- 70% English-only · Chinese 8% Other Indo-European 6% Spanish 5%
Political lean MEDSL · Santa Clara
- 2024 margin
- Solid D (+40.0) · D 68.1% · R 28.1% · Other 3.8%
- 2008→2024 swing
- -0.9pp no change · 2008: 40.9pp · 2024: 40.0pp
- All cycles
- 2024: D+40.0 2020: D+47.4 2016: D+52.5 2012: D+42.1 2008: D+40.9
Not yet ingested
- Civics
- —
Market trends
- HPI YoY
- ▲ 0.94%
- Current HPI
- 339.4966
- Rent YoY
- ▲ 7.38%
- Metro
- San Jose-Sunnyvale-Santa Clara, CA
- State GDP YoY
- ▲ 3.21%
- F500 in state
- 116
Industry mix (Fortune 500 HQ in CA)
| Industry | F500 HQs | Revenue |
|---|---|---|
| Technology | 27 | $1,492B |
|
||
| Financial Services | 3 | $174B |
|
||
| Retail | 3 | $44B |
|
||
| Insurance | 3 | $26B |
|
||
| Media / Entertainment | 2 | $115B |
|
||
| Pharmaceuticals / Biotech | 2 | $62B |
|
||
Price history
+0.0% since first listed11 events — show timeline
- 2026-05-27 Listed $6,495,000 MLSListings
- 2026-05-27 Listing Removed — bridgeMLS, Bay East AOR, or Contra Costa AOR
- 2026-05-27 Listed $6,495,000 bridgeMLS, Bay East AOR, or Contra Costa AOR
- 2026-05-22 Price Changed — bridgeMLS, Bay East AOR, or Contra Costa AOR
- 2026-03-19 Listed — bridgeMLS, Bay East AOR, or Contra Costa AOR
- 2025-06-28 Listing Removed — bridgeMLS, Bay East AOR, or Contra Costa AOR
- 2025-06-28 Listing Removed — bridgeMLS, Bay East AOR, or Contra Costa AOR
- 2025-06-18 Pending — bridgeMLS, Bay East AOR, or Contra Costa AOR
- 2025-06-18 Pending — bridgeMLS, Bay East AOR, or Contra Costa AOR
- 2025-03-18 Listed — bridgeMLS, Bay East AOR, or Contra Costa AOR
- 2025-03-18 Listed — bridgeMLS, Bay East AOR, or Contra Costa AOR
Property tax history
+103.2%/yrLatest (2025): $72,521 · +4.3% YoY. Source: county tax records.
Cash-flow waterfall
monthlySold comps — $/sqft
last 12 mo · ≤1 miLoading sold comps…