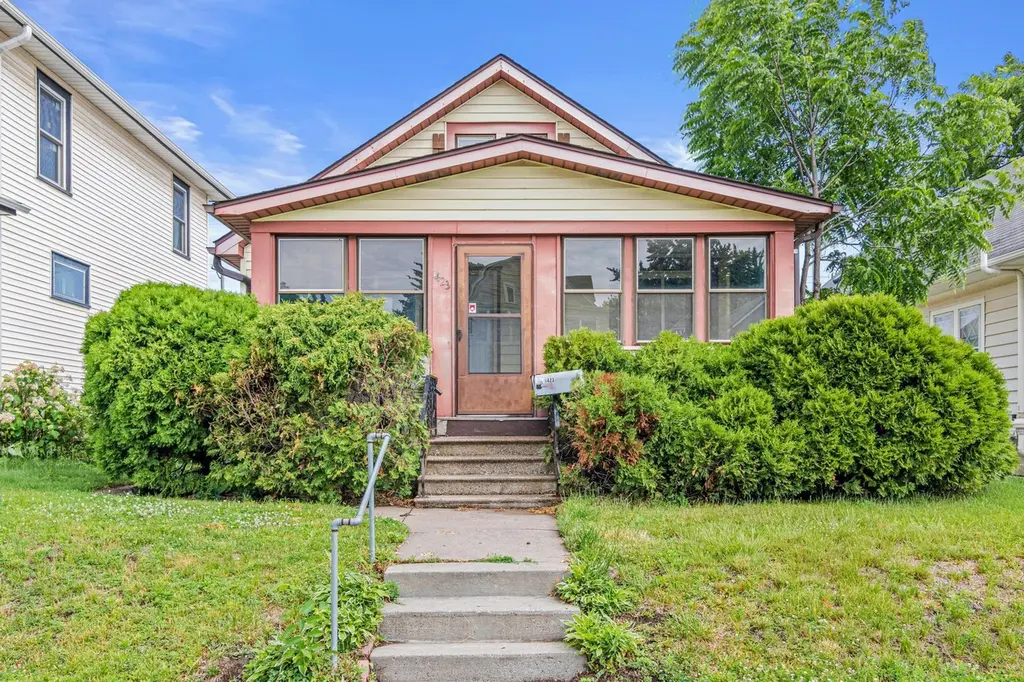
1423 Thomas Ave W · St. Paul, MN
Flood risk 1/10 · Minimal
- FEMA flood zone
- X (unshaded)
- Chance of flooding over 30 yrs
- 0.0%
- Est. flood insurance / yr
- $473 – $860
Fire risk 1/10 · Minimal
- Est. fire insurance / yr
- $888 – $1,650
Heat risk 2/10 · Minimal
- Hot days now (above 99°F)
- 7 days/yr
- Hot days in 30 yrs
- 14 days/yr
Wind risk 2/10 · Minimal
- Chance of severe wind over 30 yrs
- —
Air-quality risk 2/10 · Minimal
- Unhealthy air days now
- 1 days/yr
- Unhealthy air days in 30 yrs
- 1 days/yr
Risk factors via First Street. Map © Google.
Why this score? — see what drove the C- grade
The composite is a weighted blend of 9 inputs, each scored 0–100. Each bar is that input's sub-score; the figure is the points it added to the 100-point composite (weight × sub-score).
- Cash flow +21.9/30.0
- ARV discount +7.5/15.0
- DSCR +7.0/10.0
- 1% rule +6.1/10.0
- Rent growth +3.1/5.0
- Livability +2.5/5.0
- Condition / age +2.5/5.0
- Schools +2.4/10.0
- Appreciation +0.0/10.0
$253,000
🖨 Deal sheet (PDF) 📄 Offer letter ✓ Due diligence
Listing remarks
Charming Hamline-Midway bungalow with timeless character and great curb appeal! This well-maintained home features a spacious enclosed front porch, generous living spaces, and abundant natural light throughout. Conveniently located near Hamline University, Allianz Field, light rail, shopping, restaurants, and easy freeway access. Enjoy the perfect blend of classic St. Paul charm and everyday convenience in one of the city's most walkable neighborhoods. A fantastic opportunity for homeowners and investors alike!
Key facts
- Natural light
- Easy freeway access
- Enclosed front porch
Tags
Property features AI
Exterior
- Parking: 1-car garage
- Utilities: City water (connected); City sewer (connected); Natural gas
- Home design: Residential property; Main level living area with additional finished space; Facing direction not provided; Entry level not provided
- Construction: Poured concrete foundation; Built components total living area reported
- Exterior features: Vinyl exterior; Lot approximately 0.113 acres (about 40 x 120)
Interior
- Bedrooms: 3 bedrooms
- Bathrooms: 1 full bathroom; 1 half bathroom
- Heating & cooling: Forced air heating; Central air conditioning
- Interior features: Finished basement; One and one-half levels
Neighborhood map
What this means for you Summary
Snapshot
- This is a 3-bed/1.0-bath single-family listed at $253k.
Deal economics
- At list price, monthly cash flow is $400 ($5k/yr) — positive.
- The deal already cash-flows at list — no discount required.
- Meets the 1% rule at list price ($3k rent vs $253k).
Location & tenants
- Location reads: area grade C — affects rentability + tenant quality, not the cash-flow math above.
- St. Paul Public School District (urban): math 21% / reading 33% proficiency, ranked #270 of 301 in MN (top 90%) — low school quality limits family demand, transient renter base, plan for 1-2y turnover; 64% free/reduced lunch — lower-income household profile, screen leases tightly.
- Market conditions: Rents rising (+2.5%/yr); 191 active listings in the ZIP; 2 comparable units currently listed for rent nearby; solid renter incomes; 1,202 units permitted in Ramsey County in 2024 (880 in 5+ unit buildings).
- This rent runs 44% of the median local income ($76k/yr) — at the standard rent-burdened threshold; future hikes will face affordability resistance.
Forward outlook
- Local home prices are declining (-3.0%/yr); year-one equity from $2k of loan paydown is wiped out by about $8k of value loss. Plan a longer hold.
- Ramsey County population projected at +27% by 2050 — long-run rental-demand tailwind backs the buy-and-hold thesis.
Negotiation context
- Only 5 days on market — expect competitive offers; lowballing is unlikely to land.
- 7 sale attempts since 33y ago with the ask held roughly flat each time — persistent listings suggest the price (not the market) is what's stuck; bring a comps-based counter.
Risks & watch-outs
- Watch-outs: built in 1915 — expect roof / HVAC / electrical / plumbing capex.
Questions for the listing agent
- Built in 1915 — when were the roof, HVAC, electrical panel, plumbing, and water heater last replaced?
- Is there a deadline driving the sale (1031 exchange, divorce, estate, relocation)? That informs how much negotiation room exists.
- What's the average days-on-market for RENTAL listings here right now (not sales)? A rising rental-DOM trend means longer vacancies and softer asking-rent achievability than the comps imply.
- What's the recent tenant-quality profile in this submarket — average credit score on applications, eviction rate, late-payment / NSF rate, and stable-employment percentage? A property-management company in the area should have these aggregated.
- How much new for-sale + rental construction is in the pipeline within 1–3 miles? Heavy new supply typically softens prices + rents 12–24 months out; constrained supply supports both.
Investment metrics
- 1% rule
- 1.11% ✓
- Cap rate
- 8.19%
- Cash-on-cash
- 6.77%
- DSCR
- 1.30
- GRM
- 7.5
CMA / ARV
No comps found within radius.
Projected returns pro-forma
-3.0% appreciation · 2.5% rent growth · sell at horizon
- IRR
- -6.5%
- Equity multiple
- 0.76×
- Total profit
- $-16,871
- Equity at exit
- $37,723
- IRR
- 2.6%
- Equity multiple
- 1.18×
- Total profit
- $12,712
- Equity at exit
- $21,875
Cash invested: $70,840 (down + closing). Projections, not guarantees.
Landlord ↔ Tenant lean methodology
- Overall (STATE)
- 46 Balanced
- State Minnesota
- 46 Balanced · D+2
- County
- — inherits STATE
- City
- — inherits STATE
ZIP-level market 55104
- Rents YoY
- 2.5%
- Active inventory
- 191
- Price-to-rent
- 7.5×
Monthly cashflow live
- Estimated rent
- $2,805 medium interval (Pro) →
- Mortgage (P&I)
- −$1,327
- Tax from tax record
- −$384 /mo · $4,612/yr
- Insurance
- −$105
- HOA
- −$0
- Vacancy / Maint / Mgmt
- −$589
- Net cashflow
- $400
Break-even live
Sensitivity live
| Price | -10% $543 | -5% $471 | +0% $400 | +5% $328 | +10% $256 |
|---|---|---|---|---|---|
| Rent | -10% $178 | -5% $289 | +0% $400 | +5% $510 | +10% $621 |
| Rate | -1.0pp $527 | -0.5pp $464 | base $400 | +0.5pp $334 | +1.0pp $267 |
UW: 25.0% down · 7.5% · 30yr · 1.5% tax · 5.0% vac · 8.0% maint · 8.0% mgmt
Financing live
Cash to close
- Down payment
- $63,250
- Closing costs
- $7,590
- Reserves months
- —
- Total cash needed
- —
Loan-product check · same deal, 3 products live
Conventional
25% down · 7.5% · 30yr
- Down + closing
- —
- Monthly P&I
- —
- Monthly cashflow
- —
- DSCR
- —
- Eligible?
- —
Personal DTI + credit; lowest rate.
DSCR
20% down · 8.5% · 30yr
- Down + closing
- —
- Monthly P&I
- —
- Monthly cashflow
- —
- DSCR
- —
- Eligible?
- —
No personal income docs; deal must DSCR.
Hard money
10% down · 12.0% · 12mo
- Down + closing
- —
- Monthly P&I
- —
- Monthly cashflow
- —
- DSCR
- —
- Eligible?
- —
Short-term bridge; refi at stabilization.
Rent comps 2 comps
| Address | Beds | Baths | Sqft | Rent | $/sqft | DOM | Units | Dist |
|---|---|---|---|---|---|---|---|---|
| 1555 Selby Ave Saint Paul, MN | 3.0 | 1.0–2.0 | 1129 | $4,394 | $3.89 | 0d | 6 | 0.94mi |
| 150 Snelling Ave N St Paul, MN | 2.0 | 1.0–2.0 | 741 | $2,598 | $3.51 | 2d | 8 | 1.03mi |
Listing history 6 events
-
2026-06-18days on market $253,000 Active 5 DOM
-
2026-06-17days on market $253,000 Active 4 DOM
-
2026-06-16days on market $253,000 Active 3 DOM
-
2026-06-15days on market $253,000 Active 2 DOM
-
2026-06-13remarks 516-char remark
-
2026-06-13$253,000 Active 1 DOM
ⓘ Source: listings_history table (triggers on properties + properties_extension) + one-shot
backfill from property_details.listing_events for pre-trigger history.
Tax reassessment forecast MN · Partial reset (capped growth)
- Current annual tax
- $4,612 · $384/mo
- Projected year-2 tax
- $4,612 · $384/mo
- Expected delta
- $0/yr ($0/mo · 0.0%)
ⓘ Screening estimate from a state-policy table — verify with the county assessor before closing.
Climate risk First Street
- Flood 1/10 Low FEMA zone X (unshaded) · 0% chance over 30 yrs
- Wildfire 1/10 Low
- Heat 2/10 Low 7 d/yr ≥99°F today · 14 d/yr by 30 yrs out
- Wind 2/10 Low
- Air quality 2/10 Low 1 unhealthy d/yr today · 1 by 30 yrs out
Nearby sold comps map
Loading sold comps map…
Walkable amenities ~0.75 mi
Loading nearby amenities…
Taxation est. · year 1
- Rental income
- $33,661
- − Mortgage interest
- −$14,172
- − Property taxes
- −$4,612
- − Insurance
- −$1,265
- − Repairs & maintenance
- −$2,693
- − Management
- −$2,693
- − Depreciation
- −$7,360
- Taxable income
- $866
- Est. tax owed @ 24.0%
- −$208
- After-tax cash flow
- $4,586/yr
For passive investors: Depreciation is non-cash, so a rental often shows a tax loss while cash-flowing — sheltering income. Rental losses are passive: they offset passive income freely, and up to $25,000/yr can offset ordinary (W-2) income if you actively participate and your MAGI is under $100k (phasing out to $0 by $150k); unused losses carry forward. On sale, claimed depreciation is recaptured at up to 25%, and gains may owe capital-gains tax (a 1031 exchange can defer both). Figures are a year-1 estimate at your 24.0% rate — not tax advice; consult a CPA.
Schools (NCES district)
- District
- St. Paul Public School District
- NCES district ID
- 2733840
- Math proficiency
- 21% ▼ -11.00%
- Reading proficiency
- 33% ▼ -7.00%
- Median HH income
- $48,316
- Composite
- 23.51/100
- National rank
- #7868
- State rank
- #270 of 301 in MN
Livability — St. Paul
No livability data for this city. (Only ~50 U.S. cities are tracked.)
Census & demographics
- Census place
- St. Paul, MN
- County
- Ramsey County · 542,837 people
- City population
- 280,599
- Metro
- Minneapolis-St. Paul-Bloomington, MN-WI
- Population (ZIP)
- 45,762
- Household income
- $75,712
- Rent vs Own
- Severe rent burden
- 2116.0
Population outlook (Ramsey County) Hauer SSP2
- Today (2025)
- 603,431 people
- By 2030
- 636,459 · +5.5%
- By 2040
- 700,596 · +16.1%
- By 2050
- 765,819 · +26.9%
- By 2075
- 929,297 · +54.0%
- By 2100
- 1,053,924 · +74.7%
Race, ethnicity, and origin ACS 2023
- Neighborhood character
- Diverse neighborhood (Simpson 0.60)
- Race & ethnicity
- White 60% Black 19% Two or more races 10% Asian 7% Hispanic / Latino 7%
- Hispanic origin (detail)
- Mexican 4%
- Common ancestry
- Portuguese 8% Romanian 3% Lithuanian 3%
- Foreign-born
- 12% · Canada, Vietnam, China
- Languages at home
- 83% English-only · Spanish 4% Other Asian/Pacific 4% French/Haitian/Cajun 1%
Political lean MEDSL · Ramsey
- 2024 margin
- Solid D (+43.3) · D 70.5% · R 27.2% · Other 2.3%
- 2008→2024 swing
- +9.4pp toward D · 2008: 33.9pp · 2024: 43.3pp
- All cycles
- 2024: D+43.3 2020: D+45.4 2016: D+39.4 2012: D+35.3 2008: D+33.9
Not yet ingested
- Civics
- —
Market trends
- HPI YoY
- ▼ -532.26%
- Current HPI
- 245.6146
- Rent YoY
- ▲ 2.50%
- Metro
- Minneapolis-St. Paul-Bloomington, MN-WI
- State GDP YoY
- ▲ 2.41%
- F500 in state
- 34
Industry mix (Fortune 500 HQ in MN)
| Industry | F500 HQs | Revenue |
|---|---|---|
| Healthcare | 2 | $407B |
|
||
| Retail | 2 | $150B |
|
||
| Consumer Goods | 2 | $32B |
|
||
| Industrial Machinery | 2 | $6B |
|
||
| Agriculture | 1 | $40B |
|
||
| Healthcare / Medical Devices | 1 | $32B |
|
||
Price history
+278.2% since first listed21 events — show timeline
- 2026-06-13 Listed $253,000 NORTHSTARMLS as Distributed by MLS Grid
- 2023-10-23 Listing Removed — NORTHSTARMLS as Distributed by MLS Grid
- 2023-09-15 Price Changed $244,900 NORTHSTARMLS as Distributed by MLS Grid
- 2023-08-30 Price Changed $249,900 NORTHSTARMLS as Distributed by MLS Grid
- 2023-08-10 Relisted — NORTHSTARMLS as Distributed by MLS Grid
- 2023-08-08 Contingent — NORTHSTARMLS as Distributed by MLS Grid
- 2023-08-02 Listed $254,900 NORTHSTARMLS as Distributed by MLS Grid
- 2021-12-17 Contingent — NORTHSTARMLS as Distributed by MLS Grid
- 2021-12-14 Price Changed $250,000 NORTHSTARMLS as Distributed by MLS Grid
- 2021-11-11 Price Changed $270,000 NORTHSTARMLS as Distributed by MLS Grid
- 2021-11-03 Listed $280,000 NORTHSTARMLS as Distributed by MLS Grid
- 2021-10-28 Coming Soon — NORTHSTARMLS as Distributed by MLS Grid
- 2019-04-30 Sold (MLS) $235,000 NORTHSTARMLS as Distributed by MLS Grid
- 2019-04-02 Pending — NORTHSTARMLS as Distributed by MLS Grid
- 2019-03-13 Contingent — NORTHSTARMLS as Distributed by MLS Grid
- 2019-03-02 Price Changed $235,000 NORTHSTARMLS as Distributed by MLS Grid
- 2019-02-21 Listed $250,000 NORTHSTARMLS as Distributed by MLS Grid
- 1993-09-07 Listing Removed — NORTHSTARMLS as Distributed by MLS Grid
- 1993-07-07 Listed $64,800 NORTHSTARMLS as Distributed by MLS Grid
- 1993-07-06 Listing Removed — NORTHSTARMLS as Distributed by MLS Grid
- 1993-04-10 Listed $66,900 NORTHSTARMLS as Distributed by MLS Grid
Property tax history
+45.2%/yrLatest (2025): $4,612 · +11.2% YoY. Source: county tax records.
Cash-flow waterfall
monthlySold comps — $/sqft
last 12 mo · ≤1 miLoading sold comps…