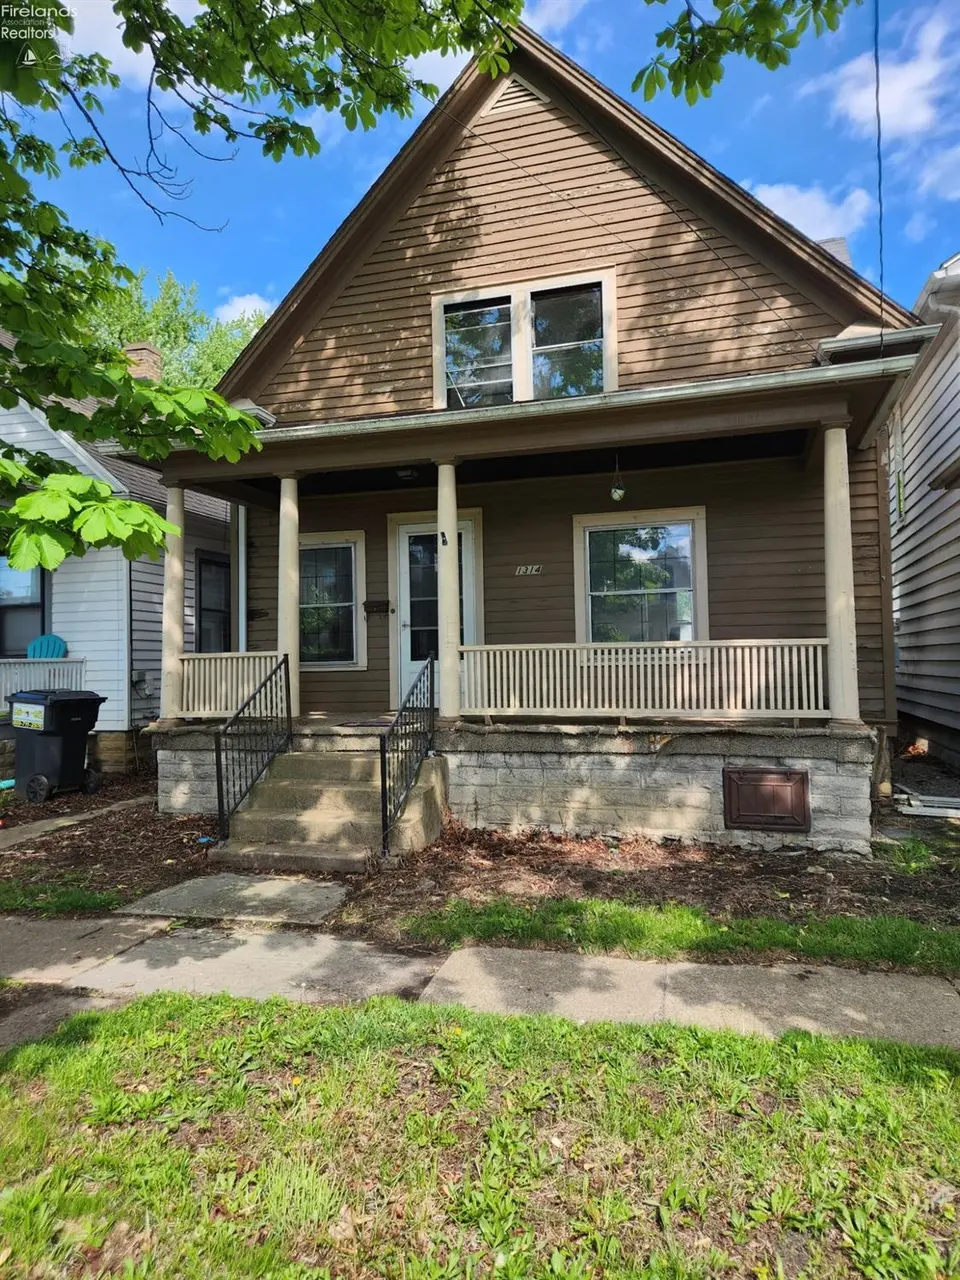
1314 Carr St · Sandusky, OH
Flood risk 1/10 · Minimal
- FEMA flood zone
- X (unshaded)
- Chance of flooding over 30 yrs
- 0.0%
- Est. flood insurance / yr
- $473 – $860
Fire risk 1/10 · Minimal
- Est. fire insurance / yr
- $713 – $1,323
Heat risk 3/10 · Minor
- Hot days now (above 94°F)
- 7 days/yr
- Hot days in 30 yrs
- 16 days/yr
Wind risk 2/10 · Minimal
- Chance of severe wind over 30 yrs
- —
Air-quality risk 2/10 · Minimal
- Unhealthy air days now
- 1 days/yr
- Unhealthy air days in 30 yrs
- 2 days/yr
Risk factors via First Street. Map © Google.
Why this score? — see what drove the C+ grade
The composite is a weighted blend of 9 inputs, each scored 0–100. Each bar is that input's sub-score; the figure is the points it added to the 100-point composite (weight × sub-score).
- Cash flow +30.0/30.0
- 1% rule +10.0/10.0
- DSCR +10.0/10.0
- Livability +4.2/5.0
- Rent growth +2.5/5.0
- Schools +2.5/10.0
- Condition / age +2.5/5.0
- ARV discount +0.0/15.0
- Appreciation +0.0/10.0
$139,900
🖨 Deal sheet 📄 Offer letter ✓ Due diligence
Listing remarks MLS
Cozy bungalow style home on a quiet street. Why pay rent, when you can own? 3 BR, 1 BA, newer roof (10 Yrs) Parking pad in back accessed by alley on Polk St. (between Carr and Shelby) Selling As Is with a Home Warranty!! $78/Gas $65/Electric on Budget
Key facts
- Upstairs balcony
- Fenced-in backyard
- Quiet neighborhood
Tags
Property features AI
Exterior
- Parking: Off-street parking
- Utilities: Public water; Public sewer; 100 Amp electrical service with circuit breakers
- Home design: Single-family residence; Residential property
- Construction: Wood siding construction
- Exterior features: Asphalt roof; Lot in Ramsey Bertram And Reilys Subdivision
Interior
- Kitchen: Range; Refrigerator
- Bathrooms: 1 full bathroom
- Heating & cooling: Natural gas forced air heating; Central air conditioning
- Interior features: Range, Refrigerator; Ceiling fan(s); 6 total rooms
- Laundry & utility: Laundry in basement
Neighborhood map
What this means for you Summary
Snapshot
- This is a 3-bed/1.0-bath single-family listed at $140k.
Deal economics
- At list price, monthly cash flow is $1k ($15k/yr) — positive.
- The deal already cash-flows at list — no discount required.
- Meets the 1% rule at list price ($3k rent vs $140k).
- Recommended offer: $136k (3.0% below list) — sets the bar for market timing.
- Cap rate 16.9% vs local median 5.4% in Sandusky — top-decile yield for the area; either an underpriced asset or a hidden risk that comps aren't pricing in. Stress-test before assuming the spread holds.
Location & tenants
- Location reads 83/100 on livability (#63 in OH, #929 nationally) — a professional / high-income tenant draw. Strengths: commute A+, cost of living A+, housing A+; Watch: crime D-, employment F.
- Sandusky City (town): math 24% / reading 37% proficiency, ranked #583 of 656 in OH (top 89%) — families likely to look elsewhere, expect single-tenant / working-renter base with shorter leases; 71% free/reduced lunch — lower-income household profile, screen leases tightly.
- Market conditions: 209 active listings in the ZIP; 3 comparable units currently listed for rent nearby; rentals lingering (median 44d on market — plan ~5-8 weeks vacancy on turnover, expect pricing pressure); 100% of comp listings sitting > 30 days — soft ceiling on asking rent; 128 units permitted in Erie County in 2024 (5 in 5+ unit buildings).
- At $2,647/mo this rent would consume 51% of the median local household income ($62k/yr) (locally 1602% of renters already pay >50% of income on rent) — very limited rent-growth headroom before tenants either downsize or default.
Forward outlook
- Local home prices are declining (-3.0%/yr); year-one equity from $967 of loan paydown is wiped out by about $4k of value loss. Plan a longer hold.
- Erie County population projected at -15% by 2050 — secular population decline; favor cash flow + early exit over multi-decade hold.
- At projected returns (-3.0% appreciation + 3.0% rent growth), your $39k cash investment doubles in ~4 years — after that, you're playing with house money.
Negotiation context
- It's been on market 48 days — a 3% lower offer ($136k) is reasonable based on typical stale-listing flexibility.
- 2 sale attempts since 13y ago with the ask held roughly flat each time — persistent listings suggest the price (not the market) is what's stuck; bring a comps-based counter.
- Current owner paid $40k; list at $140k implies a 250% gain — meaningful room to come down on a strong offer.
Risks & watch-outs
- Watch-outs: built in 1914 — expect roof / HVAC / electrical / plumbing capex.
Questions for the listing agent
- It's been on market 48 days. Have you received any prior offers? Is the seller open to a 3% concession, seller financing, or rate buy-down credit?
- Built in 1914 — when were the roof, HVAC, electrical panel, plumbing, and water heater last replaced?
- Is there a deadline driving the sale (1031 exchange, divorce, estate, relocation)? That informs how much negotiation room exists.
- Crime grade is D in this area — have there been break-ins, vandalism, or insurance claims at this property in the last 3 years? What carrier currently insures it and at what premium?
- What's the average days-on-market for RENTAL listings here right now (not sales)? A rising rental-DOM trend means longer vacancies and softer asking-rent achievability than the comps imply.
- What's the recent tenant-quality profile in this submarket — average credit score on applications, eviction rate, late-payment / NSF rate, and stable-employment percentage? A property-management company in the area should have these aggregated.
- How much new for-sale + rental construction is in the pipeline within 1–3 miles? Heavy new supply typically softens prices + rents 12–24 months out; constrained supply supports both.
Investment metrics
- 1% rule
- 1.89% ✓
- Cap rate
- 16.92%
- Cash-on-cash
- 37.95%
- DSCR
- 2.69
- GRM
- 4.4
CMA / ARV
- ARV (median comp)
- $96,003
- List price
- $139,900
- Delta
- 45.72%
- Verdict
- OVERPRICED
- Comps
- 20 within 1.0 mi
Show comp detail 12 sales within ~0.75 mi
| Address | Dist | Beds/Ba | Sqft | Sold | Price | $/sf | Match |
|---|---|---|---|---|---|---|---|
| 1214 W Osborne St | 0.14mi | 3/1.0 | 966 (-4%) | 0mo | $139,000 | $144 | 86 |
| 911 A St | 0.14mi | 3/1.0 | 1,047 (+4%) | 2mo | $115,000 | $110 | 86 |
| 542 Camp St | 0.26mi | 3/1.0 | 932 (-8%) | 1mo | $109,000 | $117 | 74 |
| 1313 Vine St | 0.16mi | 3/1.0 | 1,116 (+11%) | 1mo | $171,500 | $154 | 74 |
| 1535 Camp St | 0.20mi | 2/1.0 (-1) | 924 (-8%) | 1mo | $71,000 | $77 | 71 |
| 932 Madison St | 0.32mi | 3/1.0 | 1,098 (+9%) | 2mo | $162,000 | $148 | 68 |
| 1510 Pearl St | 0.19mi | 2/1.0 (-1) | 1,103 (+9%) | 3mo | $47,000 | $43 | 68 |
| 1316 Harrison St | 0.29mi | 2/1.0 (-1) | 921 (-9%) | 1mo | $50,000 | $54 | 66 |
| 2103 Putnam Street St | 0.75mi | 3/1.0 | 990 (-2%) | 1mo | $127,900 | $129 | 62 |
| 1523 Central Ave | 0.29mi | 3/1.0 | 1,152 (+14%) | 3mo | $206,000 | $179 | 60 |
| 2023 W Forest Dr | 0.64mi | 3/1.0 | 925 (-8%) | 3mo | $107,000 | $116 | 54 |
| 306 Tyler St | 0.59mi | 3/1.0 | 1,136 (+13%) | 3mo | $130,000 | $114 | 49 |
Match score weights: distance 35% · size 25% · config 20% · recency 20%. Top-matched comps best support the ARV.
Projected returns pro-forma
-3.0% appreciation · 3.0% rent growth · sell at horizon
- IRR
- 34.0%
- Equity multiple
- 2.43×
- Total profit
- $56,193
- Equity at exit
- $20,860
- IRR
- 40.9%
- Equity multiple
- 4.84×
- Total profit
- $150,396
- Equity at exit
- $12,096
Cash invested: $39,172 (down + closing). Projections, not guarantees.
Landlord ↔ Tenant lean methodology
- Overall (STATE)
- 73 Landlord-Friendly
- State Ohio
- 73 Landlord-Friendly · R+6
- County
- — inherits STATE
- City
- — inherits STATE
ZIP-level market 44870
- Active inventory
- 209
- Price-to-rent
- 4.4×
Monthly cashflow live
- Estimated rent
- $2,647 medium interval (Pro) →
- Mortgage (P&I)
- −$734
- Tax from tax record
- −$61 /mo · $730/yr
- Insurance
- −$58
- HOA
- −$0
- Vacancy / Maint / Mgmt
- −$556
- Net cashflow
- $1,239
Break-even live
UW: 25.0% down · 7.5% · 30yr · 1.5% tax · 5.0% vac · 8.0% maint · 8.0% mgmt
Financing live
Cash to close
- Down payment
- $34,975
- Closing costs
- $4,197
- Reserves months
- —
- Total cash needed
- —
Loan-product check · same deal, 3 products live
Conventional
25% down · 7.5% · 30yr
- Down + closing
- —
- Monthly P&I
- —
- Monthly cashflow
- —
- DSCR
- —
- Eligible?
- —
Personal DTI + credit; lowest rate.
DSCR
20% down · 8.5% · 30yr
- Down + closing
- —
- Monthly P&I
- —
- Monthly cashflow
- —
- DSCR
- —
- Eligible?
- —
No personal income docs; deal must DSCR.
Hard money
10% down · 12.0% · 12mo
- Down + closing
- —
- Monthly P&I
- —
- Monthly cashflow
- —
- DSCR
- —
- Eligible?
- —
Short-term bridge; refi at stabilization.
Rent comps 3 comps
| Address | Beds | Baths | Sqft | Rent | $/sqft | DOM | Units | Dist |
|---|---|---|---|---|---|---|---|---|
| 1515 W Perkins Ave Sandusky, OH | 2.0 | 1.0 | 925 | $925 | $1.00 | 44d | 1 | 0.74mi |
| 156 E Market St Sandusky, OH | 1.0–2.0 | 1.0–2.5 | 1266 | $3,539 | $2.79 | 44d | 5 | 0.96mi |
| 1107 1st St Unit 1496057P Sandusky, OH | 4.0 | 3.0 | 1151 | $6,631 | $5.76 | 44d | 1 | 1.46mi |
Listing history 20 events
-
2026-06-19days on market $139,900 Active 48 DOM
-
2026-06-18days on market $139,900 Active 47 DOM
-
2026-06-17days on market $139,900 Active 46 DOM
-
2026-06-16days on market $139,900 Active 45 DOM
-
2026-06-15days on market $139,900 Active 44 DOM
-
2026-06-14days on market $139,900 Active 42 DOM
-
2026-06-12days on market $139,900 Active 41 DOM
-
2026-06-09days on market $139,900 Active 38 DOM
-
2026-06-08days on market $139,900 Active 37 DOM
-
2026-06-07days on market $139,900 Active 36 DOM
-
2026-06-03days on market $139,900 Active 32 DOM
-
2026-06-02days on market $139,900 Active 31 DOM
-
2026-06-01days on market $139,900 Active 30 DOM
-
2026-05-31days on market $139,900 Active 29 DOM
-
2026-05-30days on market $139,900 Active 28 DOM
-
2026-05-15price $139,900 435-char remark
-
2026-05-02$144,900 Active 435-char remark
-
2014-07-11soldstatus $40,000 253-char remark
Show marketing remark (253 chars)
Cozy bungalow style home on a quiet street. Why pay rent, when you can own? 3 BR, 1 BA, newer roof (10 Yrs) Parking pad in back accessed by alley on Polk St. (between Carr and Shelby) Selling As Is with a Home Warranty!! $78/Gas $65/Electric on Budget
-
2014-07-11soldstatus $40,000
Show marketing remark (253 chars)
Cozy bungalow style home on a quiet street. Why pay rent, when you can own? 3 BR, 1 BA, newer roof (10 Yrs) Parking pad in back accessed by alley on Polk St. (between Carr and Shelby) Selling As Is with a Home Warranty!! $78/Gas $65/Electric on Budget
-
2013-11-22$44,900 253-char remark
Show marketing remark (253 chars)
Cozy bungalow style home on a quiet street. Why pay rent, when you can own? 3 BR, 1 BA, newer roof (10 Yrs) Parking pad in back accessed by alley on Polk St. (between Carr and Shelby) Selling As Is with a Home Warranty!! $78/Gas $65/Electric on Budget
ⓘ Source: listings_history table (triggers on properties + properties_extension) + one-shot
backfill from property_details.listing_events for pre-trigger history.
Tax reassessment forecast OH · Partial reset (capped growth)
- Current annual tax
- $730 · $61/mo
- Projected year-2 tax
- $1,456 · $121/mo
- Expected delta
- +$726/yr (+$61/mo · 99.5%)
ⓘ Screening estimate from a state-policy table — verify with the county assessor before closing.
Climate risk First Street
- Flood 1/10 Low FEMA zone X (unshaded) · 0% chance over 30 yrs
- Wildfire 1/10 Low
- Heat 3/10 Moderate 7 d/yr ≥94°F today · 16 d/yr by 30 yrs out
- Wind 2/10 Low
- Air quality 2/10 Low 1 unhealthy d/yr today · 2 by 30 yrs out
Nearby sold comps map
Loading sold comps map…
Walkable amenities ~0.75 mi
Loading nearby amenities…
Taxation est. · year 1
- Rental income
- $31,769
- − Mortgage interest
- −$7,837
- − Property taxes
- −$730
- − Insurance
- −$700
- − Repairs & maintenance
- −$2,542
- − Management
- −$2,542
- − Depreciation
- −$4,070
- Taxable income
- $13,350
- Est. tax owed @ 24.0%
- −$3,204
- After-tax cash flow
- $11,660/yr
For passive investors: Depreciation is non-cash, so a rental often shows a tax loss while cash-flowing — sheltering income. Rental losses are passive: they offset passive income freely, and up to $25,000/yr can offset ordinary (W-2) income if you actively participate and your MAGI is under $100k (phasing out to $0 by $150k); unused losses carry forward. On sale, claimed depreciation is recaptured at up to 25%, and gains may owe capital-gains tax (a 1031 exchange can defer both). Figures are a year-1 estimate at your 24.0% rate — not tax advice; consult a CPA.
Schools (NCES district)
- District
- Sandusky City
- NCES district ID
- 3904474
- Math proficiency
- 24% ▼ -17.00%
- Reading proficiency
- 37% ▼ -9.00%
- Median HH income
- $34,583
- Composite
- 25.1/100
- National rank
- #7532
- State rank
- #583 of 656 in OH
Livability — Sandusky
- Score
- 83/100
- State rank
- #63
- US rank
- #929
Category grades
Schools grade is shown separately in the Schools card above.
Census & demographics
- Census place
- Sandusky, OH
- County
- Erie County · 39,883 people
- City population
- 39,883
- Metro
- Sandusky, OH
- Population (ZIP)
- 39,883
- Household income
- $62,082
- Rent vs Own
- Severe rent burden
- 1602.0
Population outlook (Erie County) Hauer SSP2
- Today (2025)
- 73,204 people
- By 2030
- 71,341 · -2.5%
- By 2040
- 66,771 · -8.8%
- By 2050
- 62,512 · -14.6%
- By 2075
- 56,154 · -23.3%
- By 2100
- 49,045 · -33.0%
Race, ethnicity, and origin ACS 2023
- Neighborhood character
- Predominantly White (72%)
- Race & ethnicity
- White 72% Black 15% Two or more races 8% Hispanic / Latino 5%
- Common ancestry
- Romanian 3% Slovak 2% Subsaharan African 1%
- Foreign-born
- 1% · Canada
- Languages at home
- 96% English-only · Spanish 2%
Political lean MEDSL · Erie
- 2024 margin
- R (+14.1) · D 42.5% · R 56.6%
- 2008→2024 swing
- -28.0pp toward R · 2008: 13.9pp · 2024: -14.1pp
- All cycles
- 2024: R+14.1 2020: R+11.6 2016: R+9.8 2012: D+11.3 2008: D+13.9
Not yet ingested
- Civics
- —
Market trends
- HPI YoY
- ▼ -151.99%
- Current HPI
- 209.6383
- Rent YoY
- —
- Metro
- Sandusky, OH
- State GDP YoY
- ▲ 1.98%
- F500 in state
- 48
Industry mix (Fortune 500 HQ in OH)
| Industry | F500 HQs | Revenue |
|---|---|---|
| Insurance | 3 | $145B |
|
||
| Industrial Machinery | 3 | $49B |
|
||
| Financial Services | 3 | $24B |
|
||
| Consumer Goods | 2 | $93B |
|
||
| Aerospace / Defense | 2 | $47B |
|
||
| Utilities | 2 | $33B |
|
||
Price history
+211.6% since first listed5 events — show timeline
- 2026-05-15 Price Changed $139,900 FAOR
- 2026-05-02 Listed $144,900 FAOR
- 2014-07-11 Sold (Public Records) $40,000 Public Records
- 2014-07-11 Sold (MLS) $40,000 FAOR
- 2013-11-22 Listed $44,900 FAOR
Property tax history
-0.0%/yrLatest (2025): $730 · -1.0% YoY. Source: county tax records.
Cash-flow waterfall
monthlySold comps — $/sqft
last 12 mo · ≤1 miLoading sold comps…