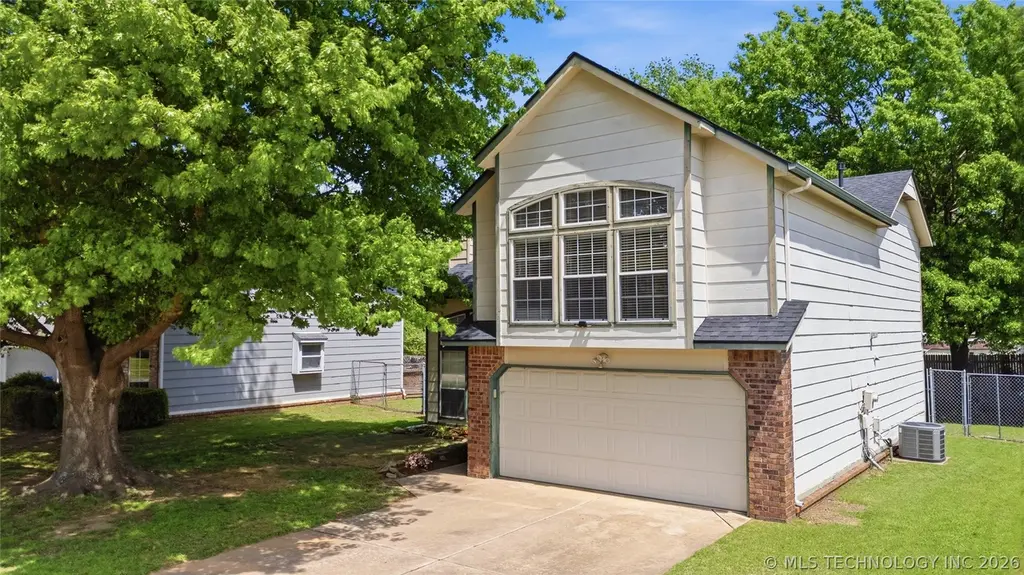
1509 N 26th Pl · Broken Arrow, OK
Flood risk 1/10 · Minimal
- FEMA flood zone
- X (unshaded)
- Chance of flooding over 30 yrs
- 0.0%
- Est. flood insurance / yr
- $507 – $1,088
Fire risk 4/10 · Minor
- Est. fire insurance / yr
- $2,463 – $4,575
Heat risk 6/10 · Moderate
- Hot days now (above 111°F)
- 7 days/yr
- Hot days in 30 yrs
- 19 days/yr
Wind risk 3/10 · Minor
- Chance of severe wind over 30 yrs
- 4.0%
Air-quality risk 2/10 · Minimal
- Unhealthy air days now
- 1 days/yr
- Unhealthy air days in 30 yrs
- 1 days/yr
Risk factors via First Street. Map © Google.
Why this score? — see what drove the D+ grade
The composite is a weighted blend of 9 inputs, each scored 0–100. Each bar is that input's sub-score; the figure is the points it added to the 100-point composite (weight × sub-score).
- ARV discount +14.2/15.0
- Cash flow +12.9/30.0
- DSCR +3.9/10.0
- Livability +3.9/5.0
- 1% rule +3.1/10.0
- Rent growth +3.0/5.0
- Condition / age +2.5/5.0
- Schools +2.4/10.0
- Appreciation +0.0/10.0
$269,900
🖨 Deal sheet (PDF) 📄 Offer letter ✓ Due diligence
Listing remarks MLS
Absolutely adorable and freshly updated. No more popcorn ceilings! Brand new carpet, lighting, hardware, fresh paint inside and out. 2 bedrooms and massive master suite up. 1 bedroom down, which could be a great office or flex room. Creekwood elementary.
Key facts
- Ample cabinetry
- Newer appliances
- Cozy fireplace
Tags
Property features AI
Finance
- HOA & community: Sidewalks; Gutters (community feature)
Exterior
- Parking: Attached garage with 2 spaces
- Security: Smoke detectors; No safety shelter
- Utilities: Cable available; Electricity available; Phone available; Public water; Public sewer
- Home design: Two-story home; Faces west; Slab foundation
- Construction: Brick and wood frame construction; Asphalt/fiberglass roof; Built per public records
- Exterior features: Landscaping; Exterior lighting; Rain gutters; Covered porch; Full privacy fencing; Mature trees
Interior
- Kitchen: Dishwasher; Disposal; Oven; Range; Stove; Gas range/oven connections; Eat-in kitchen with breakfast nook
- Bedrooms: Multiple bedrooms with walk-in closets; Master bedroom with separate closets and walk-in closet (second level)
- Flooring: Carpet; Tile
- Bathrooms: Two full bathrooms; One half bathroom; Master bath with separate shower and bathtub
- Heating & cooling: Central heating (gas) with multiple units and zoning; Central air conditioning with two units and zoning
- Interior features: High ceilings; Vaulted ceilings; Ceiling fans; Laminate counters; Other interior features; Aluminum window frames; Insulated windows
- Laundry & utility: Electric dryer hookup
Neighborhood map
What this means for you Summary
Snapshot
- This is a 4-bed/2.0-bath single-family listed at $270k.
Deal economics
- At list price, monthly cash flow is $-19 ($-224/yr) — negative.
- To cash-flow at today's rent, offer at most $267k (1.2% below list).
- To meet the 1% rule (rent ≥ 1% of price), the offer needs to be $219k (18.7% below list).
- Recommended offer: $219k (18.7% below list) — sets the bar for 1% rule.
- Cap rate 6.2% vs local median 4.0% in Broken Arrow — top-decile yield for the area; either an underpriced asset or a hidden risk that comps aren't pricing in. Stress-test before assuming the spread holds.
Location & tenants
- Location reads 78/100 on livability (#7 in OK, #2,691 nationally) — a middle-class / working-renter tenant base. Strengths: commute A+, cost of living A+, housing A+; Watch: amenities F.
- Broken Arrow (suburban): math 23% / reading 28% proficiency, ranked #79 of 270 in OK (top 29%) — low school quality limits family demand, transient renter base, plan for 1-2y turnover.
- Zoned schools: Creekwood Es (math 34% / reading 34%, grade F, #203 of 845 statewide, top 24%, 640 students, 0% FRL); Centennial Ms (math 19% / reading 26%, grade F, #122 of 345 statewide, top 37%, 1,121 students, 0% FRL); Broken Arrow Hs (math 22% / reading 36%, grade F, #120 of 447 statewide, top 27%, 4,589 students, 0% FRL) — zoned schools average 0% FRL vs 33% district-wide (33 pts lower); this property's tenant base skews higher-income than the district average.
- Market conditions: Rents rising (+2.1%/yr); 655 active listings in the ZIP; 4 comparable units currently listed for rent nearby; rentals at typical pace (median 25d on market — plan ~3-4 weeks tenant-placement turnaround); solid renter incomes; 581 units permitted in Wagoner County in 2024 (0 in 5+ unit buildings).
Forward outlook
- Local home prices are declining (-3.0%/yr); year-one equity from $2k of loan paydown is wiped out by about $8k of value loss. Plan a longer hold.
- Wagoner County population projected at +16% by 2050 — long-run rental-demand tailwind backs the buy-and-hold thesis.
Negotiation context
- Only 9 days on market — expect competitive offers; lowballing is unlikely to land.
- 4 sale attempts since 19y ago with the ask held roughly flat each time — persistent listings suggest the price (not the market) is what's stuck; bring a comps-based counter.
- Current owner paid $150k; list at $270k implies a 80% gain — meaningful room to come down on a strong offer.
Risks & watch-outs
- Climate carrying-cost: extreme-heat days projected 7→19/yr by 2055 (HVAC capex compounding) — expect insurance premiums to compound above CPI over the hold.
Questions for the listing agent
- What do current leases actually rent for vs. the listed asking? Can we see a recent rent roll and the last 12 months of T-12 income?
- Is there a deadline driving the sale (1031 exchange, divorce, estate, relocation)? That informs how much negotiation room exists.
- Schools are D-rated, which usually means shorter tenancies and higher turnover. Who's the typical renter profile here, and what's been the actual vacancy rate?
- The area grade is low — what's the realistic commute time and amenity access for the typical tenant pool here? Any planned neighborhood developments (good or bad) we should know about?
- What's the average days-on-market for RENTAL listings here right now (not sales)? A rising rental-DOM trend means longer vacancies and softer asking-rent achievability than the comps imply.
- What's the recent tenant-quality profile in this submarket — average credit score on applications, eviction rate, late-payment / NSF rate, and stable-employment percentage? A property-management company in the area should have these aggregated.
- How much new for-sale + rental construction is in the pipeline within 1–3 miles? Heavy new supply typically softens prices + rents 12–24 months out; constrained supply supports both.
Investment metrics
- 1% rule
- 0.81% ✗
- Cap rate
- 6.21%
- Cash-on-cash
- -0.30%
- DSCR
- 0.99
- GRM
- 10.2
CMA / ARV
- ARV (on-the-fly)
- $316,768
- Comps found
- 12
Show comp detail 12 sales within ~0.75 mi
| Address | Dist | Beds/Ba | Sqft | Sold | Price | $/sf | Match |
|---|---|---|---|---|---|---|---|
| 1509 N 26th Pl | 0.00mi | 4/2.5 | 2,084 (0%) | 1mo | $268,000 | $129 | 97 |
| 2705 E Reno St | 0.15mi | 4/2.5 | 2,092 (+0%) | 5mo | $247,600 | $118 | 86 |
| 1717 N 27th St | 0.23mi | 4/2.5 | 1,986 (-5%) | 3mo | $294,000 | $148 | 77 |
| 2204 E Princeton St | 0.34mi | 4/2.0 | 2,187 (+5%) | 3mo | $317,000 | $145 | 73 |
| 1516 N 21st St | 0.38mi | 4/2.0 | 1,974 (-5%) | 4mo | $299,900 | $152 | 70 |
| 1504 N 26th St | 0.09mi | 4/2.5 | 2,303 (+10%) | 11mo | $268,000 | $116 | 68 |
| 2108 E Princeton St | 0.38mi | 3/2.0 (-1) | 1,977 (-5%) | 5mo | $313,000 | $158 | 65 |
| 2101 E Princeton St | 0.43mi | 3/2.0 (-1) | 1,872 (-10%) | 1mo | $290,000 | $155 | 58 |
| 1509 N 22nd St | 0.30mi | 3/2.0 (-1) | 1,900 (-9%) | 11mo | $300,000 | $158 | 57 |
| 1800 N 26th St | 0.23mi | 3/2.0 (-1) | 1,850 (-11%) | 11mo | $273,500 | $148 | 57 |
| 1505 N 18th St | 0.63mi | 3/2.0 (-1) | 1,824 (-12%) | 0mo | $315,000 | $173 | 45 |
| 2514 E Sidney Ave | 0.67mi | 4/2.0 | 1,845 (-12%) | 13mo | $319,000 | $173 | 38 |
Match score weights: distance 35% · size 25% · config 20% · recency 20%. Top-matched comps best support the ARV.
Projected returns pro-forma
-3.0% appreciation · 2.12% rent growth · sell at horizon
- IRR
- -17.7%
- Equity multiple
- 0.38×
- Total profit
- $-46,886
- Equity at exit
- $40,243
- IRR
- -11.6%
- Equity multiple
- 0.33×
- Total profit
- $-50,269
- Equity at exit
- $23,336
Cash invested: $75,572 (down + closing). Projections, not guarantees.
Landlord ↔ Tenant lean methodology
- Overall (STATE)
- 83 Strongly Landlord-Friendly
- State Oklahoma
- 83 Strongly Landlord-Friendly · R+20
- County
- — inherits STATE
- City
- — inherits STATE
ZIP-level market 74014
- Rents YoY
- 2.1%
- Active inventory
- 655
- Price-to-rent
- 10.2×
Monthly cashflow live
- Estimated rent
- $2,195 medium interval (Pro) →
- Mortgage (P&I)
- −$1,415
- Tax from tax record
- −$225 /mo · $2,695/yr
- Insurance
- −$112
- HOA
- −$0
- Vacancy / Maint / Mgmt
- −$461
- Net cashflow
- $-19
Break-even live
Sensitivity live
| Price | -10% $134 | -5% $58 | +0% $-19 | +5% $-95 | +10% $-171 |
|---|---|---|---|---|---|
| Rent | -10% $-192 | -5% $-105 | +0% $-19 | +5% $68 | +10% $155 |
| Rate | -1.0pp $117 | -0.5pp $50 | base $-19 | +0.5pp $-89 | +1.0pp $-160 |
UW: 25.0% down · 7.5% · 30yr · 1.5% tax · 5.0% vac · 8.0% maint · 8.0% mgmt
Financing live
Cash to close
- Down payment
- $67,475
- Closing costs
- $8,097
- Reserves months
- —
- Total cash needed
- —
Loan-product check · same deal, 3 products live
Conventional
25% down · 7.5% · 30yr
- Down + closing
- —
- Monthly P&I
- —
- Monthly cashflow
- —
- DSCR
- —
- Eligible?
- —
Personal DTI + credit; lowest rate.
DSCR
20% down · 8.5% · 30yr
- Down + closing
- —
- Monthly P&I
- —
- Monthly cashflow
- —
- DSCR
- —
- Eligible?
- —
No personal income docs; deal must DSCR.
Hard money
10% down · 12.0% · 12mo
- Down + closing
- —
- Monthly P&I
- —
- Monthly cashflow
- —
- DSCR
- —
- Eligible?
- —
Short-term bridge; refi at stabilization.
Rent comps 4 comps
| Address | Beds | Baths | Sqft | Rent | $/sqft | DOM | Units | Dist |
|---|---|---|---|---|---|---|---|---|
| 1521 N 20th St Broken Arrow, OK | 3.0 | 2.0 | 1965 | $2,200 | $1.12 | 13d | 1 | 0.39mi |
| 2512 E Dallas St Broken Arrow, OK | 4.0 | 2.0 | 1922 | $1,899 | $0.99 | 25d | 1 | 1.10mi |
| 606 N Village Ave Broken Arrow, OK | 3.0 | 1.5 | 1434 | $1,528 | $1.07 | 3d | 1 | 1.16mi |
| 604 S 28th Pl Broken Arrow, OK | 3.0 | 2.0 | 1800 | $1,800 | $1.00 | 25d | 1 | 1.33mi |
Listing history 16 events
-
2026-04-30status Pending
-
2026-04-21$269,900 Active
-
2015-11-24soldstatus $150,000
-
2015-11-16soldstatus $150,219 Closed 254-char remark
Show marketing remark (254 chars)
Absolutely adorable and freshly updated. No more popcorn ceilings! Brand new carpet, lighting, hardware, fresh paint inside and out. 2 bedrooms and massive master suite up. 1 bedroom down, which could be a great office or flex room. Creekwood elementary.
-
2015-10-16status Pending 254-char remark
Show marketing remark (254 chars)
Absolutely adorable and freshly updated. No more popcorn ceilings! Brand new carpet, lighting, hardware, fresh paint inside and out. 2 bedrooms and massive master suite up. 1 bedroom down, which could be a great office or flex room. Creekwood elementary.
-
2015-08-14$154,000 Active 254-char remark
Show marketing remark (254 chars)
Absolutely adorable and freshly updated. No more popcorn ceilings! Brand new carpet, lighting, hardware, fresh paint inside and out. 2 bedrooms and massive master suite up. 1 bedroom down, which could be a great office or flex room. Creekwood elementary.
-
2008-09-19soldstatus $133,500
-
2008-09-15soldstatus $133,500 227-char remark
Show marketing remark (227 chars)
Step inside and be surprised at what this 4 Br 2 bath home has to offer. Expansive family area, grand master suite, kitchen that puts everything you've seen to shame. Of course there's 2 car garage and professional landscaping.
-
2008-08-22historical 227-char remark
Show marketing remark (227 chars)
Step inside and be surprised at what this 4 Br 2 bath home has to offer. Expansive family area, grand master suite, kitchen that puts everything you've seen to shame. Of course there's 2 car garage and professional landscaping.
-
2008-04-11$135,000 227-char remark
Show marketing remark (227 chars)
Step inside and be surprised at what this 4 Br 2 bath home has to offer. Expansive family area, grand master suite, kitchen that puts everything you've seen to shame. Of course there's 2 car garage and professional landscaping.
-
2007-09-10soldstatus $125,000
-
2007-09-04soldstatus $124,900
-
2007-07-16historical
-
2007-07-11$124,900
-
1994-09-15soldstatus $80,000
-
1992-08-04soldstatus $72,000
ⓘ Source: listings_history table (triggers on properties + properties_extension) + one-shot
backfill from property_details.listing_events for pre-trigger history.
Tax reassessment forecast OK · Resets to sale price
- Current annual tax
- $2,695 · $225/mo
- Projected year-2 tax
- $2,695 · $225/mo
- Expected delta
- $0/yr ($0/mo · 0.0%)
ⓘ Screening estimate from a state-policy table — verify with the county assessor before closing.
Climate risk First Street
- Flood 1/10 Low FEMA zone X (unshaded) · 0% chance over 30 yrs
- Wildfire 4/10 Moderate
- Heat 6/10 Major 7 d/yr ≥111°F today · 19 d/yr by 30 yrs out
- Wind 3/10 Moderate 4% chance of damaging wind over 30 yrs
- Air quality 2/10 Low 1 unhealthy d/yr today · 1 by 30 yrs out
Nearby sold comps map
Loading sold comps map…
Walkable amenities ~0.75 mi
Loading nearby amenities…
Taxation est. · year 1
- Rental income
- $26,336
- − Mortgage interest
- −$15,119
- − Property taxes
- −$2,695
- − Insurance
- −$1,350
- − Repairs & maintenance
- −$2,107
- − Management
- −$2,107
- − Depreciation
- −$7,852
- Taxable loss
- −$4,893
- Est. tax savings @ 24.0%
- +$1,174
- After-tax cash flow
- $950/yr
For passive investors: Depreciation is non-cash, so a rental often shows a tax loss while cash-flowing — sheltering income. Rental losses are passive: they offset passive income freely, and up to $25,000/yr can offset ordinary (W-2) income if you actively participate and your MAGI is under $100k (phasing out to $0 by $150k); unused losses carry forward. On sale, claimed depreciation is recaptured at up to 25%, and gains may owe capital-gains tax (a 1031 exchange can defer both). Figures are a year-1 estimate at your 24.0% rate — not tax advice; consult a CPA.
Schools (NCES district)
- District
- Broken Arrow
- NCES district ID
- 4005490
- Math proficiency
- 23% ▼ -9.00%
- Reading proficiency
- 28% ▼ -9.00%
- Median HH income
- $64,646
- Composite
- 23.86/100
- National rank
- #7801
- State rank
- #79 of 270 in OK
Livability — Broken Arrow
- Score
- 78/100
- State rank
- #7
- US rank
- #2691
Category grades
Schools grade is shown separately in the Schools card above.
Census & demographics
- Census place
- Broken Arrow, OK
- County
- Wagoner County · 61,834 people
- City population
- 144,172
- Metro
- Tulsa, OK
- Population (ZIP)
- 45,212
- Household income
- $95,501
- Rent vs Own
- Severe rent burden
- 289.0
Population outlook (Wagoner County) Hauer SSP2
- Today (2025)
- 84,796 people
- By 2030
- 88,162 · +4.0%
- By 2040
- 93,882 · +10.7%
- By 2050
- 98,219 · +15.8%
- By 2075
- 106,561 · +25.7%
- By 2100
- 109,360 · +29.0%
Race, ethnicity, and origin ACS 2023
- Neighborhood character
- Predominantly White (69%)
- Race & ethnicity
- White 69% Two or more races 11% Hispanic / Latino 11% Native American 6% Asian 4% Black 3%
- Hispanic origin (detail)
- Mexican 8%
- Common ancestry
- Italian 2% Slovak 2% Lithuanian 2%
- Foreign-born
- 7% · Canada
- Languages at home
- 89% English-only · Spanish 7% Other Asian/Pacific 2% Russian/Polish/Slavic 1%
Political lean MEDSL · Wagoner
- 2024 margin
- Solid R (+49.8) · D 24.2% · R 74.0% · Other 1.8%
- 2008→2024 swing
- -8.0pp toward R · 2008: -41.8pp · 2024: -49.8pp
- All cycles
- 2024: R+49.8 2020: R+50.1 2016: R+52.0 2012: R+45.7 2008: R+41.8
Not yet ingested
- Civics
- —
Market trends
- HPI YoY
- ▼ -206.67%
- Current HPI
- 203.7301
- Rent YoY
- ▲ 2.12%
- Metro
- Tulsa, OK
- State GDP YoY
- ▲ 1.55%
- F500 in state
- 6
Industry mix (Fortune 500 HQ in OK)
| Industry | F500 HQs | Revenue |
|---|---|---|
| Energy | 3 | $48B |
|
||
Price history
+274.9% since first listed16 events — show timeline
- 2026-04-30 Pending — MLS Technology, Inc.
- 2026-04-21 Listed $269,900 MLS Technology, Inc.
- 2015-11-24 Sold (Public Records) $150,000 Public Records
- 2015-11-16 Sold (MLS) $150,219 MLS Technology, Inc.
- 2015-10-16 Pending — MLS Technology, Inc.
- 2015-08-14 Listed $154,000 MLS Technology, Inc.
- 2008-09-19 Sold (Public Records) $133,500 Public Records
- 2008-09-15 Sold (MLS) $133,500 MLS Technology, Inc.
- 2008-08-22 Listing Removed — MLS Technology, Inc.
- 2008-04-11 Listed $135,000 MLS Technology, Inc.
- 2007-09-10 Sold (Public Records) $125,000 Public Records
- 2007-09-04 Sold (MLS) $124,900 MLS Technology, Inc.
- 2007-07-16 Listing Removed — MLS Technology, Inc.
- 2007-07-11 Listed $124,900 MLS Technology, Inc.
- 1994-09-15 Sold (Public Records) $80,000 Public Records
- 1992-08-04 Sold (Public Records) $72,000 Public Records
Property tax history
+3.7%/yrLatest (2025): $2,695 · +4.9% YoY. Source: county tax records.
Cash-flow waterfall
monthlySold comps — $/sqft
last 12 mo · ≤1 miLoading sold comps…