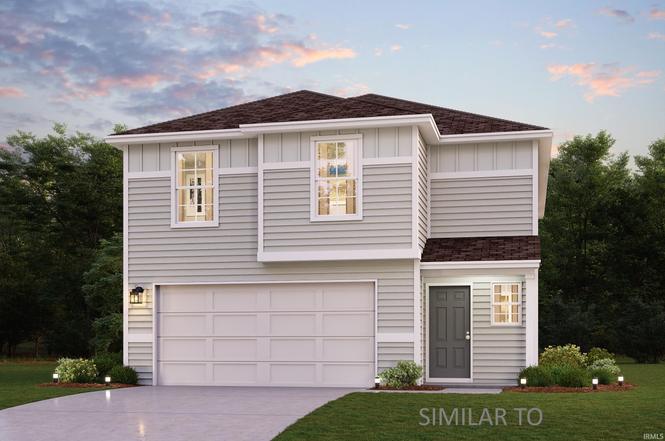
504 Fulkerson Dr · Charlestown, IN
Flood risk No data
- FEMA flood zone
- —
- Chance of flooding over 30 yrs
- —
- Est. flood insurance / yr
- —
Fire risk No data
- Est. fire insurance / yr
- —
Heat risk No data
- Hot days now (above threshold)
- —
- Hot days in 30 yrs
- —
Wind risk No data
- Chance of severe wind over 30 yrs
- —
Air-quality risk No data
- Unhealthy air days now
- —
- Unhealthy air days in 30 yrs
- —
Risk factors via First Street. Map © Google.
Why this score? — see what drove the D- grade
The composite is a weighted blend of 9 inputs, each scored 0–100. Each bar is that input's sub-score; the figure is the points it added to the 100-point composite (weight × sub-score).
- Cash flow +12.1/30.0
- ARV discount +7.2/15.0
- Condition / age +4.0/5.0
- 1% rule +3.6/10.0
- DSCR +3.6/10.0
- Livability +3.2/5.0
- Schools +2.7/10.0
- Rent growth +2.5/5.0
- Appreciation +0.0/10.0
$250,990
🖨 Deal sheet (PDF) 📄 Offer letter ✓ Due diligence
Listing remarks
Welcome to your dream home in the Villas of Springville Manor Community! Discover the stunning Berkshire Plan, a new 2-story home. This modern residence features a spacious open-concept design that seamlessly integrates a gourmet kitchen with the Great Room and dining area. The kitchen boasts refined cabinetry, quartz countertops, and stainless steel appliances, including an electric smooth-top range, dishwasher, and over-the-range microwave—ideal for culinary enthusiasts. The first floor also includes a chic powder room for guests. Upstairs, enjoy generously sized bedrooms with ample closet space and a primary suite with a private bath and expansive walk-in closet. Additional highli
Key facts
- Open-concept design
- Private bath
- Gourmet kitchen
Tags
Neighborhood map
What this means for you Summary
Snapshot
- This is a 4-bed/2.5-bath single-family listed at $251k. Condition is rated good.
Deal economics
- At list price, monthly cash flow is $-53 ($-641/yr) — negative.
- To cash-flow at today's rent, offer at most $243k (3.1% below list).
- To meet the 1% rule (rent ≥ 1% of price), the offer needs to be $215k (14.4% below list).
- Recommended offer: $215k (14.4% below list) — sets the bar for 1% rule.
- Cap rate 6.0% vs local median 3.2% in Charlestown — top-decile yield for the area; either an underpriced asset or a hidden risk that comps aren't pricing in. Stress-test before assuming the spread holds.
Location & tenants
- Location reads 65/100 on livability (#352 in IN) — a middle-class / working-renter tenant base. Strengths: crime A+, cost of living A+, housing A+; Watch: amenities F, commute F, health & safety F.
- Greater Clark County Schools (suburban): math 26% / reading 37% proficiency, ranked #224 of 301 in IN (top 74%) — families likely to look elsewhere, expect single-tenant / working-renter base with shorter leases.
- Zoned schools: Pleasant Ridge Elementary School (531 students, 54% FRL); Charlestown Middle School (math 23% / reading 40%, grade F, #197 of 330 statewide, top 60%, 612 students, 44% FRL); Charlestown Senior High School (math 17% / reading 57%, grade F, #247 of 369 statewide, top 70%, 788 students, 40% FRL) — zoned schools at 46% FRL track the district average.
- Market conditions: 264 active listings in the ZIP; 2 comparable units currently listed for rent nearby; solid renter incomes; 911 units permitted in Clark County in 2024 (133 in 5+ unit buildings).
Forward outlook
- Local home prices are declining (-3.0%/yr); year-one equity from $2k of loan paydown is wiped out by about $8k of value loss. Plan a longer hold.
- Clark County population projected at +17% by 2050 — long-run rental-demand tailwind backs the buy-and-hold thesis.
Negotiation context
- It's been on market 20 days — a 2% lower offer ($247k) is reasonable based on typical stale-listing flexibility.
Questions for the listing agent
- What do current leases actually rent for vs. the listed asking? Can we see a recent rent roll and the last 12 months of T-12 income?
- What does the HOA fee cover, when was the last increase, and are there any pending special assessments or reserve-fund shortfalls?
- Is there a deadline driving the sale (1031 exchange, divorce, estate, relocation)? That informs how much negotiation room exists.
- Schools are D-rated, which usually means shorter tenancies and higher turnover. Who's the typical renter profile here, and what's been the actual vacancy rate?
- The area grade is low — what's the realistic commute time and amenity access for the typical tenant pool here? Any planned neighborhood developments (good or bad) we should know about?
- What's the average days-on-market for RENTAL listings here right now (not sales)? A rising rental-DOM trend means longer vacancies and softer asking-rent achievability than the comps imply.
- What's the recent tenant-quality profile in this submarket — average credit score on applications, eviction rate, late-payment / NSF rate, and stable-employment percentage? A property-management company in the area should have these aggregated.
- How much new for-sale + rental construction is in the pipeline within 1–3 miles? Heavy new supply typically softens prices + rents 12–24 months out; constrained supply supports both.
Investment metrics
- 1% rule
- 0.86% ✗
- Cap rate
- 6.04%
- Cash-on-cash
- -0.91%
- DSCR
- 0.96
- GRM
- 9.7
CMA / ARV
- ARV (on-the-fly)
- $249,555
- Comps found
- 12
Show comp detail 12 sales within ~0.75 mi
| Address | Dist | Beds/Ba | Sqft | Sold | Price | $/sf | Match |
|---|---|---|---|---|---|---|---|
| 431 Springville Dr | 0.06mi | 4/2.5 | 1,965 (0%) | 5mo | $239,990 | $122 | 93 |
| 432 Springville Dr | 0.06mi | 4/2.5 | 1,965 (0%) | 5mo | $239,990 | $122 | 93 |
| 435 Springville Dr | 0.06mi | 4/2.5 | 1,965 (0%) | 6mo | $239,991 | $122 | 92 |
| 436 Springville Dr | 0.06mi | 4/2.5 | 1,965 (0%) | 7mo | $249,991 | $127 | 92 |
| 428 Springville Dr | 0.06mi | 4/2.5 | 1,965 (0%) | 11mo | $259,990 | $132 | 88 |
| 404 Springville Dr | 0.06mi | 4/2.5 | 1,965 (0%) | 14mo | $249,991 | $127 | 86 |
| 342 Jackson Way | 0.08mi | 4/2.5 | 1,965 (0%) | 13mo | $249,991 | $127 | 85 |
| 924 Monroe St | 0.56mi | 3/1.0 (-1) | 1,956 (-0%) | 3mo | $247,300 | $126 | 60 |
| 7847 Linwood (lot #431) Cir | 0.72mi | 4/3.0 | 1,919 (-2%) | 13mo | $350,000 | $182 | 49 |
| 4401- LOT 110 Edge Rock Rd | 0.72mi | 3/2.5 (-1) | 1,721 (-12%) | 2mo | $301,696 | $175 | 39 |
| 770 Level St | 0.75mi | 3/2.0 (-1) | 2,124 (+8%) | 9mo | $245,000 | $115 | 37 |
| 132 Church St | 0.69mi | 4/1.5 | 1,714 (-13%) | 8mo | $126,000 | $74 | 36 |
Match score weights: distance 35% · size 25% · config 20% · recency 20%. Top-matched comps best support the ARV.
Projected returns pro-forma
-3.0% appreciation · 3.0% rent growth · sell at horizon
- IRR
- -17.8%
- Equity multiple
- 0.37×
- Total profit
- $-44,029
- Equity at exit
- $37,423
- IRR
- -9.9%
- Equity multiple
- 0.39×
- Total profit
- $-42,545
- Equity at exit
- $21,701
Cash invested: $70,277 (down + closing). Projections, not guarantees.
Landlord ↔ Tenant lean methodology
- Overall (STATE)
- 90 Strongly Landlord-Friendly
- State Indiana
- 90 Strongly Landlord-Friendly · R+11
- County
- — inherits STATE
- City
- — inherits STATE
ZIP-level market 47111
- Active inventory
- 264
- Price-to-rent
- 9.7×
Monthly cashflow live
- Estimated rent
- $2,150 medium interval (Pro) →
- Mortgage (P&I)
- −$1,316
- Tax est. 1.5%
- −$314 /mo · $3,765/yr
- Insurance
- −$105
- HOA
- −$17
- Vacancy / Maint / Mgmt
- −$451
- Net cashflow
- $-53
Break-even live
Sensitivity live
| Price | -10% $120 | -5% $33 | +0% $-53 | +5% $-140 | +10% $-227 |
|---|---|---|---|---|---|
| Rent | -10% $-223 | -5% $-138 | +0% $-53 | +5% $32 | +10% $116 |
| Rate | -1.0pp $73 | -0.5pp $10 | base $-53 | +0.5pp $-118 | +1.0pp $-185 |
UW: 25.0% down · 7.5% · 30yr · 1.5% tax · 5.0% vac · 8.0% maint · 8.0% mgmt
Financing live
Cash to close
- Down payment
- $62,748
- Closing costs
- $7,530
- Reserves months
- —
- Total cash needed
- —
Loan-product check · same deal, 3 products live
Conventional
25% down · 7.5% · 30yr
- Down + closing
- —
- Monthly P&I
- —
- Monthly cashflow
- —
- DSCR
- —
- Eligible?
- —
Personal DTI + credit; lowest rate.
DSCR
20% down · 8.5% · 30yr
- Down + closing
- —
- Monthly P&I
- —
- Monthly cashflow
- —
- DSCR
- —
- Eligible?
- —
No personal income docs; deal must DSCR.
Hard money
10% down · 12.0% · 12mo
- Down + closing
- —
- Monthly P&I
- —
- Monthly cashflow
- —
- DSCR
- —
- Eligible?
- —
Short-term bridge; refi at stabilization.
Rent comps 2 comps
| Address | Beds | Baths | Sqft | Rent | $/sqft | DOM | Units | Dist |
|---|---|---|---|---|---|---|---|---|
| 336 Jackson Way Charlestown, IN | 3.0 | 3.0 | 1566 | $2,200 | $1.40 | 12d | 1 | 0.11mi |
| 213 Lowell Ave Charlestown, IN | 3.0 | 2.0 | 1416 | $1,700 | $1.20 | 45d | 1 | 1.23mi |
HOA detail
- Monthly dues
- $17 · $204/yr
- Likely covers
- electric
Listing history 3 events
-
2026-04-01status Pending
-
2026-04-01price $250,990
-
2026-03-12$255,990 Active
ⓘ Source: listings_history table (triggers on properties + properties_extension) + one-shot
backfill from property_details.listing_events for pre-trigger history.
Nearby sold comps map
Loading sold comps map…
Walkable amenities ~0.75 mi
Loading nearby amenities…
Taxation est. · year 1
- Rental income
- $25,794
- − Mortgage interest
- −$14,059
- − Property taxes
- −$3,765
- − Insurance
- −$1,255
- − Repairs & maintenance
- −$2,064
- − Management
- −$2,064
- − HOA
- −$204
- − Depreciation
- −$7,302
- Taxable loss
- −$4,917
- Est. tax savings @ 24.0%
- +$1,180
- After-tax cash flow
- $539/yr
For passive investors: Depreciation is non-cash, so a rental often shows a tax loss while cash-flowing — sheltering income. Rental losses are passive: they offset passive income freely, and up to $25,000/yr can offset ordinary (W-2) income if you actively participate and your MAGI is under $100k (phasing out to $0 by $150k); unused losses carry forward. On sale, claimed depreciation is recaptured at up to 25%, and gains may owe capital-gains tax (a 1031 exchange can defer both). Figures are a year-1 estimate at your 24.0% rate — not tax advice; consult a CPA.
Condition & rehab AI · 4 photos
This home is in good condition with a good exterior and interior. It has a good roof and flooring, and the systems appear to be in good working order. The home is ready for a new owner and would benefit from a fresh coat of paint on the exterior siding and a thorough gutter inspection.
Value-add opportunities
- Both Paint the exterior siding — Painting the exterior siding can enhance the curb appeal and increase the home's value.
- Both Inspect and clean the gutters — Maintaining the gutters can prevent water damage and improve the home's overall appearance.
Renovation cost estimate screening
Value-add ROI direction
- Both Paint the exterior siding — Painting the exterior siding can enhance the curb appeal and increase the home's value. ↑
- Both Inspect and clean the gutters — Maintaining the gutters can prevent water damage and improve the home's overall appearance. ↑
ⓘ Cost ranges are severity-bucket heuristics (US national rule-of-thumb). Get contractor quotes + a written scope before underwriting a rehab budget.
Schools (NCES district)
- District
- Greater Clark County Schools
- NCES district ID
- 1803940
- Math proficiency
- 26% ▼ -15.00%
- Reading proficiency
- 37% ▼ -13.00%
- Median HH income
- $47,838
- Composite
- 27.2/100
- National rank
- #7020
- State rank
- #224 of 301 in IN
Livability — Charlestown
- Score
- 65/100
- State rank
- #352
- US rank
- #13430
Category grades
Schools grade is shown separately in the Schools card above.
Census & demographics
- Census place
- Charlestown, IN
- County
- Clark County · 108,879 people
- City population
- 17,738
- Metro
- Louisville/Jefferson County, KY-IN
- Population (ZIP)
- 17,738
- Household income
- $95,376
- Rent vs Own
- Severe rent burden
- 151.0
Population outlook (Clark County) Hauer SSP2
- Today (2025)
- 126,401 people
- By 2030
- 131,455 · +4.0%
- By 2040
- 140,471 · +11.1%
- By 2050
- 147,677 · +16.8%
- By 2075
- 161,702 · +27.9%
- By 2100
- 164,078 · +29.8%
Race, ethnicity, and origin ACS 2023
- Neighborhood character
- Predominantly White (87%)
- Race & ethnicity
- White 87% Two or more races 5% Hispanic / Latino 4% Black 3%
- Common ancestry
- Italian 2% Lithuanian 2% Romanian 2%
- Foreign-born
- 3% · Canada, China
- Languages at home
- 95% English-only · Spanish 3% Chinese 1%
Political lean MEDSL · Clark
- 2024 margin
- Strong R (+20.4) · D 38.9% · R 59.3% · Other 1.8%
- 2008→2024 swing
- -13.3pp toward R · 2008: -7.1pp · 2024: -20.4pp
- All cycles
- 2024: R+20.4 2020: R+18.3 2016: R+22.0 2012: R+9.9 2008: R+7.1
Not yet ingested
- Civics
- —
Market trends
- HPI YoY
- ▼ -126.16%
- Current HPI
- 198.7046
- Rent YoY
- —
- Metro
- Louisville/Jefferson County, KY-IN
- State GDP YoY
- ▲ 2.90%
- F500 in state
- 18
Industry mix (Fortune 500 HQ in IN)
| Industry | F500 HQs | Revenue |
|---|---|---|
| Industrial Machinery | 2 | $37B |
|
||
| Healthcare | 1 | $177B |
|
||
| Pharmaceuticals | 1 | $45B |
|
||
| Metals / Steel | 1 | $18B |
|
||
| Agriculture | 1 | $17B |
|
||
| Packaging | 1 | $12B |
|
||
Price history
-2.0% since first listed3 events — show timeline
- 2026-04-01 Pending — IRMLS
- 2026-04-01 Price Changed $250,990 IRMLS
- 2026-03-12 Listed $255,990 IRMLS
Cash-flow waterfall
monthlySold comps — $/sqft
last 12 mo · ≤1 miLoading sold comps…