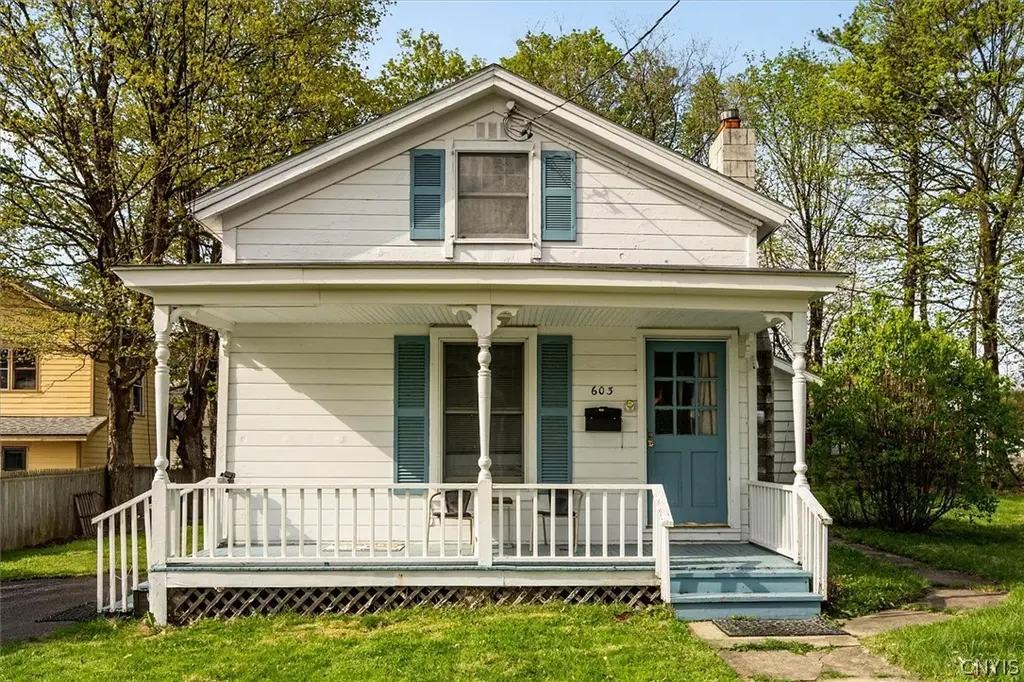
603 Clinton St · Fayetteville, NY
Flood risk 1/10 · Minimal
- FEMA flood zone
- X (unshaded)
- Chance of flooding over 30 yrs
- 0.0%
- Est. flood insurance / yr
- $473 – $860
Fire risk 1/10 · Minimal
- Est. fire insurance / yr
- $691 – $1,283
Heat risk 3/10 · Minor
- Hot days now (above 94°F)
- 7 days/yr
- Hot days in 30 yrs
- 16 days/yr
Wind risk 1/10 · Minimal
- Chance of severe wind over 30 yrs
- 0.0%
Air-quality risk 2/10 · Minimal
- Unhealthy air days now
- 0 days/yr
- Unhealthy air days in 30 yrs
- 1 days/yr
Risk factors via First Street. Map © Google.
Why this score? — see what drove the D grade
The composite is a weighted blend of 9 inputs, each scored 0–100. Each bar is that input's sub-score; the figure is the points it added to the 100-point composite (weight × sub-score).
- ARV discount +15.0/15.0
- Cash flow +7.6/30.0
- Schools +7.1/10.0
- Livability +4.1/5.0
- 1% rule +4.0/10.0
- Rent growth +2.5/5.0
- Condition / age +2.5/5.0
- DSCR +1.7/10.0
- Appreciation +0.0/10.0
$210,000
🖨 Deal sheet (PDF) 📄 Offer letter ✓ Due diligence
Listing remarks
This is the lowest priced "move-in" ready home in all of Fayetteville-Manlius! Major updates over the past 6 years includes a newer roof, furnace, hot water heater, and windows, offering peace of mind while preserving the home’s historic charm. This charming vintage home blends classic character with thoughtful updates, all set on a rare double flat lot in the heart of the Village of Fayetteville. The home offers a good sized first floor bedroom and a full bathroom. The bright and comfortable living area features wide plank wood floors. The space offers a warm, inviting feel with a functional layout. The living room flows into the large dining room, featuring hardwood floors
Key facts
- Covered front porch
- Double flat lot
- Covered rear patio
Tags
Property features AI
Exterior
- Parking: No garage
- Utilities: Public water connected; Sewer connected; Cable available; Circuit breaker electric service
- Home design: 2-story existing residence; Stone foundation; Asphalt shingle roof; Wood siding; Contains copper plumbing
- Construction: Built (existing); Wood siding construction; Stone foundation; Asphalt shingle roof
- Exterior features: Blacktop and gravel driveways; Covered porch; Patio; Shed(s) / exterior storage; Rectangular residential lot; City street frontage; Lot dimensions approximately 99 x 129
Interior
- Kitchen: Granite counters; Gas oven; Gas range; Refrigerator
- Bedrooms: One main-level bedroom
- Flooring: Hardwood; Luxury vinyl; Resilient flooring; Varies
- Bathrooms: One full bathroom (main level)
- Heating & cooling: Gas forced-air heating; Window cooling unit(s)
- Interior features: Skylights; Breakfast bar; Separate formal dining room; Separate formal living room; Granite counters; Bedroom on main level; Has basement with exterior entry, partial finish, and walk-up access
- Laundry & utility: Laundry in basement; Electric and gas water heaters
Neighborhood map
What this means for you Summary
Snapshot
- This is a 2-bed/1.0-bath single-family listed at $210k.
Deal economics
- At list price, monthly cash flow is $-255 ($-3k/yr) — negative.
- To cash-flow at today's rent, offer at most $165k (21.5% below list).
- To meet the 1% rule (rent ≥ 1% of price), the offer needs to be $190k (9.5% below list).
- Recommended offer: $165k (21.5% below list) — sets the bar for cash-flow.
- Cap rate 4.8% vs local median 3.1% in Fayetteville — top-decile yield for the area; either an underpriced asset or a hidden risk that comps aren't pricing in. Stress-test before assuming the spread holds.
Location & tenants
- Location reads 82/100 on livability (#71 in NY, #1,067 nationally) — a professional / high-income tenant draw. Strengths: employment A+, housing A+, health & safety A+; Watch: amenities D, commute F.
- Fayetteville-Manlius Central School District (suburban): math 79% / reading 81% proficiency, ranked #49 of 590 in NY (top 8%) — strong family-tenant draw, lease renewals of 3-5y typical; only 7% free/reduced lunch — higher-income household profile.
- Zoned schools: Fayetteville Elementary School (math 77% / reading 82%, grade A, #188 of 2,108 statewide, top 11%, 464 students, 23% FRL); Wellwood Middle School (math 68% / reading 78%, grade A, #72 of 729 statewide, top 10%, 652 students, 0% FRL); Fayetteville-Manlius Senior High School (math 98% / reading 84%, grade A+, #201 of 1,100 statewide, top 18%, 1,416 students, 0% FRL) — zoned schools at 8% FRL track the district average.
- Market conditions: 70 active listings in the ZIP; 1 comparable units currently listed for rent nearby; 616 units permitted in Onondaga County in 2024 (256 in 5+ unit buildings).
Forward outlook
- Local home prices are declining (-3.0%/yr); year-one equity from $1k of loan paydown is wiped out by about $6k of value loss. Plan a longer hold.
- Onondaga County population projected to shrink 9% by 2050 — rents likely to lag national; underwrite the cash flow, not the appreciation.
Negotiation context
- It's been on market 45 days — a 3% lower offer ($204k) is reasonable based on typical stale-listing flexibility.
- 3 sale attempts since 16y ago; this cycle's ask has dropped $14k (6%) from the opening price — seller is motivated, your offer sets the floor, not the list.
- Current owner paid $130k; list at $210k implies a 62% gain — meaningful room to come down on a strong offer.
Risks & watch-outs
- Watch-outs: property tax is 3.2% of price; built in 1863 — expect roof / HVAC / electrical / plumbing capex.
Questions for the listing agent
- What do current leases actually rent for vs. the listed asking? Can we see a recent rent roll and the last 12 months of T-12 income?
- It's been on market 45 days. Have you received any prior offers? Is the seller open to a 21% concession, seller financing, or rate buy-down credit?
- Built in 1863 — when were the roof, HVAC, electrical panel, plumbing, and water heater last replaced?
- Property tax is high relative to price — has the assessment been appealed recently, and will the sale trigger a re-assessment?
- Is there a deadline driving the sale (1031 exchange, divorce, estate, relocation)? That informs how much negotiation room exists.
- Schools are A-rated — typically a magnet for longer-tenancy family renters. What's the average tenant stay here, and is there a school-zone premium baked into asking?
- The area grade is low — what's the realistic commute time and amenity access for the typical tenant pool here? Any planned neighborhood developments (good or bad) we should know about?
- What's the average days-on-market for RENTAL listings here right now (not sales)? A rising rental-DOM trend means longer vacancies and softer asking-rent achievability than the comps imply.
- What's the recent tenant-quality profile in this submarket — average credit score on applications, eviction rate, late-payment / NSF rate, and stable-employment percentage? A property-management company in the area should have these aggregated.
- How much new for-sale + rental construction is in the pipeline within 1–3 miles? Heavy new supply typically softens prices + rents 12–24 months out; constrained supply supports both.
Investment metrics
- 1% rule
- 0.90% ✗
- Cap rate
- 4.84%
- Cash-on-cash
- -5.21%
- DSCR
- 0.77
- GRM
- 9.2
CMA / ARV
- ARV (median comp)
- $279,444
- List price
- $210,000
- Delta
- -24.85%
- Verdict
- UNDERPRICED
- Comps
- 20 within 1.0 mi
Show comp detail 12 sales within ~0.75 mi
| Address | Dist | Beds/Ba | Sqft | Sold | Price | $/sf | Match |
|---|---|---|---|---|---|---|---|
| Lot 12 Clinton St | 0.36mi | 2/2.0 | 1,286 (+1%) | 3mo | $435,000 | $338 | 76 |
| 114 S Park St | 0.29mi | 3/1.5 (+1) | 1,329 (+4%) | 3mo | $287,000 | $216 | 71 |
| 201 Warren St | 0.23mi | 3/2.5 (+1) | 1,175 (-8%) | 7mo | $281,500 | $240 | 59 |
| 208 Concord Pl | 0.40mi | 3/2.5 (+1) | 1,362 (+7%) | 0mo | $335,000 | $246 | 59 |
| 121 Mill St | 0.37mi | 3/1.0 (+1) | 1,366 (+7%) | 15mo | $135,000 | $99 | 53 |
| 101 Griffin Dr | 0.56mi | 3/1.5 (+1) | 1,202 (-6%) | 6mo | $294,900 | $245 | 52 |
| 312 South St | 0.36mi | 3/2.0 (+1) | 1,417 (+11%) | 6mo | $285,000 | $201 | 51 |
| 106 Euclid Dr | 0.68mi | 2/2.0 | 1,316 (+3%) | 10mo | $354,000 | $269 | 51 |
| 206 Euclid Dr | 0.69mi | 3/1.0 (+1) | 1,212 (-5%) | 8mo | $290,000 | $239 | 48 |
| 152 N Burdick St | 0.72mi | 2/1.0 | 1,110 (-13%) | 0mo | $90,000 | $81 | 44 |
| 213 Euclid Dr | 0.67mi | 3/1.5 (+1) | 1,134 (-11%) | 3mo | $280,000 | $247 | 40 |
| 803 Oakwood St | 0.59mi | 3/2.0 (+1) | 1,463 (+14%) | 2mo | $320,000 | $219 | 38 |
Match score weights: distance 35% · size 25% · config 20% · recency 20%. Top-matched comps best support the ARV.
Projected returns pro-forma
-3.0% appreciation · 3.0% rent growth · sell at horizon
- IRR
- -25.0%
- Equity multiple
- 0.15×
- Total profit
- $-50,063
- Equity at exit
- $31,312
- IRR
- -20.5%
- Equity multiple
- -0.08×
- Total profit
- $-63,640
- Equity at exit
- $18,157
Cash invested: $58,800 (down + closing). Projections, not guarantees.
Landlord ↔ Tenant lean methodology
- Overall (STATE)
- 15 Strongly Tenant-Friendly
- State New York
- 15 Strongly Tenant-Friendly · D+10
- County
- — inherits STATE
- City
- — inherits STATE
ZIP-level market 13066
- Home prices YoY
- -28.0%
- Active inventory
- 70
- Price-to-rent
- 9.2×
Monthly cashflow live
- Estimated rent
- $1,900 medium interval (Pro) →
- Mortgage (P&I)
- −$1,101
- Tax from tax record
- −$567 /mo · $6,808/yr
- Insurance
- −$88
- HOA
- −$0
- Vacancy / Maint / Mgmt
- −$399
- Net cashflow
- $-255
Break-even live
Sensitivity live
| Price | -10% $-136 | -5% $-196 | +0% $-255 | +5% $-315 | +10% $-374 |
|---|---|---|---|---|---|
| Rent | -10% $-405 | -5% $-330 | +0% $-255 | +5% $-180 | +10% $-105 |
| Rate | -1.0pp $-149 | -0.5pp $-202 | base $-255 | +0.5pp $-310 | +1.0pp $-365 |
UW: 25.0% down · 7.5% · 30yr · 1.5% tax · 5.0% vac · 8.0% maint · 8.0% mgmt
Financing live
Cash to close
- Down payment
- $52,500
- Closing costs
- $6,300
- Reserves months
- —
- Total cash needed
- —
Loan-product check · same deal, 3 products live
Conventional
25% down · 7.5% · 30yr
- Down + closing
- —
- Monthly P&I
- —
- Monthly cashflow
- —
- DSCR
- —
- Eligible?
- —
Personal DTI + credit; lowest rate.
DSCR
20% down · 8.5% · 30yr
- Down + closing
- —
- Monthly P&I
- —
- Monthly cashflow
- —
- DSCR
- —
- Eligible?
- —
No personal income docs; deal must DSCR.
Hard money
10% down · 12.0% · 12mo
- Down + closing
- —
- Monthly P&I
- —
- Monthly cashflow
- —
- DSCR
- —
- Eligible?
- —
Short-term bridge; refi at stabilization.
Rent comps 1 comps
| Address | Beds | Baths | Sqft | Rent | $/sqft | DOM | Units | Dist |
|---|---|---|---|---|---|---|---|---|
| 219 Highbridge St #5 Fayetteville, NY | 2.0 | 1.5 | 1518 | $1,900 | $1.25 | 15d | 1 | 0.45mi |
Listing history 19 events
-
2026-06-09status $210,000 Pending 45 DOM
-
2026-06-08days on market $210,000 Active 45 DOM
-
2026-06-07days on market $210,000 Active 44 DOM
-
2026-06-05days on market $210,000 Active 41 DOM
-
2026-06-02days on market $210,000 Active 39 DOM
-
2026-06-01days on market $210,000 Active 38 DOM
-
2026-05-31days on market $210,000 Active 37 DOM
-
2026-05-30days on market $210,000 Active 36 DOM
-
2026-05-01price $218,000 1560-char remark
-
2026-04-24$224,000 Active 1560-char remark
-
2026-04-14historical
-
2026-02-11price $224,000
-
2026-01-21price $230,000
-
2025-12-12$235,000 Active
-
2024-01-23soldstatus $129,838
-
2014-07-07historical
-
2010-03-12$47,500
-
2005-01-25soldstatus $88,000
-
1995-01-23soldstatus $68,500
ⓘ Source: listings_history table (triggers on properties + properties_extension) + one-shot
backfill from property_details.listing_events for pre-trigger history.
Tax reassessment forecast NY · Partial reset (capped growth)
- Current annual tax
- $6,808 · $567/mo
- Projected year-2 tax
- $6,808 · $567/mo
- Expected delta
- $0/yr ($0/mo · 0.0%)
ⓘ Screening estimate from a state-policy table — verify with the county assessor before closing.
Climate risk First Street
- Flood 1/10 Low FEMA zone X (unshaded) · 0% chance over 30 yrs
- Wildfire 1/10 Low
- Heat 3/10 Moderate 7 d/yr ≥94°F today · 16 d/yr by 30 yrs out
- Wind 1/10 Low 0% chance of damaging wind over 30 yrs
- Air quality 2/10 Low 0 unhealthy d/yr today · 1 by 30 yrs out
Nearby sold comps map
Loading sold comps map…
Walkable amenities ~0.75 mi
Loading nearby amenities…
Taxation est. · year 1
- Rental income
- $22,800
- − Mortgage interest
- −$11,763
- − Property taxes
- −$6,808
- − Insurance
- −$1,050
- − Repairs & maintenance
- −$1,824
- − Management
- −$1,824
- − Depreciation
- −$6,109
- Taxable loss
- −$6,579
- Est. tax savings @ 24.0%
- +$1,579
- After-tax cash flow
- $-1,483/yr
For passive investors: Depreciation is non-cash, so a rental often shows a tax loss while cash-flowing — sheltering income. Rental losses are passive: they offset passive income freely, and up to $25,000/yr can offset ordinary (W-2) income if you actively participate and your MAGI is under $100k (phasing out to $0 by $150k); unused losses carry forward. On sale, claimed depreciation is recaptured at up to 25%, and gains may owe capital-gains tax (a 1031 exchange can defer both). Figures are a year-1 estimate at your 24.0% rate — not tax advice; consult a CPA.
Schools (NCES district)
- District
- Fayetteville-Manlius Central School District
- NCES district ID
- 3618330
- Math proficiency
- 79% ▼ -5.00%
- Reading proficiency
- 81% ▲ 7.00%
- Median HH income
- $86,156
- Composite
- 71.12/100
- National rank
- #238
- State rank
- #49 of 590 in NY
Livability — Fayetteville
- Score
- 82/100
- State rank
- #71
- US rank
- #1067
Category grades
Schools grade is shown separately in the Schools card above.
Census & demographics
- Census place
- Fayetteville, NY
- City population
- 12,680
- Population (ZIP)
- 12,680
Population outlook (Onondaga County) Hauer SSP2
- Today (2025)
- 467,894 people
- By 2030
- 463,381 · -1.0%
- By 2040
- 447,697 · -4.3%
- By 2050
- 426,399 · -8.9%
- By 2075
- 373,661 · -20.1%
- By 2100
- 307,967 · -34.2%
Race, ethnicity, and origin ACS 2023
- Neighborhood character
- Predominantly White (88%)
- Race & ethnicity
- White 88% Two or more races 4% Hispanic / Latino 3% Asian 3% Black 2%
- Common ancestry
- Romanian 5% Scotch-Irish 3% Lithuanian 3%
- Foreign-born
- 7% · Canada, China
- Languages at home
- 92% English-only · Other Indo-European 2% Chinese 2% Spanish 1%
Political lean MEDSL · Onondaga
- 2024 margin
- D (+17.3) · D 58.6% · R 41.4%
- 2008→2024 swing
- -3.0pp toward R · 2008: 20.3pp · 2024: 17.3pp
- All cycles
- 2024: D+17.3 2020: D+20.6 2016: D+12.8 2012: D+21.1 2008: D+20.3
Not yet ingested
- Civics
- —
Market trends
- HPI YoY
- ▼ -124.65%
- Current HPI
- 319.9702
- Rent YoY
- —
- Metro
- —
- State GDP YoY
- ▲ 2.60%
- F500 in state
- 92
Industry mix (Fortune 500 HQ in NY)
| Industry | F500 HQs | Revenue |
|---|---|---|
| Financial Services | 10 | $950B |
|
||
| Consumer Goods | 9 | $162B |
|
||
| Insurance | 4 | $225B |
|
||
| Telecommunications | 2 | $144B |
|
||
| Pharmaceuticals | 2 | $112B |
|
||
| Media / Entertainment | 2 | $69B |
|
||
Price history
+206.6% since first listed13 events — show timeline
- 2026-06-08 Pending — CNYIS
- 2026-05-24 Price Changed $210,000 CNYIS
- 2026-05-01 Price Changed $218,000 CNYIS
- 2026-04-24 Listed $224,000 CNYIS
- 2026-04-14 Listing Removed — CNYIS
- 2026-02-11 Price Changed $224,000 CNYIS
- 2026-01-21 Price Changed $230,000 CNYIS
- 2025-12-12 Listed $235,000 CNYIS
- 2024-01-23 Sold (Public Records) $129,838 Public Records
- 2014-07-07 Listing Removed — CNYIS
- 2010-03-12 Listed $47,500 CNYIS
- 2005-01-25 Sold (Public Records) $88,000 Public Records
- 1995-01-23 Sold (Public Records) $68,500 Public Records
Property tax history
+4.1%/yrLatest (2025): $6,808 · +7.0% YoY. Source: county tax records.
Cash-flow waterfall
monthlySold comps — $/sqft
last 12 mo · ≤1 miLoading sold comps…