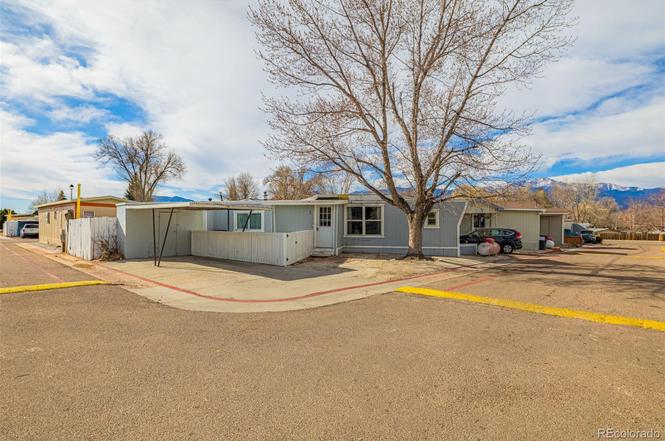
3303 N Hancock Ave · Colorado Springs, CO
Flood risk 1/10 · Minimal
- FEMA flood zone
- X
- Chance of flooding over 30 yrs
- 0.0%
- Est. flood insurance / yr
- $507 – $1,088
Fire risk 5/10 · Moderate
- Est. fire insurance / yr
- $939 – $1,743
Heat risk 2/10 · Minimal
- Hot days now (above 88°F)
- 7 days/yr
- Hot days in 30 yrs
- 19 days/yr
Wind risk 2/10 · Minimal
- Chance of severe wind over 30 yrs
- —
Air-quality risk 2/10 · Minimal
- Unhealthy air days now
- 0 days/yr
- Unhealthy air days in 30 yrs
- 1 days/yr
Risk factors via First Street. Map © Google.
Why this score? — see what drove the B- grade
The composite is a weighted blend of 9 inputs, each scored 0–100. Each bar is that input's sub-score; the figure is the points it added to the 100-point composite (weight × sub-score).
- Cash flow +30.0/30.0
- 1% rule +10.0/10.0
- DSCR +10.0/10.0
- ARV discount +7.5/15.0
- Livability +3.9/5.0
- Rent growth +2.5/5.0
- Schools +2.5/10.0
- Condition / age +2.5/5.0
- Appreciation +0.0/10.0
$60,000
🖨 Deal sheet (PDF) 📄 Offer letter ✓ Due diligence
Listing remarks
Welcome to this cozy 2-bedroom home, centrally located for easy access to shopping, dining, and everyday conveniences. Thoughtful upgrades add comfort and charm while preserving a warm, welcoming feel. Ideal for those seeking a comfortable home in a prime location. Extra parking, storage, and a fenced yard included!
Key facts
- Extra parking
- Easy access
- Thoughtful upgrades
Tags
Property features AI
Finance
- Financial info: Monthly land lease: $982; Land lease expiration: December 31, 2050
- HOA & community: Land lease in effect (Highland Park)
Exterior
- Parking: 2 parking spaces; 2-car carport with storage
- Utilities: Public water; Public sewer; Electricity connected; Propane service
- Home design: Manufactured home located in a park; Mobile home (Fleetwood), 56' x 12'; Single-story; Owned individually; Located in Highland Park
- Construction: Mobile home construction
- Exterior features: Private yard; Partial fencing
Interior
- Kitchen: Range; Refrigerator; Microwave; Garbage disposal
- Bedrooms: 2 bedrooms on the main level; Primary suite with en suite half bath
- Flooring: Laminate flooring throughout (wood-look)
- Bathrooms: 1 full bathroom (main level) with updated porcelain tile; 1 half bathroom (main level, en suite to primary)
- Heating & cooling: Forced air heating (propane); Cooling: Other
- Interior features: Ceiling fans; Eat-in kitchen; No stairs (single-level)
- Laundry & utility: Washer; Dryer; Main-level laundry room
Neighborhood map
What this means for you Summary
Snapshot
- This is a 2-bed/2.0-bath land listed at $60k.
Deal economics
- At list price, monthly cash flow is $874 ($10k/yr) — positive.
- The deal already cash-flows at list — no discount required.
- Meets the 1% rule at list price ($2k rent vs $60k).
- Recommended offer: $53k (12.0% below list) — sets the bar for market timing.
- Cap rate 23.8% vs local median 3.3% in Colorado Springs — top-decile yield for the area; either an underpriced asset or a hidden risk that comps aren't pricing in. Stress-test before assuming the spread holds.
Location & tenants
- Location reads 78/100 on livability (#23 in CO, #2,639 nationally) — a middle-class / working-renter tenant base. Strengths: amenities A+, housing A+, health & safety A+; Watch: cost of living C-, crime F.
- Colorado Springs School District No. 11 In The County Of E (urban): math 20% / reading 37% proficiency, ranked #56 of 86 in CO (top 65%) — low school quality limits family demand, transient renter base, plan for 1-2y turnover.
- Zoned schools: Edison Elementary School (math 30% / reading 37%, grade F, #454 of 966 statewide, top 47%, 263 students, 77% FRL); Mann Middle School (math 12% / reading 27%, grade F, #207 of 270 statewide, top 79%, 387 students, 67% FRL); Doherty High School (math 26% / reading 49%, grade F, #192 of 381 statewide, top 51%, 1,832 students, 44% FRL).
- Market conditions: Rents flat; 195 active listings in the ZIP; 20 comparable units currently listed for rent nearby; rentals at typical pace (median 16d on market — plan ~3-4 weeks tenant-placement turnaround); 3,906 units permitted in El Paso County in 2024 (872 in 5+ unit buildings).
Forward outlook
- Local home prices are declining (-3.0%/yr); year-one equity from $415 of loan paydown is wiped out by about $2k of value loss. Plan a longer hold.
- El Paso County population projected at +28% by 2050 — long-run rental-demand tailwind backs the buy-and-hold thesis.
- At projected returns (-3.0% appreciation + 0.1% rent growth), your $17k cash investment doubles in ~2 years — after that, you're playing with house money.
Negotiation context
- It's been on market 132 days — a 12% lower offer ($53k) is reasonable based on typical stale-listing flexibility.
- 6 sale attempts since 4y ago; this cycle's ask has dropped $5k (8%) from the opening price — seller is motivated, your offer sets the floor, not the list.
Risks & watch-outs
- Climate carrying-cost: moderate wildfire risk — expect insurance premiums to compound above CPI over the hold.
Questions for the listing agent
- It's been on market 132 days. Have you received any prior offers? Is the seller open to a 12% concession, seller financing, or rate buy-down credit?
- Built in 1968 — when were the roof, HVAC, electrical panel, plumbing, and water heater last replaced?
- Why hasn't it sold? Are there any deal-killer items the seller is aware of (foundation, flood, title, zoning, code violations)?
- Is there a deadline driving the sale (1031 exchange, divorce, estate, relocation)? That informs how much negotiation room exists.
- Schools are B-rated — typically a magnet for longer-tenancy family renters. What's the average tenant stay here, and is there a school-zone premium baked into asking?
- Crime grade is F in this area — have there been break-ins, vandalism, or insurance claims at this property in the last 3 years? What carrier currently insures it and at what premium?
- What's the average days-on-market for RENTAL listings here right now (not sales)? A rising rental-DOM trend means longer vacancies and softer asking-rent achievability than the comps imply.
- What's the recent tenant-quality profile in this submarket — average credit score on applications, eviction rate, late-payment / NSF rate, and stable-employment percentage? A property-management company in the area should have these aggregated.
- How much new for-sale + rental construction is in the pipeline within 1–3 miles? Heavy new supply typically softens prices + rents 12–24 months out; constrained supply supports both.
Investment metrics
- 1% rule
- 2.72% ✓
- Cap rate
- 23.78%
- Cash-on-cash
- 62.46%
- DSCR
- 3.78
- GRM
- 3.1
CMA / ARV
No comps found within radius.
Projected returns pro-forma
-3.0% appreciation · 0.11% rent growth · sell at horizon
- IRR
- 58.1%
- Equity multiple
- 3.46×
- Total profit
- $41,385
- Equity at exit
- $8,946
- IRR
- 61.9%
- Equity multiple
- 6.36×
- Total profit
- $89,991
- Equity at exit
- $5,188
Cash invested: $16,800 (down + closing). Projections, not guarantees.
Landlord ↔ Tenant lean methodology
- Overall (STATE)
- 38 Tenant-Leaning
- State Colorado
- 38 Tenant-Leaning · D+4
- County
- — inherits STATE
- City
- — inherits STATE
ZIP-level market 80907
- Rents YoY
- 0.1%
- Active inventory
- 195
- Price-to-rent
- 3.1×
Monthly cashflow live
- Estimated rent
- $1,632 high interval (Pro) →
- Mortgage (P&I)
- −$315
- Tax est. 1.5%
- −$75 /mo · $900/yr
- Insurance
- −$25
- HOA
- −$0
- Vacancy / Maint / Mgmt
- −$343
- Net cashflow
- $874
Break-even live
Sensitivity live
| Price | -10% $916 | -5% $895 | +0% $874 | +5% $854 | +10% $833 |
|---|---|---|---|---|---|
| Rent | -10% $746 | -5% $810 | +0% $874 | +5% $939 | +10% $1,003 |
| Rate | -1.0pp $905 | -0.5pp $890 | base $874 | +0.5pp $859 | +1.0pp $843 |
UW: 25.0% down · 7.5% · 30yr · 1.5% tax · 5.0% vac · 8.0% maint · 8.0% mgmt
Financing live
Cash to close
- Down payment
- $15,000
- Closing costs
- $1,800
- Reserves months
- —
- Total cash needed
- —
Loan-product check · same deal, 3 products live
Conventional
25% down · 7.5% · 30yr
- Down + closing
- —
- Monthly P&I
- —
- Monthly cashflow
- —
- DSCR
- —
- Eligible?
- —
Personal DTI + credit; lowest rate.
DSCR
20% down · 8.5% · 30yr
- Down + closing
- —
- Monthly P&I
- —
- Monthly cashflow
- —
- DSCR
- —
- Eligible?
- —
No personal income docs; deal must DSCR.
Hard money
10% down · 12.0% · 12mo
- Down + closing
- —
- Monthly P&I
- —
- Monthly cashflow
- —
- DSCR
- —
- Eligible?
- —
Short-term bridge; refi at stabilization.
Rent comps 20 comps
| Address | Beds | Baths | Sqft | Rent | $/sqft | DOM | Units | Dist |
|---|---|---|---|---|---|---|---|---|
| 1170 Westmoreland Rd Colorado Springs, CO | 2.0 | 1.0 | 900 | $1,250 | $1.39 | 25d | 1 | 0.47mi |
| 906 1/2 Carlisle St Colorado Springs, CO | 2.0 | 1.0 | 1128 | $1,245 | $1.10 | 25d | 1 | 0.48mi |
| 3820 Meadow Ln Colorado Springs, CO | 3.0 | 1.0 | 1198 | $1,600 | $1.34 | 16d | 1 | 0.58mi |
| 1075 Magnolia St Apt 3 Colorado Springs, CO | 2.0 | 1.0 | 900 | $845 | $0.94 | 5d | 1 | 0.59mi |
| 1075 Magnolia St Apt 1 Colorado Springs, CO | 2.0 | 1.0 | 900 | $795 | $0.88 | 5d | 1 | 0.59mi |
| 3750 Catalpa Dr Colorado Springs, CO | 3.0 | 2.0 | 1352 | $2,095 | $1.55 | 25d | 1 | 0.62mi |
| 6715 N Century St Colorado Springs, CO | 1.0–3.0 | 1.0–2.0 | 1043 | $2,105 | $2.02 | 4d | 26 | 0.75mi |
| 10 Cragmor Village Rd Colorado Springs, CO | 1.0–4.0 | 1.0–4.0 | 979 | $2,011 | $2.05 | 5d | 1 | 0.84mi |
| 4012 Muse Way Colorado Springs, CO | 2.0 | 1.5 | 1124 | $1,598 | $1.42 | 25d | 1 | 0.92mi |
| 2608 Jay Pl Colorado Springs, CO | 3.0 | 1.0 | 1025 | $1,980 | $1.93 | 5d | 1 | 0.94mi |
| 4033 Muse Way Colorado Springs, CO | 2.0 | 1.5 | 1121 | $1,500 | $1.34 | 25d | 1 | 0.96mi |
| 1921 E Van Buren St Colorado Springs, CO | 1.0–3.0 | 1.0 | 825 | $1,388 | $1.68 | 5d | 10 | 1.14mi |
| 2524 N Weber St Colorado Springs, CO | 3.0 | 1.0 | 1242 | $2,700 | $2.17 | 25d | 1 | 1.17mi |
| 1141 E Madison St Colorado Springs, CO | 3.0 | 1.0 | 960 | $1,925 | $2.01 | 5d | 1 | 1.22mi |
| 2822 N Cascade Ave Unit 2824 Colorado Springs, CO | 2.0 | 2.0 | 1032 | $1,995 | $1.93 | 16d | 1 | 1.24mi |
| 2020 N Franklin St Colorado Springs, CO | 3.0 | 1.0 | 1100 | $1,795 | $1.63 | 25d | 1 | 1.32mi |
| 2232 N Weber St Apt E Colorado Springs, CO | 2.0 | 1.0 | 884 | $1,295 | $1.46 | 16d | 1 | 1.37mi |
| 2230 N Weber St Apt E Colorado Springs, CO | 2.0 | 1.0 | 884 | $1,295 | $1.46 | 5d | 1 | 1.37mi |
| 2544 Blazek Loop Colorado Springs, CO | 2.0 | 3.0 | 1088 | $2,500 | $2.30 | 25d | 1 | 1.41mi |
| 2446 Blazek Loop Colorado Springs, CO | 2.0 | 3.0 | 1267 | $1,818 | $1.43 | 25d | 1 | 1.43mi |
Listing history 38 events
-
2026-06-22days on market $60,000 Active 132 DOM
-
2026-06-18days on market $60,000 Active 129 DOM
-
2026-06-17days on market $60,000 Active 128 DOM
-
2026-06-16days on market $60,000 Active 127 DOM
-
2026-06-15days on market $60,000 Active 126 DOM
-
2026-06-14days on market $60,000 Active 124 DOM
-
2026-06-10days on market $60,000 Active 121 DOM
-
2026-06-09days on market $60,000 Active 120 DOM
-
2026-06-08days on market $60,000 Active 119 DOM
-
2026-06-07days on market $60,000 Active 118 DOM
-
2026-06-05days on market $60,000 Active 115 DOM
-
2026-06-03days on market $60,000 Active 114 DOM
-
2026-06-03days on market $60,000 Active 113 DOM
-
2026-06-01days on market $60,000 Active 112 DOM
-
2026-05-31days on market $60,000 Active 111 DOM
-
2026-05-17price $60,000
-
2026-03-31historical
-
2026-02-09$65,000 Active
-
2026-01-05price $74,900
-
2025-10-23price $80,000
-
2025-09-13$95,000 Active
-
2024-07-22historical
-
2024-06-06$115,000 Active
-
2024-05-31historical
-
2024-04-22$125,000 Active
-
2022-07-13soldstatus $78,000 Closed
-
2022-05-18status Pending
-
2022-05-06status Active
-
2022-05-04status Pending
-
2022-04-29$100,000 Active
-
2022-04-28historical $100,000
-
2005-04-25soldstatus $2,490,000
-
1997-05-27soldstatus $8,500
-
1996-05-13soldstatus $999,999
-
1994-07-15soldstatus $9,000
-
1986-07-01soldstatus $745,500
-
1983-09-01soldstatus $745,500
-
1979-08-06soldstatus $999,999
ⓘ Source: listings_history table (triggers on properties + properties_extension) + one-shot
backfill from property_details.listing_events for pre-trigger history.
Climate risk First Street
- Flood 1/10 Low FEMA zone X · 0% chance over 30 yrs
- Wildfire 5/10 Major
- Heat 2/10 Low 7 d/yr ≥88°F today · 19 d/yr by 30 yrs out
- Wind 2/10 Low
- Air quality 2/10 Low 0 unhealthy d/yr today · 1 by 30 yrs out
Nearby sold comps map
Loading sold comps map…
Walkable amenities ~0.75 mi
Loading nearby amenities…
Taxation est. · year 1
- Rental income
- $19,581
- − Mortgage interest
- −$3,361
- − Property taxes
- −$900
- − Insurance
- −$300
- − Repairs & maintenance
- −$1,566
- − Management
- −$1,566
- − Depreciation
- −$1,745
- Taxable income
- $10,142
- Est. tax owed @ 24.0%
- −$2,434
- After-tax cash flow
- $8,059/yr
For passive investors: Depreciation is non-cash, so a rental often shows a tax loss while cash-flowing — sheltering income. Rental losses are passive: they offset passive income freely, and up to $25,000/yr can offset ordinary (W-2) income if you actively participate and your MAGI is under $100k (phasing out to $0 by $150k); unused losses carry forward. On sale, claimed depreciation is recaptured at up to 25%, and gains may owe capital-gains tax (a 1031 exchange can defer both). Figures are a year-1 estimate at your 24.0% rate — not tax advice; consult a CPA.
Schools (NCES district)
- District
- Colorado Springs School District No. 11 In The County Of E
- NCES district ID
- 0803060
- Math proficiency
- 20% ▼ -8.00%
- Reading proficiency
- 37% ▼ -4.00%
- Median HH income
- $47,884
- Composite
- 24.69/100
- National rank
- #7613
- State rank
- #56 of 86 in CO
Livability — Colorado Springs
- Score
- 78/100
- State rank
- #23
- US rank
- #2639
Category grades
Schools grade is shown separately in the Schools card above.
Census & demographics
- Census place
- Colorado Springs, CO
- County
- El Paso County · 689,348 people
- City population
- 555,783
- Metro
- Colorado Springs, CO
- Population (ZIP)
- 27,815
- Household income
- $74,402
- Rent vs Own
- Severe rent burden
- 1396.0
Population outlook (El Paso County) Hauer SSP2
- Today (2025)
- 768,926 people
- By 2030
- 815,739 · +6.1%
- By 2040
- 903,489 · +17.5%
- By 2050
- 981,204 · +27.6%
- By 2075
- 1,155,542 · +50.3%
- By 2100
- 1,202,070 · +56.3%
Race, ethnicity, and origin ACS 2023
- Neighborhood character
- Predominantly White (77%)
- Race & ethnicity
- White 77% Hispanic / Latino 12% Two or more races 10% Black 3% Asian 2%
- Hispanic origin (detail)
- Mexican 8%
- Common ancestry
- Italian 3% Lithuanian 3% Slovak 3%
- Foreign-born
- 5% · Canada
- Languages at home
- 93% English-only · Spanish 4% German/W. Germanic 1%
Political lean MEDSL · El Paso
- 2024 margin
- Lean R (+9.8) · D 43.8% · R 53.5% · Other 2.7%
- 2008→2024 swing
- +9.0pp toward D · 2008: -18.8pp · 2024: -9.8pp
- All cycles
- 2024: R+9.8 2020: R+10.8 2016: R+22.6 2012: R+21.4 2008: R+18.8
Not yet ingested
- Civics
- —
Market trends
- HPI YoY
- ▼ -544.07%
- Current HPI
- 276.2139
- Rent YoY
- ▲ 0.11%
- Metro
- Colorado Springs, CO
- State GDP YoY
- ▲ 1.95%
- F500 in state
- 14
Industry mix (Fortune 500 HQ in CO)
| Industry | F500 HQs | Revenue |
|---|---|---|
| Technology Distribution | 1 | $31B |
|
||
| Food / Agriculture | 1 | $18B |
|
||
| Packaging | 1 | $14B |
|
||
| Healthcare | 1 | $13B |
|
||
| Energy | 1 | $10B |
|
||
| Technology | 1 | $4B |
|
||
Price history
-94.0% since first listed23 events — show timeline
- 2026-05-17 Price Changed $60,000 REColorado as Distributed by MLS Grid
- 2026-03-31 Listing Removed — REColorado as Distributed by MLS Grid
- 2026-02-09 Listed $65,000 REColorado as Distributed by MLS Grid
- 2026-01-05 Price Changed $74,900 REColorado as Distributed by MLS Grid
- 2025-10-23 Price Changed $80,000 REColorado as Distributed by MLS Grid
- 2025-09-13 Listed $95,000 REColorado as Distributed by MLS Grid
- 2024-07-22 Listing Removed — REColorado as Distributed by MLS Grid
- 2024-06-06 Listed $115,000 REColorado as Distributed by MLS Grid
- 2024-05-31 Listing Removed — REColorado as Distributed by MLS Grid
- 2024-04-22 Listed $125,000 REColorado as Distributed by MLS Grid
- 2022-07-13 Sold (MLS) $78,000 REColorado as Distributed by MLS Grid
- 2022-05-18 Pending — REColorado as Distributed by MLS Grid
- 2022-05-06 Relisted — REColorado as Distributed by MLS Grid
- 2022-05-04 Pending — REColorado as Distributed by MLS Grid
- 2022-04-29 Listed $100,000 REColorado as Distributed by MLS Grid
- 2022-04-28 Coming Soon $100,000 REColorado as Distributed by MLS Grid
- 2005-04-25 Sold (Public Records) $2,490,000 Public Records
- 1997-05-27 Sold (Public Records) $8,500 Public Records
- 1996-05-13 Sold (Public Records) $999,999 Public Records
- 1994-07-15 Sold (Public Records) $9,000 Public Records
- 1986-07-01 Sold (Public Records) $745,500 Public Records
- 1983-09-01 Sold (Public Records) $745,500 Public Records
- 1979-08-06 Sold (Public Records) $999,999 Public Records
Property tax history
-3.8%/yrLatest (2024): $9,086 · +1.0% YoY. Source: county tax records.
Cash-flow waterfall
monthlySold comps — $/sqft
last 12 mo · ≤1 miLoading sold comps…