 Fourplex
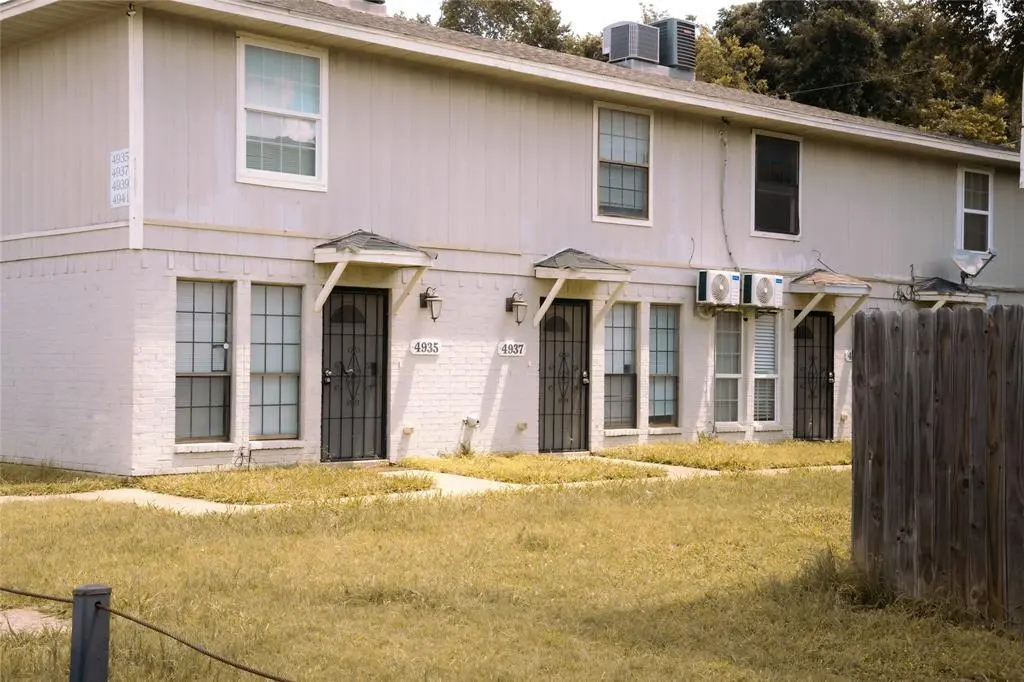
4935 Miller Ave · Fort Worth, TX
Flood risk 1/10 · Minimal
- FEMA flood zone
- X (unshaded)
- Chance of flooding over 30 yrs
- 0.0%
- Est. flood insurance / yr
- $507 – $1,088
Fire risk 1/10 · Minimal
- Est. fire insurance / yr
- $1,222 – $2,270
Heat risk 7/10 · Major
- Hot days now (above 110°F)
- 7 days/yr
- Hot days in 30 yrs
- 23 days/yr
Wind risk 5/10 · Moderate
- Chance of severe wind over 30 yrs
- 26.0%
Air-quality risk 3/10 · Minor
- Unhealthy air days now
- 3 days/yr
- Unhealthy air days in 30 yrs
- 4 days/yr
Risk factors via First Street. Map © Google.
Why this score? — see what drove the C grade
The composite is a weighted blend of 9 inputs, each scored 0–100. Each bar is that input's sub-score; the figure is the points it added to the 100-point composite (weight × sub-score).
- Cash flow +22.3/30.0
- ARV discount +10.0/15.0
- DSCR +7.1/10.0
- 1% rule +6.4/10.0
- Livability +4.0/5.0
- Condition / age +2.5/5.0
- Rent growth +2.1/5.0
- Schools +2.0/10.0
- Appreciation +0.0/10.0
$448,000
🖨 Deal sheet (PDF) 📄 Offer letter ✓ Due diligence
Multi-family units
County records classify this as Multi-Family (2-4 Unit). Listing-text estimate: 4 units. confirmed
Listing remarks MLS
An invaluable addition to any investment portfolio, this quadruplex presents an exceptional opportunity. Comprising four units, each with two bedrooms, one full bath, and one half bath, it offers versatility and promise. With approximately 780 sqft per unit, with the average market value rent approximately at $1,100 per month. Conveniently located near public transportation, shopping, and dining, it appeals to tenants seeking comfort and convenience. Expect long-term capital appreciation, with potential rent increases for stable and profitable returns. Approved for Section 8 and professionally managed, this quadruplex promises a hassle-free investment. Don't miss out on these thriving properties for your portfolio!
Key facts
- Four separate units
- Shopping
- Conveniently located
Tags
Property features AI
Finance
- Other: Property type: Residential income (quadruplex); Number of buildings: 1; Total units: 4; Building area (public records): 3,120; Lot size: 0.191 acres; Parcel number: 05843111
- Financial info: Gross annual income: $62,400; Gross annual expenses: $10,000; Insurance expense: $6,291; Net operating income: $50,000; Capitalization rate: 11.16%; Acceptable financing: Cash or Conventional
- HOA & community: No association
Exterior
- Parking: 4 parking spaces
- Utilities: City water; City sewer; No municipal utility district
- Home design: Residential income property (quadruplex); One-story; Complex: Couch JT; Subdivision: Couch J T Add
- Construction: Brick construction; Composition roof; Slab foundation; Built in 1986
- Exterior features: Parking lot; City water; City sewer
Interior
- Kitchen: Dishwasher; Disposal; Microwave
- Flooring: Tile flooring
- Heating & cooling: Electric heating; Electric cooling
- Interior features: Cable TV available; High-speed internet available; One level
Neighborhood map
What this means for you Summary
Snapshot
- This is a 4 × 2-bed/1.5-bath units multifamily listed at $448k.
Deal economics
- At list price, monthly cash flow is $734 ($9k/yr) — positive. Per door: $184/mo.
- The deal already cash-flows at list — no discount required.
- Meets the 1% rule at list price ($5k rent vs $448k).
- Recommended offer: $441k (1.5% below list) — sets the bar for market timing.
- Cap rate 8.3% vs local median 3.9% in Fort Worth — top-decile yield for the area; either an underpriced asset or a hidden risk that comps aren't pricing in. Stress-test before assuming the spread holds.
Location & tenants
- Location reads 80/100 on livability (#49 in TX, #1,954 nationally) — a professional / high-income tenant draw. Strengths: amenities A+, cost of living A+, housing A+; Watch: crime F.
- Fort Worth ISD (urban): math 18% / reading 28% proficiency, ranked #742 of 826 in TX (top 90%) — low school quality limits family demand, transient renter base, plan for 1-2y turnover; 73% free/reduced lunch — lower-income household profile, screen leases tightly.
- Zoned schools: W M Green El (math 10% / reading 23%, grade F, #3,946 of 4,322 statewide, top 92%, 564 students, 96% FRL) — zoned schools average 96% FRL vs 73% district-wide (23 pts higher); higher-poverty schools than district average — tighter screening recommended.
- Market conditions: Rents soft (-1.6%/yr); 187 active listings in the ZIP; 18,938 units permitted in Tarrant County in 2024 (8,336 in 5+ unit buildings).
- At $5,106/mo this rent would consume 120% of the median local household income ($51k/yr) (locally 2221% of renters already pay >50% of income on rent) — very limited rent-growth headroom before tenants either downsize or default.
Forward outlook
- Local home prices are declining (-3.0%/yr); year-one equity from $3k of loan paydown is wiped out by about $13k of value loss. Plan a longer hold.
- Tarrant County population projected at +41% by 2050 — long-run rental-demand tailwind backs the buy-and-hold thesis.
Negotiation context
- It's been on market 24 days — a 2% lower offer ($441k) is reasonable based on typical stale-listing flexibility.
- 12 sale attempts since 20y ago with the ask held roughly flat each time — persistent listings suggest the price (not the market) is what's stuck; bring a comps-based counter.
Risks & watch-outs
- Climate carrying-cost: moderate wind risk, 26% chance of damaging wind over 30y; extreme-heat days projected 7→23/yr by 2055 (HVAC capex compounding) — expect insurance premiums to compound above CPI over the hold.
Questions for the listing agent
- Can we see the unit-by-unit rent roll, current vacancy, and any below-market leases? What's the average tenancy length?
- What capital expenditures (roof, boiler, parking lot, exteriors) have been made in the last 5 years, and what's planned in the next 2?
- Is there a deadline driving the sale (1031 exchange, divorce, estate, relocation)? That informs how much negotiation room exists.
- Schools are D-rated, which usually means shorter tenancies and higher turnover. Who's the typical renter profile here, and what's been the actual vacancy rate?
- Crime grade is F in this area — have there been break-ins, vandalism, or insurance claims at this property in the last 3 years? What carrier currently insures it and at what premium?
- What's the average days-on-market for RENTAL listings here right now (not sales)? A rising rental-DOM trend means longer vacancies and softer asking-rent achievability than the comps imply.
- What's the recent tenant-quality profile in this submarket — average credit score on applications, eviction rate, late-payment / NSF rate, and stable-employment percentage? A property-management company in the area should have these aggregated.
- How much new apartment / multifamily construction is in the pipeline within 1–3 miles? Heavy new supply (>2% of stock underway) typically softens rents 12–24 months out; light construction supports rent growth.
Investment metrics
- 1% rule
- 1.14% ✓
- Cap rate
- 8.26%
- Cash-on-cash
- 7.03%
- DSCR
- 1.31
- GRM
- 7.3
CMA / ARV
- ARV (on-the-fly)
- $474,240
- Comps found
- 2
Show comp detail 2 sales within ~0.75 mi
| Address | Dist | Beds/Ba | Sqft | Sold | Price | $/sf | Match |
|---|---|---|---|---|---|---|---|
| 4927 Miller Ave | 0.01mi | 8/6.0 | 3,120 (0%) | 10mo | $451,000 | $145 | 83 |
| 4935 Miller Ave | 0.00mi | 8/12.0 | 3,120 (0%) | 22mo | $475,000 | $152 | 62 |
Match score weights: distance 35% · size 25% · config 20% · recency 20%. Top-matched comps best support the ARV.
Projected returns pro-forma
-3.0% appreciation · 0.0% rent growth · sell at horizon
- IRR
- -9.1%
- Equity multiple
- 0.68×
- Total profit
- $-40,579
- Equity at exit
- $66,798
- IRR
- -4.5%
- Equity multiple
- 0.74×
- Total profit
- $-32,109
- Equity at exit
- $38,735
Cash invested: $125,440 (down + closing). Projections, not guarantees.
Landlord ↔ Tenant lean methodology
- Overall (STATE)
- 87 Strongly Landlord-Friendly
- State Texas
- 87 Strongly Landlord-Friendly · R+5
- County
- — inherits STATE
- City
- — inherits STATE
ZIP-level market 76119
- Home prices YoY
- -6.4%
- Rents YoY
- -1.6%
- Active inventory
- 187
- Price-to-rent
- 29.2×
Monthly cashflow live
- Estimated rent
- $5,106 high interval (Pro) →
- Mortgage (P&I)
- −$2,349
- Tax from tax record
- −$763 /mo · $9,159/yr
- Insurance
- −$187
- HOA
- −$0
- Vacancy / Maint / Mgmt
- −$1,072
- Net cashflow
- $734
Break-even live
Sensitivity live
| Price | -10% $988 | -5% $861 | +0% $734 | +5% $608 | +10% $481 |
|---|---|---|---|---|---|
| Rent | -10% $331 | -5% $533 | +0% $734 | +5% $936 | +10% $1,138 |
| Rate | -1.0pp $960 | -0.5pp $848 | base $734 | +0.5pp $618 | +1.0pp $500 |
4-unit breakdown (identical units grouped — click to expand)
| Units | Beds | Baths | Est. rent |
|---|---|---|---|
| 4× units | 2 | 1.5 | $5,108 |
| #1 | 2 | 1.5 | $1,277 |
| #2 | 2 | 1.5 | $1,277 |
| #3 | 2 | 1.5 | $1,277 |
| #4 | 2 | 1.5 | $1,277 |
| Total (4 units) | $5,106 | ||
UW: 25.0% down · 7.5% · 30yr · 1.5% tax · 5.0% vac · 8.0% maint · 8.0% mgmt
Financing live
Cash to close
- Down payment
- $112,000
- Closing costs
- $13,440
- Reserves months
- —
- Total cash needed
- —
Loan-product check · same deal, 3 products live
Conventional
25% down · 7.5% · 30yr
- Down + closing
- —
- Monthly P&I
- —
- Monthly cashflow
- —
- DSCR
- —
- Eligible?
- —
Personal DTI + credit; lowest rate.
DSCR
20% down · 8.5% · 30yr
- Down + closing
- —
- Monthly P&I
- —
- Monthly cashflow
- —
- DSCR
- —
- Eligible?
- —
No personal income docs; deal must DSCR.
Hard money
10% down · 12.0% · 12mo
- Down + closing
- —
- Monthly P&I
- —
- Monthly cashflow
- —
- DSCR
- —
- Eligible?
- —
Short-term bridge; refi at stabilization.
Listing history 46 events
-
2026-06-21days on market $448,000 Active 24 DOM
-
2026-06-18days on market $448,000 Active 21 DOM
-
2026-06-17days on market $448,000 Active 20 DOM
-
2026-06-16days on market $448,000 Active 19 DOM
-
2026-06-15days on market $448,000 Active 18 DOM
-
2026-06-13days on market $448,000 Active 16 DOM
-
2026-06-09days on market $448,000 Active 12 DOM
-
2026-06-08days on market $448,000 Active 11 DOM
-
2026-06-07days on market $448,000 Active 10 DOM
-
2026-06-04days on market $448,000 Active 7 DOM
-
2026-06-03days on market $448,000 Active 6 DOM
-
2026-06-02days on market $448,000 Active 5 DOM
-
2026-06-01days on market $448,000 Active 4 DOM
-
2026-05-31days on market $448,000 Active 3 DOM
-
2026-05-28$448,000 Active
-
2024-08-16soldstatus
-
2024-08-15soldstatus Closed 724-char remark
Show marketing remark (724 chars)
An invaluable addition to any investment portfolio, this quadruplex presents an exceptional opportunity. Comprising four units, each with two bedrooms, one full bath, and one half bath, it offers versatility and promise. With approximately 780 sqft per unit, with the average market value rent approximately at $1,100 per month. Conveniently located near public transportation, shopping, and dining, it appeals to tenants seeking comfort and convenience. Expect long-term capital appreciation, with potential rent increases for stable and profitable returns. Approved for Section 8 and professionally managed, this quadruplex promises a hassle-free investment. Don't miss out on these thriving properties for your portfolio!
-
2024-07-28status Pending 724-char remark
Show marketing remark (724 chars)
An invaluable addition to any investment portfolio, this quadruplex presents an exceptional opportunity. Comprising four units, each with two bedrooms, one full bath, and one half bath, it offers versatility and promise. With approximately 780 sqft per unit, with the average market value rent approximately at $1,100 per month. Conveniently located near public transportation, shopping, and dining, it appeals to tenants seeking comfort and convenience. Expect long-term capital appreciation, with potential rent increases for stable and profitable returns. Approved for Section 8 and professionally managed, this quadruplex promises a hassle-free investment. Don't miss out on these thriving properties for your portfolio!
-
2024-07-12status Active 724-char remark
Show marketing remark (724 chars)
An invaluable addition to any investment portfolio, this quadruplex presents an exceptional opportunity. Comprising four units, each with two bedrooms, one full bath, and one half bath, it offers versatility and promise. With approximately 780 sqft per unit, with the average market value rent approximately at $1,100 per month. Conveniently located near public transportation, shopping, and dining, it appeals to tenants seeking comfort and convenience. Expect long-term capital appreciation, with potential rent increases for stable and profitable returns. Approved for Section 8 and professionally managed, this quadruplex promises a hassle-free investment. Don't miss out on these thriving properties for your portfolio!
-
2024-06-11status Pending 724-char remark
Show marketing remark (724 chars)
An invaluable addition to any investment portfolio, this quadruplex presents an exceptional opportunity. Comprising four units, each with two bedrooms, one full bath, and one half bath, it offers versatility and promise. With approximately 780 sqft per unit, with the average market value rent approximately at $1,100 per month. Conveniently located near public transportation, shopping, and dining, it appeals to tenants seeking comfort and convenience. Expect long-term capital appreciation, with potential rent increases for stable and profitable returns. Approved for Section 8 and professionally managed, this quadruplex promises a hassle-free investment. Don't miss out on these thriving properties for your portfolio!
-
2024-05-26status Active 724-char remark
Show marketing remark (724 chars)
An invaluable addition to any investment portfolio, this quadruplex presents an exceptional opportunity. Comprising four units, each with two bedrooms, one full bath, and one half bath, it offers versatility and promise. With approximately 780 sqft per unit, with the average market value rent approximately at $1,100 per month. Conveniently located near public transportation, shopping, and dining, it appeals to tenants seeking comfort and convenience. Expect long-term capital appreciation, with potential rent increases for stable and profitable returns. Approved for Section 8 and professionally managed, this quadruplex promises a hassle-free investment. Don't miss out on these thriving properties for your portfolio!
-
2024-05-21historical Active Option Contract 724-char remark
Show marketing remark (724 chars)
An invaluable addition to any investment portfolio, this quadruplex presents an exceptional opportunity. Comprising four units, each with two bedrooms, one full bath, and one half bath, it offers versatility and promise. With approximately 780 sqft per unit, with the average market value rent approximately at $1,100 per month. Conveniently located near public transportation, shopping, and dining, it appeals to tenants seeking comfort and convenience. Expect long-term capital appreciation, with potential rent increases for stable and profitable returns. Approved for Section 8 and professionally managed, this quadruplex promises a hassle-free investment. Don't miss out on these thriving properties for your portfolio!
-
2024-05-10$475,000 Active 724-char remark
Show marketing remark (724 chars)
An invaluable addition to any investment portfolio, this quadruplex presents an exceptional opportunity. Comprising four units, each with two bedrooms, one full bath, and one half bath, it offers versatility and promise. With approximately 780 sqft per unit, with the average market value rent approximately at $1,100 per month. Conveniently located near public transportation, shopping, and dining, it appeals to tenants seeking comfort and convenience. Expect long-term capital appreciation, with potential rent increases for stable and profitable returns. Approved for Section 8 and professionally managed, this quadruplex promises a hassle-free investment. Don't miss out on these thriving properties for your portfolio!
-
2024-03-21historical $999
-
2024-02-07price $999
-
2023-12-23historical $1,050
-
2023-12-15price $1,050
-
2023-12-14price $1,050
-
2023-11-29$1,100
-
2023-10-18$1,100
-
2020-01-23status Active
-
2020-01-23historical
-
2019-12-09status Active
-
2019-12-09historical
-
2019-12-02historical Active Option Contract
-
2019-11-18status Active
-
2019-11-18historical Active Option Contract
-
2019-11-14$350,000 Active
-
2018-03-12soldstatus
-
2009-04-16soldstatus
-
2009-03-30historical
-
2009-02-20$120,000
-
2006-09-29soldstatus
-
2006-08-29historical
-
2006-06-08$127,000
-
1997-02-26soldstatus
ⓘ Source: listings_history table (triggers on properties + properties_extension) + one-shot
backfill from property_details.listing_events for pre-trigger history.
Tax reassessment forecast TX · Resets to sale price
- Current annual tax
- $9,159 · $763/mo
- Projected year-2 tax
- $9,159 · $763/mo
- Expected delta
- $0/yr ($0/mo · 0.0%)
ⓘ Screening estimate from a state-policy table — verify with the county assessor before closing.
Climate risk First Street
- Flood 1/10 Low FEMA zone X (unshaded) · 0% chance over 30 yrs
- Wildfire 1/10 Low
- Heat 7/10 Severe 7 d/yr ≥110°F today · 23 d/yr by 30 yrs out
- Wind 5/10 Major 26% chance of damaging wind over 30 yrs
- Air quality 3/10 Moderate 3 unhealthy d/yr today · 4 by 30 yrs out
Nearby sold comps map
Loading sold comps map…
Walkable amenities ~0.75 mi
Loading nearby amenities…
Taxation est. · year 1
- Rental income
- $61,272
- − Mortgage interest
- −$25,095
- − Property taxes
- −$9,159
- − Insurance
- −$2,240
- − Repairs & maintenance
- −$4,902
- − Management
- −$4,902
- − Depreciation
- −$13,033
- Taxable income
- $1,942
- Est. tax owed @ 24.0%
- −$466
- After-tax cash flow
- $8,348/yr
For passive investors: Depreciation is non-cash, so a rental often shows a tax loss while cash-flowing — sheltering income. Rental losses are passive: they offset passive income freely, and up to $25,000/yr can offset ordinary (W-2) income if you actively participate and your MAGI is under $100k (phasing out to $0 by $150k); unused losses carry forward. On sale, claimed depreciation is recaptured at up to 25%, and gains may owe capital-gains tax (a 1031 exchange can defer both). Figures are a year-1 estimate at your 24.0% rate — not tax advice; consult a CPA.
Schools (NCES district)
- District
- Fort Worth ISD
- NCES district ID
- 4819700
- Math proficiency
- 18% ▼ -16.00%
- Reading proficiency
- 28% ▼ -6.00%
- Median HH income
- $42,109
- Composite
- 19.61/100
- National rank
- #8753
- State rank
- #742 of 826 in TX
Livability — Fort Worth
- Score
- 80/100
- State rank
- #49
- US rank
- #1954
Category grades
Schools grade is shown separately in the Schools card above.
Census & demographics
- Census place
- Fort Worth, TX
- County
- Tarrant County · 2,033,669 people
- City population
- 911,619
- Metro
- Dallas-Fort Worth-Arlington, TX
- Population (ZIP)
- 52,974
- Household income
- $51,267
- Rent vs Own
- Severe rent burden
- 2221.0
Population outlook (Tarrant County) Hauer SSP2
- Today (2025)
- 2,380,417 people
- By 2030
- 2,578,900 · +8.3%
- By 2040
- 2,974,995 · +25.0%
- By 2050
- 3,350,489 · +40.8%
- By 2075
- 4,216,909 · +77.2%
- By 2100
- 4,741,527 · +99.2%
Race, ethnicity, and origin ACS 2023
- Neighborhood character
- Diverse neighborhood (Simpson 0.60)
- Race & ethnicity
- Hispanic / Latino 51% Black 36% Two or more races 26% White 8% Asian 3%
- Hispanic origin (detail)
- Mexican 44%
- Foreign-born
- 25% · Canada, Philippines
- Languages at home
- 54% English-only · Spanish 42% Other Indo-European 2% Other Asian/Pacific 1%
Political lean MEDSL · Tarrant
- 2024 margin
- Lean R (+5.1) · D 46.7% · R 51.9% · Other 1.4%
- 2008→2024 swing
- +6.6pp toward D · 2008: -11.7pp · 2024: -5.1pp
- All cycles
- 2024: R+5.1 2020: D+0.2 2016: R+8.7 2012: R+15.7 2008: R+11.7
Not yet ingested
- Civics
- —
Market trends
- HPI YoY
- ▼ -23.04%
- Current HPI
- 336.7941
- Rent YoY
- ▼ -1.61%
- Metro
- Dallas-Fort Worth-Arlington, TX
- State GDP YoY
- ▲ 3.95%
- F500 in state
- 110
Industry mix (Fortune 500 HQ in TX)
| Industry | F500 HQs | Revenue |
|---|---|---|
| Energy | 16 | $1,198B |
|
||
| Technology | 5 | $198B |
|
||
| Engineering / Construction | 4 | $72B |
|
||
| Energy Services | 3 | $60B |
|
||
| Utilities | 3 | $41B |
|
||
| Healthcare | 2 | $330B |
|
||
Price history
+252.8% since first listed32 events — show timeline
- 2026-05-28 Listed $448,000 NTREIS
- 2024-08-16 Sold (Public Records) — Public Records
- 2024-08-15 Sold (MLS) — NTREIS
- 2024-07-28 Pending — NTREIS
- 2024-07-12 Relisted — NTREIS
- 2024-06-11 Pending — NTREIS
- 2024-05-26 Relisted — NTREIS
- 2024-05-21 Contingent — NTREIS
- 2024-05-10 Listed $475,000 NTREIS
- 2024-03-21 Rental Removed $999 NTREIS
- 2024-02-07 Price Changed $999 NTREIS
- 2023-12-23 Rental Removed $1,050 RENT.
- 2023-12-15 Price Changed $1,050 RENT.
- 2023-12-14 Price Changed $1,050 NTREIS
- 2023-11-29 Listed for Rent $1,100 NTREIS
- 2023-10-18 Listed for Rent $1,100 RENT.
- 2020-01-23 Relisted — NTREIS
- 2020-01-23 Listing Removed — NTREIS
- 2019-12-09 Relisted — NTREIS
- 2019-12-09 Listing Removed — NTREIS
- 2019-12-02 Contingent — NTREIS
- 2019-11-18 Relisted — NTREIS
- 2019-11-18 Contingent — NTREIS
- 2019-11-14 Listed $350,000 NTREIS
- 2018-03-12 Sold (Public Records) — Public Records
- 2009-04-16 Sold (MLS) — NTREIS
- 2009-03-30 Listing Removed — NTREIS
- 2009-02-20 Listed $120,000 NTREIS
- 2006-09-29 Sold (MLS) — NTREIS
- 2006-08-29 Listing Removed — NTREIS
- 2006-06-08 Listed $127,000 NTREIS
- 1997-02-26 Sold (Public Records) — Public Records
Property tax history
+7.3%/yrLatest (2025): $9,159 · -4.8% YoY. Source: county tax records.
Cash-flow waterfall
monthlySold comps — $/sqft
last 12 mo · ≤1 miLoading sold comps…