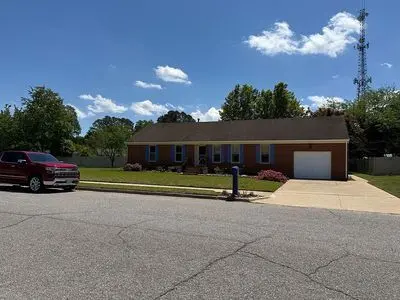
725 Luray Ter · Chesapeake, VA
Flood risk 1/10 · Minimal
- FEMA flood zone
- X (unshaded)
- Chance of flooding over 30 yrs
- 0.0%
- Est. flood insurance / yr
- $507 – $1,088
Fire risk 3/10 · Minor
- Est. fire insurance / yr
- $666 – $1,236
Heat risk 9/10 · Severe
- Hot days now (above 107°F)
- 7 days/yr
- Hot days in 30 yrs
- 16 days/yr
Wind risk 8/10 · Major
- Chance of severe wind over 30 yrs
- 80.0%
Air-quality risk 1/10 · Minimal
- Unhealthy air days now
- 0 days/yr
- Unhealthy air days in 30 yrs
- 0 days/yr
Risk factors via First Street. Map © Google.
Why this score? — see what drove the D grade
The composite is a weighted blend of 9 inputs, each scored 0–100. Each bar is that input's sub-score; the figure is the points it added to the 100-point composite (weight × sub-score).
- Cash flow +11.6/30.0
- ARV discount +11.0/15.0
- Schools +5.8/10.0
- Rent growth +3.6/5.0
- Livability +3.5/5.0
- DSCR +3.4/10.0
- 1% rule +2.7/10.0
- Condition / age +2.5/5.0
- Appreciation +0.0/10.0
$450,000
🖨 Deal sheet (PDF) 📄 Offer letter ✓ Due diligence
Listing remarks
IMMACULATE 4 BEDROOM RANCH IN DESIRABLE GREAT BRIDGE, CHEAPEAKE. THIS HOME PROVIDES A MODERN, OPEN FLOOR PLAN CONCEPT WITH VAULTED CEILINGS AND A MASSIVE EAT-IN KITCHEN WITH NEW STAINLESS STEEL APPLIANCES. REPLACEMENT VINYL, CLOSE TO SHOPPING, RESTAURANTS, ANIMAL CARE, HOSPITALS, AND HIGHWAY ACCESS IN ONE OF THE BEST SCHOOL DISTRICTS IN HAMPTON ROADS. CENTRAL TO ALL OF THE 757. THIS ALL BRICK HOME IS WELL BUILT, METICULOUSLY MAINTAINED, AND ABSOLUTELY MOVE-IN READY. A GREAT NEIGHBORHOOD FOR A GROWING FAMILY!
Key facts
- Garage
- Built 1987
- Listed 5 days
Property features AI
Exterior
- Home design: Built in 1987
- Construction: Living area approximately 1,912
- Exterior features: Located in the Great Bridge East subdivision
Neighborhood map
What this means for you Summary
Snapshot
- This is a 4-bed/2.0-bath single-family listed at $450k.
Deal economics
- At list price, monthly cash flow is $-139 ($-2k/yr) — negative.
- To cash-flow at today's rent, offer at most $425k (5.5% below list).
- To meet the 1% rule (rent ≥ 1% of price), the offer needs to be $348k (22.6% below list).
- Recommended offer: $348k (22.6% below list) — sets the bar for 1% rule.
- Cap rate 5.9% vs local median 3.7% in Chesapeake — top-decile yield for the area; either an underpriced asset or a hidden risk that comps aren't pricing in. Stress-test before assuming the spread holds.
Location & tenants
- Location reads 70/100 on livability (#236 in VA) — a middle-class / working-renter tenant base. Strengths: employment A+, housing A+; Watch: crime C-, cost of living C-, amenities F.
- Chesapeake City Public School District (suburban): math 58% / reading 74% proficiency, ranked #31 of 131 in VA (top 24%) — acceptable for families but not a draw, mixed tenant base, ~2y average lease.
- Zoned schools: Great Bridge Primary (701 students, 18% FRL); Great Bridge Middle (math 54% / reading 83%, grade A, #92 of 342 statewide, top 27%, 1,223 students, 16% FRL); Great Bridge High (math 60% / reading 87%, grade B+, #124 of 319 statewide, top 40%, 1,624 students, 25% FRL).
- Market conditions: Rents rising fast (+4.5%/yr); 599 active listings in the ZIP; 3 comparable units currently listed for rent nearby; rentals at typical pace (median 23d on market — plan ~3-4 weeks tenant-placement turnaround); high-income renter base; 597 units permitted in Chesapeake city in 2024 (0 in 5+ unit buildings).
- This rent runs 31% of the median local income ($135k/yr) — at the standard rent-burdened threshold; future hikes will face affordability resistance.
Forward outlook
- Local home prices are declining (-3.0%/yr); year-one equity from $3k of loan paydown is wiped out by about $14k of value loss. Plan a longer hold.
- Chesapeake County population projected at +21% by 2050 — long-run rental-demand tailwind backs the buy-and-hold thesis.
Negotiation context
- Only 5 days on market — expect competitive offers; lowballing is unlikely to land.
- Current owner paid $93k; list at $450k implies a 384% gain — meaningful room to come down on a strong offer.
Risks & watch-outs
- Climate carrying-cost: severe wind risk, 80% chance of damaging wind over 30y; extreme-heat days projected 7→16/yr by 2055 (HVAC capex compounding) — expect insurance premiums to compound above CPI over the hold.
Questions for the listing agent
- What do current leases actually rent for vs. the listed asking? Can we see a recent rent roll and the last 12 months of T-12 income?
- Is there a deadline driving the sale (1031 exchange, divorce, estate, relocation)? That informs how much negotiation room exists.
- Schools are A-rated — typically a magnet for longer-tenancy family renters. What's the average tenant stay here, and is there a school-zone premium baked into asking?
- The area grade is low — what's the realistic commute time and amenity access for the typical tenant pool here? Any planned neighborhood developments (good or bad) we should know about?
- What's the average days-on-market for RENTAL listings here right now (not sales)? A rising rental-DOM trend means longer vacancies and softer asking-rent achievability than the comps imply.
- What's the recent tenant-quality profile in this submarket — average credit score on applications, eviction rate, late-payment / NSF rate, and stable-employment percentage? A property-management company in the area should have these aggregated.
- How much new for-sale + rental construction is in the pipeline within 1–3 miles? Heavy new supply typically softens prices + rents 12–24 months out; constrained supply supports both.
Investment metrics
- 1% rule
- 0.77% ✗
- Cap rate
- 5.92%
- Cash-on-cash
- -1.33%
- DSCR
- 0.94
- GRM
- 10.8
CMA / ARV
- ARV (on-the-fly)
- $487,560
- Comps found
- 12
Show comp detail 12 sales within ~0.75 mi
| Address | Dist | Beds/Ba | Sqft | Sold | Price | $/sf | Match |
|---|---|---|---|---|---|---|---|
| 605 Resh Ct | 0.09mi | 4/2.0 | 1,904 (-0%) | 2mo | $485,000 | $255 | 93 |
| 533 Scarborough Dr | 0.36mi | 4/2.0 | 1,900 (-1%) | 4mo | $500,000 | $263 | 79 |
| 627 Luray Ter | 0.21mi | 4/3.5 | 1,973 (+3%) | 0mo | $490,000 | $248 | 79 |
| 624 Luray Ter | 0.21mi | 4/2.0 | 1,793 (-6%) | 4mo | $485,000 | $270 | 76 |
| 316 Melonie Ct | 0.07mi | 4/2.0 | 1,716 (-10%) | 5mo | $385,000 | $224 | 76 |
| 125 Millwood Ave | 0.33mi | 4/2.0 | 1,742 (-9%) | 1mo | $452,555 | $260 | 70 |
| 601 Warren Ave | 0.49mi | 4/3.0 | 2,000 (+5%) | 0mo | $535,000 | $268 | 65 |
| 505 Scarborough Dr | 0.47mi | 3/2.0 (-1) | 1,713 (-10%) | 1mo | $410,000 | $239 | 55 |
| 412 Warhawks Rd | 0.62mi | 4/2.0 | 1,750 (-8%) | 3mo | $480,000 | $274 | 55 |
| 304 Spurlane Cir | 0.54mi | 4/2.5 | 2,125 (+11%) | 2mo | $495,000 | $233 | 53 |
| 318 Gallenway Ter | 0.72mi | 4/2.0 | 1,780 (-7%) | 6mo | $450,000 | $253 | 50 |
| 400 Beauregard Dr | 0.69mi | 5/3.5 (+1) | 2,169 (+13%) | 1mo | $540,000 | $249 | 34 |
Match score weights: distance 35% · size 25% · config 20% · recency 20%. Top-matched comps best support the ARV.
Projected returns pro-forma
-3.0% appreciation · 4.46% rent growth · sell at horizon
- IRR
- -17.0%
- Equity multiple
- 0.39×
- Total profit
- $-76,679
- Equity at exit
- $67,096
- IRR
- -6.6%
- Equity multiple
- 0.55×
- Total profit
- $-56,589
- Equity at exit
- $38,908
Cash invested: $126,000 (down + closing). Projections, not guarantees.
Landlord ↔ Tenant lean methodology
- Overall (STATE)
- 55 Moderately Landlord-Leaning
- State Virginia
- 55 Moderately Landlord-Leaning · D+2
- County
- — inherits STATE
- City
- — inherits STATE
ZIP-level market 23322
- Rents YoY
- 4.5%
- Active inventory
- 599
- Price-to-rent
- 10.8×
Monthly cashflow live
- Estimated rent
- $3,481 medium interval (Pro) →
- Mortgage (P&I)
- −$2,360
- Tax from tax record
- −$342 /mo · $4,104/yr
- Insurance
- −$188
- HOA
- −$0
- Vacancy / Maint / Mgmt
- −$731
- Net cashflow
- $-139
Break-even live
Sensitivity live
| Price | -10% $116 | -5% $-12 | +0% $-139 | +5% $-267 | +10% $-394 |
|---|---|---|---|---|---|
| Rent | -10% $-414 | -5% $-277 | +0% $-139 | +5% $-2 | +10% $136 |
| Rate | -1.0pp $87 | -0.5pp $-25 | base $-139 | +0.5pp $-256 | +1.0pp $-374 |
UW: 25.0% down · 7.5% · 30yr · 1.5% tax · 5.0% vac · 8.0% maint · 8.0% mgmt
Financing live
Cash to close
- Down payment
- $112,500
- Closing costs
- $13,500
- Reserves months
- —
- Total cash needed
- —
Loan-product check · same deal, 3 products live
Conventional
25% down · 7.5% · 30yr
- Down + closing
- —
- Monthly P&I
- —
- Monthly cashflow
- —
- DSCR
- —
- Eligible?
- —
Personal DTI + credit; lowest rate.
DSCR
20% down · 8.5% · 30yr
- Down + closing
- —
- Monthly P&I
- —
- Monthly cashflow
- —
- DSCR
- —
- Eligible?
- —
No personal income docs; deal must DSCR.
Hard money
10% down · 12.0% · 12mo
- Down + closing
- —
- Monthly P&I
- —
- Monthly cashflow
- —
- DSCR
- —
- Eligible?
- —
Short-term bridge; refi at stabilization.
Rent comps 3 comps
| Address | Beds | Baths | Sqft | Rent | $/sqft | DOM | Units | Dist |
|---|---|---|---|---|---|---|---|---|
| 201 Frank Dr Chesapeake, VA | 3.0 | 2.0 | 1933 | $3,250 | $1.68 | 23d | 1 | 0.46mi |
| 917 Calhoun Way Chesapeake, VA | 3.0 | 3.5 | 2500 | $4,000 | $1.60 | 18d | 1 | 0.54mi |
| 340 Briarfield Dr Chesapeake, VA | 4.0 | 3.5 | 1924 | $2,995 | $1.56 | 25d | 1 | 1.28mi |
Listing history 13 events
-
2026-06-21days on market $450,000 Active 5 DOM
-
2026-06-18days on market $450,000 Active 2 DOM
-
2026-06-16remarks 513-char remark
-
2026-06-16days on market $450,000 Active 1 DOM
-
2026-06-15days on market $450,000 Active 17 DOM
-
2026-06-13days on market $450,000 Active 15 DOM
-
2026-06-09days on market $450,000 Active 11 DOM
-
2026-06-08days on market $450,000 Active 10 DOM
-
2026-06-07days on market $450,000 Active 9 DOM
-
2026-06-03days on market $450,000 Active 5 DOM
-
2026-06-02days on market $450,000 Active 4 DOM
-
2026-06-01days on market $450,000 Active 3 DOM
-
2026-05-31days on market $450,000 Active 2 DOM
ⓘ Source: listings_history table (triggers on properties + properties_extension) + one-shot
backfill from property_details.listing_events for pre-trigger history.
Tax reassessment forecast VA · Resets to sale price
- Current annual tax
- $4,104 · $342/mo
- Projected year-2 tax
- $4,104 · $342/mo
- Expected delta
- $0/yr ($0/mo · 0.0%)
ⓘ Screening estimate from a state-policy table — verify with the county assessor before closing.
Climate risk First Street
- Flood 1/10 Low FEMA zone X (unshaded) · 0% chance over 30 yrs
- Wildfire 3/10 Moderate
- Heat 9/10 Extreme 7 d/yr ≥107°F today · 16 d/yr by 30 yrs out
- Wind 8/10 Severe 80% chance of damaging wind over 30 yrs
- Air quality 1/10 Low 0 unhealthy d/yr today · 0 by 30 yrs out
Nearby sold comps map
Loading sold comps map…
Walkable amenities ~0.75 mi
Loading nearby amenities…
Taxation est. · year 1
- Rental income
- $41,774
- − Mortgage interest
- −$25,207
- − Property taxes
- −$4,104
- − Insurance
- −$2,250
- − Repairs & maintenance
- −$3,342
- − Management
- −$3,342
- − Depreciation
- −$13,091
- Taxable loss
- −$9,561
- Est. tax savings @ 24.0%
- +$2,295
- After-tax cash flow
- $625/yr
For passive investors: Depreciation is non-cash, so a rental often shows a tax loss while cash-flowing — sheltering income. Rental losses are passive: they offset passive income freely, and up to $25,000/yr can offset ordinary (W-2) income if you actively participate and your MAGI is under $100k (phasing out to $0 by $150k); unused losses carry forward. On sale, claimed depreciation is recaptured at up to 25%, and gains may owe capital-gains tax (a 1031 exchange can defer both). Figures are a year-1 estimate at your 24.0% rate — not tax advice; consult a CPA.
Schools (NCES district)
- District
- Chesapeake City Public School District
- NCES district ID
- 5100810
- Math proficiency
- 58% ▼ -29.00%
- Reading proficiency
- 74% ▼ -7.00%
- Median HH income
- $69,356
- Composite
- 57.84/100
- National rank
- #1047
- State rank
- #31 of 131 in VA
Livability — Chesapeake
- Score
- 70/100
- State rank
- #236
- US rank
- #7942
Category grades
Schools grade is shown separately in the Schools card above.
Census & demographics
- Census place
- Chesapeake, VA
- County
- Chesapeake City · 253,091 people
- City population
- 253,091
- Metro
- Virginia Beach-Norfolk-Newport News, VA-NC
- Population (ZIP)
- 66,956
- Household income
- $134,880
- Rent vs Own
- Severe rent burden
- 507.0
Population outlook (Chesapeake County) Hauer SSP2
- Today (2025)
- 263,804 people
- By 2030
- 276,798 · +4.9%
- By 2040
- 299,906 · +13.7%
- By 2050
- 318,284 · +20.7%
- By 2075
- 362,137 · +37.3%
- By 2100
- 372,225 · +41.1%
Race, ethnicity, and origin ACS 2023
- Neighborhood character
- Predominantly White (77%)
- Race & ethnicity
- White 77% Black 9% Two or more races 7% Hispanic / Latino 6% Asian 4%
- Hispanic origin (detail)
- Mexican 2% Puerto Rican 1%
- Common ancestry
- Slovak 2% Italian 2% Lithuanian 2%
- Foreign-born
- 5% · Canada, South Korea
- Languages at home
- 93% English-only · Spanish 2% Tagalog/Filipino 1% Other Indo-European 1%
Political lean MEDSL · Chesapeake
- 2024 margin
- Toss-up / Even · D 51.3% · R 47.5% · Other 1.2%
- 2008→2024 swing
- +2.5pp toward D · 2008: 1.3pp · 2024: 3.8pp
- All cycles
- 2024: D+3.8 2020: D+6.5 2016: R+1.3 2012: D+1.1 2008: D+1.3
Not yet ingested
- Civics
- —
Market trends
- HPI YoY
- ▼ -357.58%
- Current HPI
- 312.495
- Rent YoY
- ▲ 4.46%
- Metro
- Virginia Beach-Norfolk-Newport News, VA-NC
- State GDP YoY
- ▲ 2.40%
- F500 in state
- 50
Industry mix (Fortune 500 HQ in VA)
| Industry | F500 HQs | Revenue |
|---|---|---|
| Aerospace / Defense | 4 | $236B |
|
||
| Technology / Defense | 3 | $32B |
|
||
| Financial Services | 2 | $176B |
|
||
| Utilities | 2 | $27B |
|
||
| Insurance | 2 | $25B |
|
||
| Technology | 2 | $15B |
|
||
Price history
+383.9% since first listed2 events — show timeline
- 2026-05-30 Listed $450,000 FSBO.com
- 1988-07-21 Sold (Public Records) $93,000 Public Records
Property tax history
+3.4%/yrLatest (2025): $4,104 · +4.7% YoY. Source: county tax records.
Cash-flow waterfall
monthlySold comps — $/sqft
last 12 mo · ≤1 miLoading sold comps…