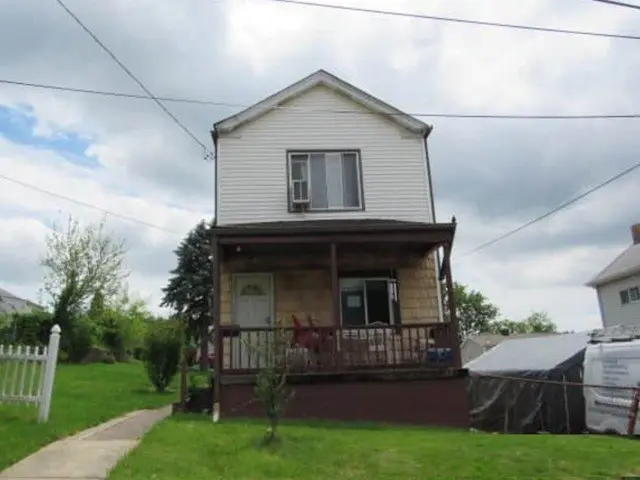
3110 West St · West Mifflin, PA
Flood risk 1/10 · Minimal
- FEMA flood zone
- X (unshaded)
- Chance of flooding over 30 yrs
- 0.0%
- Est. flood insurance / yr
- $473 – $860
Fire risk 1/10 · Minimal
- Est. fire insurance / yr
- $511 – $949
Heat risk 4/10 · Minor
- Hot days now (above 96°F)
- 7 days/yr
- Hot days in 30 yrs
- 17 days/yr
Wind risk 2/10 · Minimal
- Chance of severe wind over 30 yrs
- —
Air-quality risk 4/10 · Minor
- Unhealthy air days now
- 4 days/yr
- Unhealthy air days in 30 yrs
- 5 days/yr
Risk factors via First Street. Map © Google.
Why this score? — see what drove the B+ grade
The composite is a weighted blend of 9 inputs, each scored 0–100. Each bar is that input's sub-score; the figure is the points it added to the 100-point composite (weight × sub-score).
- Cash flow +30.0/30.0
- ARV discount +15.0/15.0
- 1% rule +10.0/10.0
- DSCR +10.0/10.0
- Livability +3.7/5.0
- Schools +2.6/10.0
- Rent growth +2.5/5.0
- Condition / age +2.5/5.0
- Appreciation +0.0/10.0
$76,800
🖨 Deal sheet 📄 Offer letter ✓ Due diligence
Listing remarks
An inviting front porch welcomes you to this two bedroom, one bath home. Take a drive by and see if this may be your next investment.
Key facts
- 5,501 sq ft lot
- Built 1900
- Listed 20 days
Property features AI
Exterior
- Utilities: Public water; Public sewer
- Home design: Frame construction; Resale property
- Construction: Frame construction
- Exterior features: Lot approximately 0.126 acre
Interior
- Kitchen: Kitchen on the main level
- Bedrooms: Three bedrooms (two on the upper level, one on the main level)
- Bathrooms: 1 full bathroom
- Interior features: Unfinished basement
- Laundry & utility: Basement utility area
Neighborhood map
What this means for you Summary
Snapshot
- This is a 2-bed/1.0-bath single-family listed at $77k.
Deal economics
- At list price, monthly cash flow is $420 ($5k/yr) — positive.
- The deal already cash-flows at list — no discount required.
- Meets the 1% rule at list price ($1k rent vs $77k).
- Recommended offer: $76k (1.5% below list) — sets the bar for market timing.
- Cap rate 12.9% vs local median 5.2% in West Mifflin — top-decile yield for the area; either an underpriced asset or a hidden risk that comps aren't pricing in. Stress-test before assuming the spread holds.
Location & tenants
- Location reads 73/100 on livability (#539 in PA) — a middle-class / working-renter tenant base. Strengths: cost of living A+, housing A+, schools B+; Watch: health & safety D, crime D-, amenities F.
- West Mifflin Area SD (suburban): math 19% / reading 41% proficiency, ranked #443 of 539 in PA (top 82%) — families likely to look elsewhere, expect single-tenant / working-renter base with shorter leases.
- Market conditions: 58 active listings in the ZIP; 21 comparable units currently listed for rent nearby; rentals at typical pace (median 24d on market — plan ~3-4 weeks tenant-placement turnaround); 2,996 units permitted in Allegheny County in 2024 (1,588 in 5+ unit buildings).
Forward outlook
- Local home prices are declining (-3.0%/yr); year-one equity from $531 of loan paydown is wiped out by about $2k of value loss. Plan a longer hold.
- At projected returns (-3.0% appreciation + 3.0% rent growth), your $22k cash investment doubles in ~6 years — after that, you're playing with house money.
Negotiation context
- It's been on market 20 days — a 2% lower offer ($76k) is reasonable based on typical stale-listing flexibility.
- Current owner paid $27k; list at $77k implies a 183% gain — meaningful room to come down on a strong offer.
Risks & watch-outs
- Watch-outs: built in 1900 — expect roof / HVAC / electrical / plumbing capex.
Questions for the listing agent
- Built in 1900 — when were the roof, HVAC, electrical panel, plumbing, and water heater last replaced?
- Is there a deadline driving the sale (1031 exchange, divorce, estate, relocation)? That informs how much negotiation room exists.
- Schools are B-rated — typically a magnet for longer-tenancy family renters. What's the average tenant stay here, and is there a school-zone premium baked into asking?
- Crime grade is D in this area — have there been break-ins, vandalism, or insurance claims at this property in the last 3 years? What carrier currently insures it and at what premium?
- What's the average days-on-market for RENTAL listings here right now (not sales)? A rising rental-DOM trend means longer vacancies and softer asking-rent achievability than the comps imply.
- What's the recent tenant-quality profile in this submarket — average credit score on applications, eviction rate, late-payment / NSF rate, and stable-employment percentage? A property-management company in the area should have these aggregated.
- How much new for-sale + rental construction is in the pipeline within 1–3 miles? Heavy new supply typically softens prices + rents 12–24 months out; constrained supply supports both.
Investment metrics
- 1% rule
- 1.65% ✓
- Cap rate
- 12.86%
- Cash-on-cash
- 23.44%
- DSCR
- 2.04
- GRM
- 5.1
CMA / ARV
- ARV (on-the-fly)
- $134,200
- Comps found
- 12
Show comp detail 12 sales within ~0.75 mi
| Address | Dist | Beds/Ba | Sqft | Sold | Price | $/sf | Match |
|---|---|---|---|---|---|---|---|
| 2441 Dewey St | 0.39mi | 2/1.5 | 1,180 (-3%) | 2mo | $239,900 | $203 | 73 |
| 3333 Lincoln Ave | 0.20mi | 3/1.5 (+1) | 1,104 (-10%) | 2mo | $76,000 | $69 | 66 |
| 123 E Mifflin St | 0.62mi | 3/1.0 (+1) | 1,260 (+3%) | 0mo | $108,000 | $86 | 60 |
| 2444 Dewey St | 0.40mi | 2/1.0 | 1,060 (-13%) | 0mo | $61,000 | $58 | 59 |
| 209 Video Dr | 0.60mi | 3/1.0 (+1) | 1,269 (+4%) | 2mo | $195,000 | $154 | 59 |
| 243 Whitaker St | 0.60mi | 2/1.0 | 1,120 (-8%) | 4mo | $57,500 | $51 | 55 |
| 228 W Marigold St | 0.66mi | 3/1.5 (+1) | 1,168 (-4%) | 1mo | $179,900 | $154 | 54 |
| 293 W Schwab | 0.54mi | 3/2.0 (+1) | 1,308 (+7%) | 4mo | $105,000 | $80 | 50 |
| 230 W Schwab Ave | 0.59mi | 3/2.0 (+1) | 1,312 (+8%) | 2mo | $238,000 | $181 | 49 |
| 147 E Virginia Ave | 0.65mi | 2/1.0 | 1,400 (+15%) | 1mo | $154,000 | $110 | 44 |
| 188 W Schwab Ave | 0.62mi | 3/1.5 (+1) | 1,080 (-12%) | 4mo | $122,000 | $113 | 41 |
| 703 Laura St | 0.72mi | 3/1.0 (+1) | 1,376 (+13%) | 1mo | $115,000 | $84 | 39 |
Match score weights: distance 35% · size 25% · config 20% · recency 20%. Top-matched comps best support the ARV.
Projected returns pro-forma
-3.0% appreciation · 3.0% rent growth · sell at horizon
- IRR
- 16.6%
- Equity multiple
- 1.67×
- Total profit
- $14,361
- Equity at exit
- $11,451
- IRR
- 25.2%
- Equity multiple
- 3.19×
- Total profit
- $47,158
- Equity at exit
- $6,640
Cash invested: $21,504 (down + closing). Projections, not guarantees.
Landlord ↔ Tenant lean methodology
- Overall (STATE)
- 62 Landlord-Friendly
- State Pennsylvania
- 62 Landlord-Friendly · EVEN
- County
- — inherits STATE
- City
- — inherits STATE
ZIP-level market 15122
- Home prices YoY
- -30.4%
- Active inventory
- 58
- Price-to-rent
- 5.1×
Monthly cashflow live
- Estimated rent
- $1,265 high interval (Pro) →
- Mortgage (P&I)
- −$403
- Tax from tax record
- −$145 /mo · $1,734/yr
- Insurance
- −$32
- HOA
- −$0
- Vacancy / Maint / Mgmt
- −$266
- Net cashflow
- $420
Break-even live
UW: 25.0% down · 7.5% · 30yr · 1.5% tax · 5.0% vac · 8.0% maint · 8.0% mgmt
Financing live
Cash to close
- Down payment
- $19,200
- Closing costs
- $2,304
- Reserves months
- —
- Total cash needed
- —
Loan-product check · same deal, 3 products live
Conventional
25% down · 7.5% · 30yr
- Down + closing
- —
- Monthly P&I
- —
- Monthly cashflow
- —
- DSCR
- —
- Eligible?
- —
Personal DTI + credit; lowest rate.
DSCR
20% down · 8.5% · 30yr
- Down + closing
- —
- Monthly P&I
- —
- Monthly cashflow
- —
- DSCR
- —
- Eligible?
- —
No personal income docs; deal must DSCR.
Hard money
10% down · 12.0% · 12mo
- Down + closing
- —
- Monthly P&I
- —
- Monthly cashflow
- —
- DSCR
- —
- Eligible?
- —
Short-term bridge; refi at stabilization.
Rent comps 21 comps
| Address | Beds | Baths | Sqft | Rent | $/sqft | DOM | Units | Dist |
|---|---|---|---|---|---|---|---|---|
| 2104 West St Unit 2F Munhall, PA | 1.0 | 1.0 | 800 | $940 | $1.18 | 14d | 1 | 0.72mi |
| 2104 West St Unit 2R Munhall, PA | 1.0 | 1.0 | 825 | $950 | $1.15 | 14d | 1 | 0.72mi |
| 3705 Botsford St Apt 2 Munhall, PA | 3.0 | 1.0 | 1000 | $1,195 | $1.20 | 44d | 1 | 0.80mi |
| 1900 Maple St Unit 4 Homestead, PA | 1.0 | 1.0 | 1200 | $1,400 | $1.17 | 23d | 1 | 0.80mi |
| 214 Vine St Homestead, PA | 2.0 | 1.0 | 1034 | $1,150 | $1.11 | 44d | 1 | 0.85mi |
| 623 E 18th Ave Homestead, PA | 2.0 | 1.0 | 1156 | $1,600 | $1.38 | 44d | 1 | 0.85mi |
| 3305 W Run Rd Munhall, PA | 2.0 | 1.0 | 1100 | $1,365 | $1.24 | 23d | 1 | 0.86mi |
| 931 Hilltop St Homestead, PA | 3.0 | 1.5 | 1312 | $1,500 | $1.14 | 14d | 1 | 1.02mi |
| 1254 Edgewood Dr Homestead, PA | 3.0 | 1.0 | 1144 | $1,725 | $1.51 | 44d | 1 | 1.08mi |
| 300 W 13th Ave Homestead, PA | 2.0 | 1.0 | 1088 | $1,125 | $1.03 | 16d | 1 | 1.16mi |
| 300 W 13th Ave Unit 302 Homestead, PA | 2.0 | 1.0 | 1088 | $1,150 | $1.06 | 16d | 1 | 1.16mi |
| 4511 Main St Unit B Munhall, PA | 1.0 | 1.0 | 700 | $1,100 | $1.57 | 44d | 1 | 1.21mi |
| 621 E 9th Ave Homestead, PA | 2.0 | 2.0 | 1400 | $1,425 | $1.02 | 23d | 1 | 1.25mi |
| 519 E 9th Ave Fl 1 Homestead, PA | 1.0 | 1.0 | 900 | $995 | $1.11 | 10d | 1 | 1.31mi |
| 442 Brierly Ln Unit 442 West Mifflin, PA | 2.0 | 1.0 | 800 | $995 | $1.24 | 4d | 1 | 1.37mi |
| 440 Brierly Ln Unit 440 West Mifflin, PA | 2.0 | 1.0 | 800 | $1,095 | $1.37 | 4d | 1 | 1.37mi |
| 448 Brierly Ln Unit 448 West Mifflin, PA | 2.0 | 1.0 | 800 | $1,095 | $1.37 | 4d | 1 | 1.38mi |
| 402 Brierly Ln West Mifflin, PA | 2.0 | 1.0 | 1100 | $1,145 | $1.04 | 23d | 1 | 1.38mi |
| 811 West St Apt 1B Homestead, PA | 1.0 | 1.0 | 750 | $1,250 | $1.67 | 44d | 1 | 1.40mi |
| 810 Amity St Unit 2 Homestead, PA | 2.0 | 1.0 | 800 | $995 | $1.24 | 12d | 1 | 1.41mi |
| 212 Kenmawr Ave Braddock, PA | 2.0 | 1.5 | 1417 | $1,300 | $0.92 | 44d | 1 | 1.49mi |
Listing history 12 events
-
2026-06-18days on market $76,800 Active 20 DOM
-
2026-06-17days on market $76,800 Active 19 DOM
-
2026-06-16days on market $76,800 Active 18 DOM
-
2026-06-15days on market $76,800 Active 17 DOM
-
2026-06-13days on market $76,800 Active 15 DOM
-
2026-06-09days on market $76,800 Active 11 DOM
-
2026-06-08days on market $76,800 Active 10 DOM
-
2026-06-07days on market $76,800 Active 9 DOM
-
2026-06-03days on market $76,800 Active 5 DOM
-
2026-06-02days on market $76,800 Active 4 DOM
-
2026-06-01days on market $76,800 Active 3 DOM
-
2026-05-31days on market $76,800 Active 2 DOM
ⓘ Source: listings_history table (triggers on properties + properties_extension) + one-shot
backfill from property_details.listing_events for pre-trigger history.
Tax reassessment forecast PA · Partial reset (capped growth)
- Current annual tax
- $1,734 · $145/mo
- Projected year-2 tax
- $1,734 · $145/mo
- Expected delta
- $0/yr ($0/mo · 0.0%)
ⓘ Screening estimate from a state-policy table — verify with the county assessor before closing.
Climate risk First Street
- Flood 1/10 Low FEMA zone X (unshaded) · 0% chance over 30 yrs
- Wildfire 1/10 Low
- Heat 4/10 Moderate 7 d/yr ≥96°F today · 17 d/yr by 30 yrs out
- Wind 2/10 Low
- Air quality 4/10 Moderate 4 unhealthy d/yr today · 5 by 30 yrs out
Nearby sold comps map
Loading sold comps map…
Walkable amenities ~0.75 mi
Loading nearby amenities…
Taxation est. · year 1
- Rental income
- $15,181
- − Mortgage interest
- −$4,302
- − Property taxes
- −$1,734
- − Insurance
- −$384
- − Repairs & maintenance
- −$1,214
- − Management
- −$1,214
- − Depreciation
- −$2,234
- Taxable income
- $4,097
- Est. tax owed @ 24.0%
- −$983
- After-tax cash flow
- $4,058/yr
For passive investors: Depreciation is non-cash, so a rental often shows a tax loss while cash-flowing — sheltering income. Rental losses are passive: they offset passive income freely, and up to $25,000/yr can offset ordinary (W-2) income if you actively participate and your MAGI is under $100k (phasing out to $0 by $150k); unused losses carry forward. On sale, claimed depreciation is recaptured at up to 25%, and gains may owe capital-gains tax (a 1031 exchange can defer both). Figures are a year-1 estimate at your 24.0% rate — not tax advice; consult a CPA.
Schools (NCES district)
- District
- West Mifflin Area SD
- NCES district ID
- 4225680
- Math proficiency
- 19% ▼ -19.00%
- Reading proficiency
- 41% ▼ -14.00%
- Median HH income
- $46,532
- Composite
- 25.78/100
- National rank
- #7371
- State rank
- #443 of 539 in PA
Livability — West Mifflin
- Score
- 73/100
- State rank
- #539
- US rank
- #5042
Category grades
Schools grade is shown separately in the Schools card above.
Census & demographics
- Census place
- West Mifflin, PA
- County
- Allegheny County · 1,022,028 people
- City population
- 18,816
- Metro
- Pittsburgh, PA
- Population (ZIP)
- 18,816
- Household income
- $72,485
- Rent vs Own
- Severe rent burden
- 334.0
Population outlook (Allegheny County) Hauer SSP2
- Today (2025)
- 1,250,282 people
- By 2030
- 1,256,482 · +0.5%
- By 2040
- 1,256,318 · +0.5%
- By 2050
- 1,244,169 · -0.5%
- By 2075
- 1,197,693 · -4.2%
- By 2100
- 1,093,187 · -12.6%
Race, ethnicity, and origin ACS 2023
- Neighborhood character
- Predominantly White (81%)
- Race & ethnicity
- White 81% Black 9% Two or more races 7% Hispanic / Latino 2% Asian 1%
- Common ancestry
- Romanian 9% Slovak 1% Scotch-Irish 1%
- Foreign-born
- 1% · South Korea
- Languages at home
- 93% English-only · Spanish 4% Other Indo-European 1%
Political lean MEDSL · Allegheny
- 2024 margin
- Strong D (+20.3) · D 59.7% · R 39.4%
- 2008→2024 swing
- +4.8pp toward D · 2008: 15.5pp · 2024: 20.3pp
- All cycles
- 2024: D+20.3 2020: D+20.4 2016: D+16.4 2012: D+14.4 2008: D+15.5
Not yet ingested
- Civics
- —
Market trends
- HPI YoY
- ▼ -107.69%
- Current HPI
- 246.2486
- Rent YoY
- —
- Metro
- Pittsburgh, PA
- State GDP YoY
- ▲ 1.68%
- F500 in state
- 34
Industry mix (Fortune 500 HQ in PA)
| Industry | F500 HQs | Revenue |
|---|---|---|
| Healthcare | 2 | $309B |
|
||
| Insurance | 2 | $27B |
|
||
| Telecommunications / Media | 1 | $124B |
|
||
| Industrial Distribution | 1 | $22B |
|
||
| Financial Services | 1 | $20B |
|
||
| Chemicals / Materials | 1 | $18B |
|
||
Price history
+183.0% since first listed2 events — show timeline
- 2026-05-29 Listed $76,800 West Penn MLS
- 1997-01-24 Sold (Public Records) $27,140 Public Records
Property tax history
+5.3%/yrLatest (2026): $1,734 · +4.2% YoY. Source: county tax records.
Cash-flow waterfall
monthlySold comps — $/sqft
last 12 mo · ≤1 miLoading sold comps…