 🏷️ Likely Rental
257 Manitoba Grn · Fremont, CA
Flood risk 1/10 · Minimal
- FEMA flood zone
- X (shaded)
- Chance of flooding over 30 yrs
- 0.0%
- Est. flood insurance / yr
- $507 – $1,088
Fire risk 1/10 · Minimal
- Est. fire insurance / yr
- $659 – $1,223
Heat risk 5/10 · Moderate
- Hot days now (above 90°F)
- 7 days/yr
- Hot days in 30 yrs
- 14 days/yr
Wind risk 1/10 · Minimal
- Chance of severe wind over 30 yrs
- —
Air-quality risk 8/10 · Major
- Unhealthy air days now
- 13 days/yr
- Unhealthy air days in 30 yrs
- 13 days/yr
Risk factors via First Street. Map © Google.
Why this score? — see what drove the A- grade
The composite is a weighted blend of 9 inputs, each scored 0–100. Each bar is that input's sub-score; the figure is the points it added to the 100-point composite (weight × sub-score).
- Cash flow +30.0/30.0
- ARV discount +15.0/15.0
- 1% rule +10.0/10.0
- DSCR +10.0/10.0
- Schools +7.3/10.0
- Livability +4.2/5.0
- Rent growth +3.3/5.0
- Condition / age +2.2/5.0
- Appreciation +0.0/10.0
$189,000
🖨 Deal sheet (PDF) 📄 Offer letter ✓ Due diligence
Listing remarks MLS
3 Bed, 2 Bath Mobile Home – Fremont Spacious mobile home in family-friendly Southlake Mobile Estates, within the Irvington school district. Low space rent of $1,240/month includes water, sewer, trash, and access to clubhouse, pools, spa, sauna, and more! Close to 880/680 freeways, Pacific Commons, and Tesla. Bring your tools and imagination – tons of potential!
Key facts
- Low space rent
- Access to pools
- Access to spa
Tags
Neighborhood map
What this means for you Summary
Snapshot
- This is a 3-bed/2.0-bath manufactured listed at $189k. Condition is rated fair.
Deal economics
- At list price, monthly cash flow is $2k ($22k/yr) — positive.
- The deal already cash-flows at list — no discount required.
- Meets the 1% rule at list price ($4k rent vs $189k).
- Recommended offer: $166k (12.0% below list) — sets the bar for market timing.
- Cap rate 17.9% vs local median 1.2% in Fremont — top-decile yield for the area; either an underpriced asset or a hidden risk that comps aren't pricing in. Stress-test before assuming the spread holds.
Location & tenants
- Location reads 85/100 on livability (#10 in CA, #561 nationally) — a professional / high-income tenant draw. Strengths: amenities A+, commute A+, employment A+; Watch: cost of living F.
- Fremont Unified (suburban): math 76% / reading 84% proficiency, ranked #23 of 517 in CA (top 4%) — strong family-tenant draw, lease renewals of 3-5y typical; only 15% free/reduced lunch — higher-income household profile.
- Zoned schools: Harvey Green Elementary (435 students, 31% FRL); John M. Horner Middle (1,562 students, 17% FRL); Irvington High (math 80% / reading 88%, grade A, #32 of 1,170 statewide, top 3%, 2,207 students, 18% FRL).
- Market conditions: Rents rising (+3.3%/yr); 148 active listings in the ZIP; 19 comparable units currently listed for rent nearby; rentals at typical pace (median 22d on market — plan ~3-4 weeks tenant-placement turnaround); high-income renter base; 1,742 units permitted in Alameda County in 2024 (856 in 5+ unit buildings).
- This rent runs 32% of the median local income ($147k/yr) — at the standard rent-burdened threshold; future hikes will face affordability resistance.
Forward outlook
- Local home prices are declining (-3.0%/yr); year-one equity from $1k of loan paydown is wiped out by about $6k of value loss. Plan a longer hold.
- Alameda County population projected at +34% by 2050 — long-run rental-demand tailwind backs the buy-and-hold thesis.
- At projected returns (-3.0% appreciation + 3.3% rent growth), your $53k cash investment doubles in ~3 years — after that, you're playing with house money.
Negotiation context
- It's been on market 244 days — a 12% lower offer ($166k) is reasonable based on typical stale-listing flexibility.
- 2 sale attempts; this cycle's ask has dropped $33k (15%) from the opening price — seller is motivated, your offer sets the floor, not the list.
Risks & watch-outs
- Climate carrying-cost: extreme-heat days projected 7→14/yr by 2055 (HVAC capex compounding) — expect insurance premiums to compound above CPI over the hold.
Questions for the listing agent
- It's been on market 244 days. Have you received any prior offers? Is the seller open to a 12% concession, seller financing, or rate buy-down credit?
- Have any recent inspections been done? Can we get a copy of the seller's disclosures and any deferred-maintenance estimates?
- Built in 1972 — when were the roof, HVAC, electrical panel, plumbing, and water heater last replaced?
- Why hasn't it sold? Are there any deal-killer items the seller is aware of (foundation, flood, title, zoning, code violations)?
- Is there a deadline driving the sale (1031 exchange, divorce, estate, relocation)? That informs how much negotiation room exists.
- Schools are A-rated — typically a magnet for longer-tenancy family renters. What's the average tenant stay here, and is there a school-zone premium baked into asking?
- What's the average days-on-market for RENTAL listings here right now (not sales)? A rising rental-DOM trend means longer vacancies and softer asking-rent achievability than the comps imply.
- What's the recent tenant-quality profile in this submarket — average credit score on applications, eviction rate, late-payment / NSF rate, and stable-employment percentage? A property-management company in the area should have these aggregated.
- How much new for-sale + rental construction is in the pipeline within 1–3 miles? Heavy new supply typically softens prices + rents 12–24 months out; constrained supply supports both.
Investment metrics
- 1% rule
- 2.10% ✓
- Cap rate
- 17.88%
- Cash-on-cash
- 41.39%
- DSCR
- 2.84
- GRM
- 4.0
CMA / ARV
- ARV (median comp)
- $270,000
- List price
- $189,000
- Delta
- -30.00%
- Verdict
- UNDERPRICED
- Comps
- 15 within 1.0 mi
Show comp detail 12 sales within ~0.75 mi
| Address | Dist | Beds/Ba | Sqft | Sold | Price | $/sf | Match |
|---|---|---|---|---|---|---|---|
| 287 Winnipeg Ter | 0.04mi | 3/2.0 | 1,344 (0%) | 17mo | $240,800 | $179 | 84 |
| 262 Manitoba Grn #262 | 0.02mi | 2/2.0 (-1) | 1,440 (+7%) | 5mo | $300,000 | $208 | 78 |
| 126 Fisk Ter | 0.16mi | 3/2.0 | 1,440 (+7%) | 4mo | $225,000 | $156 | 77 |
| 265 winnipeg Ter #265 | 0.03mi | 3/2.0 | 1,440 (+7%) | 15mo | $288,888 | $201 | 74 |
| 328 Winnipeg Grn | 0.07mi | 2/2.0 (-1) | 1,440 (+7%) | 10mo | $245,000 | $170 | 72 |
| 48 Eagle Grn | 0.41mi | 2/2.0 (-1) | 1,350 (+0%) | 6mo | $160,000 | $119 | 70 |
| 285 Winnipeg Ter | 0.04mi | 3/2.0 | 1,440 (+7%) | 21mo | $188,000 | $131 | 68 |
| 319 Winnipeg Grn | 0.09mi | 4/2.0 (+1) | 1,536 (+14%) | 4mo | $270,000 | $176 | 64 |
| 58 Delta Ter | 0.34mi | 2/2.0 (-1) | 1,440 (+7%) | 7mo | $238,000 | $165 | 61 |
| 35 Eagle Grn | 0.40mi | 2/2.0 (-1) | 1,440 (+7%) | 5mo | $230,000 | $160 | 60 |
| 43 Eagle Grn | 0.38mi | 3/2.0 | 1,404 (+4%) | 20mo | $300,000 | $214 | 58 |
| 275 Winnipeg Ter | 0.03mi | 4/3.0 (+1) | 1,536 (+14%) | 15mo | $275,000 | $179 | 53 |
Match score weights: distance 35% · size 25% · config 20% · recency 20%. Top-matched comps best support the ARV.
Projected returns pro-forma
-3.0% appreciation · 3.33% rent growth · sell at horizon
- IRR
- 38.3%
- Equity multiple
- 2.64×
- Total profit
- $87,012
- Equity at exit
- $28,181
- IRR
- 45.0%
- Equity multiple
- 5.37×
- Total profit
- $231,167
- Equity at exit
- $16,341
Cash invested: $52,920 (down + closing). Projections, not guarantees.
Landlord ↔ Tenant lean methodology
- Overall (STATE)
- 18 Strongly Tenant-Friendly
- State California
- 18 Strongly Tenant-Friendly · D+13
- County
- — inherits STATE
- City
- — inherits STATE
ZIP-level market 94538
- Rents YoY
- 3.3%
- Active inventory
- 148
- Price-to-rent
- 4.0×
Monthly cashflow live
- Estimated rent
- $3,964 high interval (Pro) →
- Mortgage (P&I)
- −$991
- Tax est. 1.5%
- −$236 /mo · $2,835/yr
- Insurance
- −$79
- HOA
- −$0
- Vacancy / Maint / Mgmt
- −$832
- Net cashflow
- $1,825
Break-even live
Sensitivity live
| Price | -10% $1,956 | -5% $1,891 | +0% $1,825 | +5% $1,760 | +10% $1,695 |
|---|---|---|---|---|---|
| Rent | -10% $1,512 | -5% $1,669 | +0% $1,825 | +5% $1,982 | +10% $2,139 |
| Rate | -1.0pp $1,921 | -0.5pp $1,873 | base $1,825 | +0.5pp $1,776 | +1.0pp $1,727 |
UW: 25.0% down · 7.5% · 30yr · 1.5% tax · 5.0% vac · 8.0% maint · 8.0% mgmt
Financing live
Cash to close
- Down payment
- $47,250
- Closing costs
- $5,670
- Reserves months
- —
- Total cash needed
- —
Loan-product check · same deal, 3 products live
Conventional
25% down · 7.5% · 30yr
- Down + closing
- —
- Monthly P&I
- —
- Monthly cashflow
- —
- DSCR
- —
- Eligible?
- —
Personal DTI + credit; lowest rate.
DSCR
20% down · 8.5% · 30yr
- Down + closing
- —
- Monthly P&I
- —
- Monthly cashflow
- —
- DSCR
- —
- Eligible?
- —
No personal income docs; deal must DSCR.
Hard money
10% down · 12.0% · 12mo
- Down + closing
- —
- Monthly P&I
- —
- Monthly cashflow
- —
- DSCR
- —
- Eligible?
- —
Short-term bridge; refi at stabilization.
Rent comps 19 comps
| Address | Beds | Baths | Sqft | Rent | $/sqft | DOM | Units | Dist |
|---|---|---|---|---|---|---|---|---|
| 4530 Doane St Fremont, CA | 3.0 | 2.0 | 1080 | $3,950 | $3.66 | 45d | 1 | 0.35mi |
| 42854 Parkwood St Fremont, CA | 3.0 | 2.0 | 1400 | $4,295 | $3.07 | 7d | 1 | 0.49mi |
| 42855 Hamilton Way Fremont, CA | 3.0 | 1.0 | 1000 | $2,750 | $2.75 | 45d | 1 | 0.50mi |
| 42838 Homewood St Fremont, CA | 3.0 | 2.0 | 1180 | $4,000 | $3.39 | 45d | 1 | 0.50mi |
| 43308 Grimmer Blvd Fremont, CA | 2.0 | 1.0 | 920 | $2,800 | $3.04 | 1d | 1 | 0.54mi |
| 42645 Newport Dr Fremont, CA | 3.0 | 2.0 | 1151 | $4,400 | $3.82 | 45d | 1 | 0.66mi |
| 42645 Newport Dr Fremont, CA | 3.0 | 2.0 | 1151 | $4,400 | $3.82 | 26d | 1 | 0.66mi |
| 42740 Jefferson St Fremont, CA | 4.0 | 2.0 | 1500 | $4,495 | $3.00 | 1d | 1 | 0.72mi |
| 4788 Valpey Park Ct Fremont, CA | 4.0 | 2.0 | 1683 | $2,500 | $1.49 | 45d | 1 | 0.81mi |
| 41903 Cerchio Ter #1574 Fremont, CA | 3.0 | 2.5 | 1425 | $4,160 | $2.92 | 18d | 1 | 0.84mi |
| 44762 Old Warm Springs Blvd Fremont, CA | 1.0–3.0 | 1.0–2.0 | 959 | $5,155 | $5.37 | 0d | 20 | 0.84mi |
| 41777 Grimmer Blvd Fremont, CA | 2.0 | 1.0 | 935 | $3,065 | $3.28 | 19d | 1 | 1.01mi |
| 42111 Osgood Rd #401 Fremont, CA | 2.0 | 2.0 | 1052 | $3,875 | $3.68 | 45d | 1 | 1.02mi |
| 3301 Innovation Way Fremont, CA | 3.0 | 1.0–2.0 | 963 | $5,025 | $5.22 | 0d | 18 | 1.05mi |
| 45147 Lopes Rd Fremont, CA | 2.0 | 1.0–2.0 | 919 | $4,551 | $4.95 | 3d | 14 | 1.09mi |
| 45128 Warm Springs Blvd #330 Fremont, CA | 2.0 | 2.0 | 1295 | $3,980 | $3.07 | 26d | 1 | 1.24mi |
| 41240 Roberts Ave Fremont, CA | 2.0–3.0 | 1.5–2.5 | 1267 | $4,183 | $3.30 | 0d | 4 | 1.25mi |
| 1802 Ponca Ct Fremont, CA | 2.0 | 2.0 | 1200 | $4,200 | $3.50 | 22d | 1 | 1.40mi |
| 40622 Blacow Rd Fremont, CA | 3.0 | 2.0 | 1148 | $3,500 | $3.05 | 26d | 1 | 1.43mi |
Listing history 12 events
-
2026-06-07status $189,000 Pending 244 DOM
-
2026-06-04days on market $189,000 Active 244 DOM
-
2026-06-03days on market $189,000 Active 243 DOM
-
2026-06-02days on market $189,000 Active 242 DOM
-
2026-06-01days on market $189,000 Active 241 DOM
-
2026-05-31days on market $189,000 Active 240 DOM
-
2026-05-09price $189,000 375-char remark
Show marketing remark (375 chars)
3 Bed, 2 Bath Mobile Home – Fremont Spacious mobile home in family-friendly Southlake Mobile Estates, within the Irvington school district. Low space rent of $1,240/month includes water, sewer, trash, and access to clubhouse, pools, spa, sauna, and more! Close to 880/680 freeways, Pacific Commons, and Tesla. Bring your tools and imagination – tons of potential!
-
2026-05-09status Active 375-char remark
Show marketing remark (375 chars)
3 Bed, 2 Bath Mobile Home – Fremont Spacious mobile home in family-friendly Southlake Mobile Estates, within the Irvington school district. Low space rent of $1,240/month includes water, sewer, trash, and access to clubhouse, pools, spa, sauna, and more! Close to 880/680 freeways, Pacific Commons, and Tesla. Bring your tools and imagination – tons of potential!
-
2026-05-07status Pending 375-char remark
Show marketing remark (375 chars)
3 Bed, 2 Bath Mobile Home – Fremont Spacious mobile home in family-friendly Southlake Mobile Estates, within the Irvington school district. Low space rent of $1,240/month includes water, sewer, trash, and access to clubhouse, pools, spa, sauna, and more! Close to 880/680 freeways, Pacific Commons, and Tesla. Bring your tools and imagination – tons of potential!
-
2026-04-15price $209,000 375-char remark
Show marketing remark (375 chars)
3 Bed, 2 Bath Mobile Home – Fremont Spacious mobile home in family-friendly Southlake Mobile Estates, within the Irvington school district. Low space rent of $1,240/month includes water, sewer, trash, and access to clubhouse, pools, spa, sauna, and more! Close to 880/680 freeways, Pacific Commons, and Tesla. Bring your tools and imagination – tons of potential!
-
2025-10-21price $214,000 375-char remark
Show marketing remark (375 chars)
3 Bed, 2 Bath Mobile Home – Fremont Spacious mobile home in family-friendly Southlake Mobile Estates, within the Irvington school district. Low space rent of $1,240/month includes water, sewer, trash, and access to clubhouse, pools, spa, sauna, and more! Close to 880/680 freeways, Pacific Commons, and Tesla. Bring your tools and imagination – tons of potential!
-
2025-10-01$222,000 Active 375-char remark
Show marketing remark (375 chars)
3 Bed, 2 Bath Mobile Home – Fremont Spacious mobile home in family-friendly Southlake Mobile Estates, within the Irvington school district. Low space rent of $1,240/month includes water, sewer, trash, and access to clubhouse, pools, spa, sauna, and more! Close to 880/680 freeways, Pacific Commons, and Tesla. Bring your tools and imagination – tons of potential!
ⓘ Source: listings_history table (triggers on properties + properties_extension) + one-shot
backfill from property_details.listing_events for pre-trigger history.
Climate risk First Street
- Flood 1/10 Low FEMA zone X (shaded) · 0% chance over 30 yrs
- Wildfire 1/10 Low
- Heat 5/10 Major 7 d/yr ≥90°F today · 14 d/yr by 30 yrs out
- Wind 1/10 Low
- Air quality 8/10 Severe 13 unhealthy d/yr today · 13 by 30 yrs out
Nearby sold comps map
Loading sold comps map…
Walkable amenities ~0.75 mi
Loading nearby amenities…
Taxation est. · year 1
- Rental income
- $47,567
- − Mortgage interest
- −$10,587
- − Property taxes
- −$2,835
- − Insurance
- −$945
- − Repairs & maintenance
- −$3,805
- − Management
- −$3,805
- − Depreciation
- −$5,498
- Taxable income
- $20,091
- Est. tax owed @ 24.0%
- −$4,822
- After-tax cash flow
- $17,082/yr
For passive investors: Depreciation is non-cash, so a rental often shows a tax loss while cash-flowing — sheltering income. Rental losses are passive: they offset passive income freely, and up to $25,000/yr can offset ordinary (W-2) income if you actively participate and your MAGI is under $100k (phasing out to $0 by $150k); unused losses carry forward. On sale, claimed depreciation is recaptured at up to 25%, and gains may owe capital-gains tax (a 1031 exchange can defer both). Figures are a year-1 estimate at your 24.0% rate — not tax advice; consult a CPA.
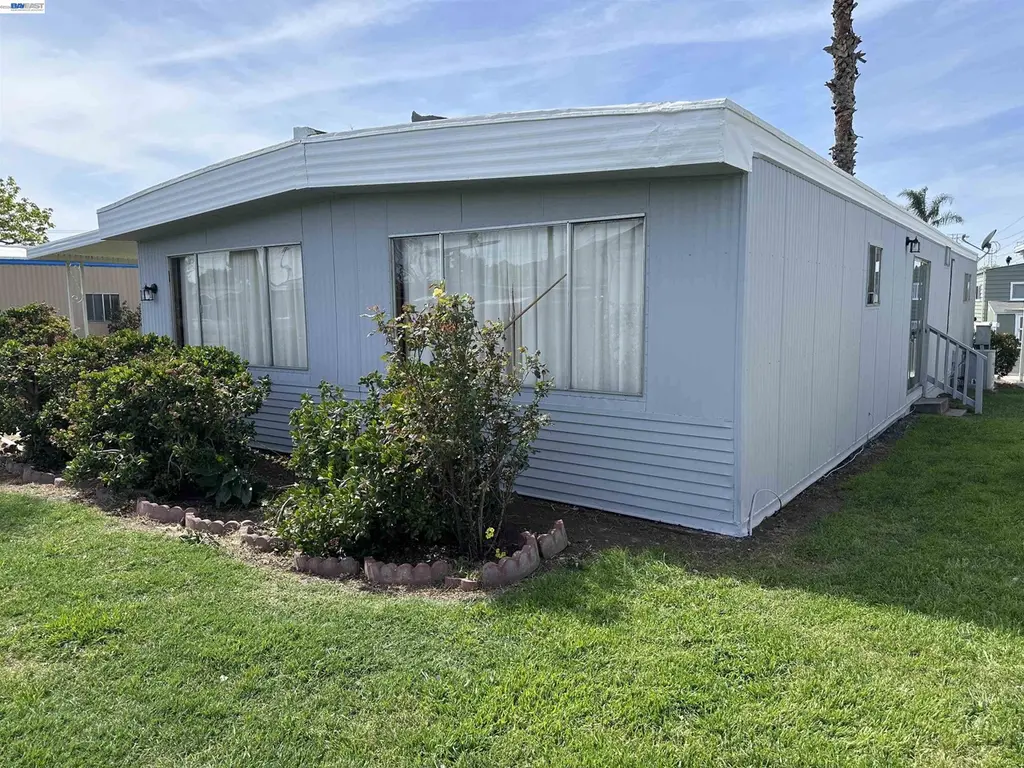
Condition & rehab AI · 12 photos
This mobile home requires moderate repairs to its exterior and interior, but is otherwise in good condition. Painting the exterior and interior walls would significantly increase its value.
Repairs flagged
- Major exterior siding — Severe weathering and peeling
- Major exterior paint — Significant wear and peeling
- Major interior walls — Visible wear and tear
Value-add opportunities
- Both paint exterior — Enhances curb appeal and resale value
- Both paint interior walls — Improves interior appearance and rental appeal
Renovation cost estimate screening
| Repair item | Severity | Est. cost |
|---|---|---|
| exterior siding · Severe weathering and peeling | Major | $15,000–50,000 |
| exterior paint · Significant wear and peeling | Major | $15,000–50,000 |
| interior walls · Visible wear and tear | Major | $15,000–50,000 |
| Total estimated repair cost · 3 items | $45,000–150,000 |
Value-add ROI direction
- Both paint exterior — Enhances curb appeal and resale value ↑
- Both paint interior walls — Improves interior appearance and rental appeal ↑
ⓘ Cost ranges are severity-bucket heuristics (US national rule-of-thumb). Get contractor quotes + a written scope before underwriting a rehab budget.
Schools (NCES district)
- District
- Fremont Unified
- NCES district ID
- 0614400
- Math proficiency
- 76% ▲ 3.00%
- Reading proficiency
- 84% ▲ 6.00%
- Median HH income
- $105,489
- Composite
- 72.94/100
- National rank
- #191
- State rank
- #23 of 517 in CA
Livability — Fremont
- Score
- 85/100
- State rank
- #10
- US rank
- #561
Category grades
Schools grade is shown separately in the Schools card above.
Census & demographics
- Census place
- Fremont, CA
- County
- Alameda County · 1,614,355 people
- City population
- 228,297
- Metro
- San Francisco-Oakland-Berkeley, CA
- Population (ZIP)
- 67,781
- Household income
- $147,301
- Rent vs Own
- Severe rent burden
- 2445.0
Population outlook (Alameda County) Hauer SSP2
- Today (2025)
- 1,928,884 people
- By 2030
- 2,069,146 · +7.3%
- By 2040
- 2,338,405 · +21.2%
- By 2050
- 2,586,608 · +34.1%
- By 2075
- 3,061,911 · +58.7%
- By 2100
- 3,234,133 · +67.7%
Race, ethnicity, and origin ACS 2023
- Neighborhood character
- Diverse neighborhood (Simpson 0.62)
- Race & ethnicity
- Asian 56% Hispanic / Latino 20% White 16% Two or more races 7% Black 3%
- Hispanic origin (detail)
- Mexican 16%
- Common ancestry
- Russian 1% Italian 1% Lithuanian 1%
- Foreign-born
- 50% · China, Canada, Vietnam
- Languages at home
- 34% English-only · Other Indo-European 21% Spanish 14% Chinese 11%
Political lean MEDSL · Alameda
- 2024 margin
- Solid D (+53.6) · D 74.6% · R 21.0% · Other 4.4%
- 2008→2024 swing
- -5.9pp toward R · 2008: 59.5pp · 2024: 53.6pp
- All cycles
- 2024: D+53.6 2020: D+62.5 2016: D+64.4 2012: D+59.8 2008: D+59.5
Not yet ingested
- Civics
- —
Market trends
- HPI YoY
- ▼ -1249.13%
- Current HPI
- 399.7533
- Rent YoY
- ▲ 3.33%
- Metro
- San Francisco-Oakland-Berkeley, CA
- State GDP YoY
- ▲ 3.21%
- F500 in state
- 116
Industry mix (Fortune 500 HQ in CA)
| Industry | F500 HQs | Revenue |
|---|---|---|
| Technology | 27 | $1,492B |
|
||
| Financial Services | 3 | $174B |
|
||
| Retail | 3 | $44B |
|
||
| Insurance | 3 | $26B |
|
||
| Media / Entertainment | 2 | $115B |
|
||
| Pharmaceuticals / Biotech | 2 | $62B |
|
||
Price history
-14.9% since first listed6 events — show timeline
- 2026-05-09 Price Changed $189,000 bridgeMLS, Bay East AOR, or Contra Costa AOR
- 2026-05-09 Relisted — bridgeMLS, Bay East AOR, or Contra Costa AOR
- 2026-05-07 Pending — bridgeMLS, Bay East AOR, or Contra Costa AOR
- 2026-04-15 Price Changed $209,000 bridgeMLS, Bay East AOR, or Contra Costa AOR
- 2025-10-21 Price Changed $214,000 bridgeMLS, Bay East AOR, or Contra Costa AOR
- 2025-10-01 Listed $222,000 bridgeMLS, Bay East AOR, or Contra Costa AOR
Cash-flow waterfall
monthlySold comps — $/sqft
last 12 mo · ≤1 miLoading sold comps…