44 Madison Dr · Newark, DE
Flood risk 1/10 · Minimal
- FEMA flood zone
- X (unshaded)
- Chance of flooding over 30 yrs
- 0.0%
- Est. flood insurance / yr
- $473 – $860
Fire risk 1/10 · Minimal
- Est. fire insurance / yr
- $476 – $884
Heat risk 7/10 · Major
- Hot days now (above 104°F)
- 7 days/yr
- Hot days in 30 yrs
- 15 days/yr
Wind risk 6/10 · Moderate
- Chance of severe wind over 30 yrs
- 27.0%
Air-quality risk 3/10 · Minor
- Unhealthy air days now
- 2 days/yr
- Unhealthy air days in 30 yrs
- 3 days/yr
Risk factors via First Street. Map © Google.
Why this score? — see what drove the D+ grade
The composite is a weighted blend of 9 inputs, each scored 0–100. Each bar is that input's sub-score; the figure is the points it added to the 100-point composite (weight × sub-score).
- Cash flow +19.0/30.0
- DSCR +6.0/10.0
- Livability +4.2/5.0
- 1% rule +4.0/10.0
- Rent growth +3.9/5.0
- ARV discount +3.0/15.0
- Schools +2.5/10.0
- Condition / age +2.5/5.0
- Appreciation +0.0/10.0
$275,000
🖨 Deal sheet (PDF) 📄 Offer letter ✓ Due diligence
Listing remarks MLS
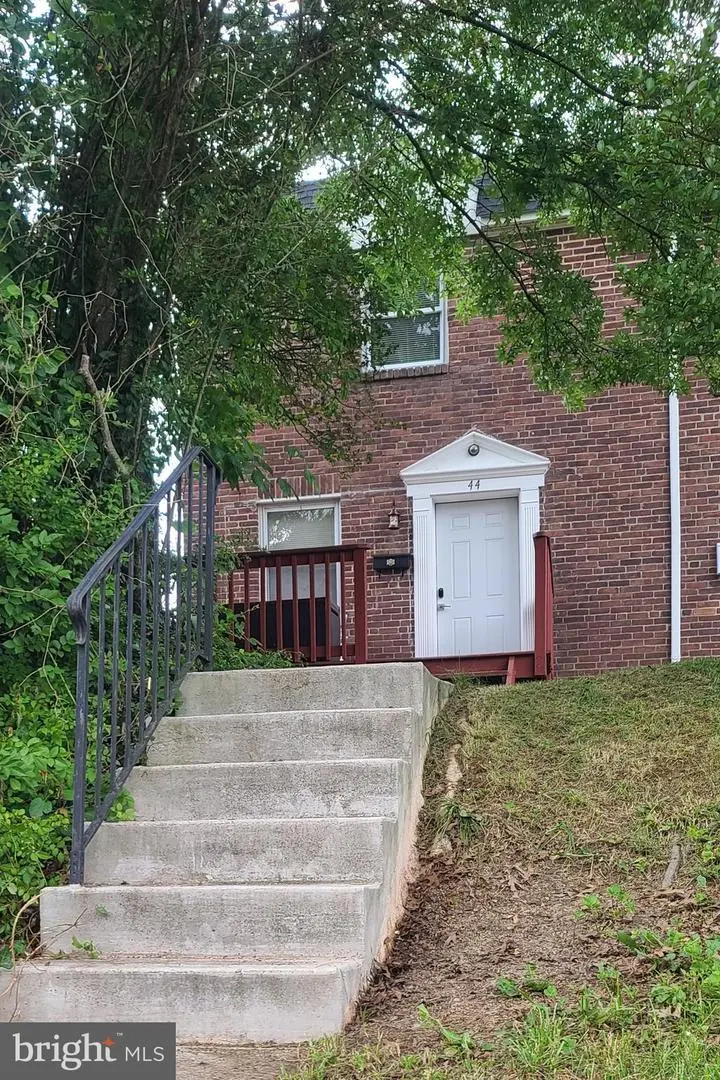
Received multiple offers. Offer deadline is 6/1/2022 by 5pm. Welcome to this charming townhouse within walking/biking distance of the UD campus, Main Street stores and restaurants. A large living room space connecting the kitchen, hard wood floor and fresh paint throughout gives this home a neat and inviting touch. It has 3 bedrooms and 1 updated full bathroom upstairs. The 4th bedroom is on the lower level. From the 4th bedroom you can walk out directly to the parking space behind the building. There is another full bathroom and laundry on the lower level. All brick construction with parks and playgrounds nearby. The concrete steps at the front door are being replaced before it's active. This home is ready for a new owner or an investor as it has 4 rental permits. Mark the date on your calendar to check it out!
Key facts
- 2 parking spots
- Built 1962
- Listed 4 days
Property features AI
Exterior
- Parking: Off-street parking (asphalt driveway) for 2 vehicles; Total of 2 garage/parking spaces
- Utilities: Public water; Public sewer; Electric service for cooling and hot water
- Home design: Interior townhouse/rowhouse; Fee simple ownership
- Construction: Brick construction; Block foundation
- Exterior features: Not in a federal flood zone; Above-grade and below-grade finished areas; Full, fully finished basement
Interior
- Kitchen: Dishwasher; Refrigerator; Electric oven/range
- Bedrooms: Three bedrooms on the upper level; One bedroom on the lower level
- Flooring: Wood flooring
- Bathrooms: Two full bathrooms (one on upper level, one on lower level)
- Heating & cooling: Forced-air heating (oil); Central air conditioning (electric); Electric hot water
- Interior features: Open floor plan; Dining area; Eat-in kitchen; Soaking tub; Walk-in closet(s); Wood floors
- Laundry & utility: Washer; Dryer; Laundry in basement
Neighborhood map
What this means for you Summary
Snapshot
- This is a 3-bed/1.0-bath townhouse listed at $275k.
Deal economics
- At list price, monthly cash flow is $287 ($3k/yr) — positive.
- The deal already cash-flows at list — no discount required.
- To meet the 1% rule (rent ≥ 1% of price), the offer needs to be $249k (9.6% below list).
- Recommended offer: $249k (9.6% below list) — sets the bar for 1% rule.
- Cap rate 7.5% vs local median 4.5% in Newark — top-decile yield for the area; either an underpriced asset or a hidden risk that comps aren't pricing in. Stress-test before assuming the spread holds.
Location & tenants
- Location reads 85/100 on livability (#1 in DE, #569 nationally) — a professional / high-income tenant draw. Strengths: amenities A+, commute A+, health & safety A+; Watch: crime C-.
- Christina School District (suburban): math 22% / reading 33% proficiency, ranked #18 of 26 in DE (top 69%) — low school quality limits family demand, transient renter base, plan for 1-2y turnover.
- Market conditions: Rents rising fast (+5.5%/yr); 130 active listings in the ZIP; 14 comparable units currently listed for rent nearby; rentals at typical pace (median 14d on market — plan ~3-4 weeks tenant-placement turnaround); solid renter incomes; 1,367 units permitted in New Castle County in 2024 (201 in 5+ unit buildings).
- This rent runs 31% of the median local income ($95k/yr) — at the standard rent-burdened threshold; future hikes will face affordability resistance.
Forward outlook
- Local home prices are declining (-3.0%/yr); year-one equity from $2k of loan paydown is wiped out by about $8k of value loss. Plan a longer hold.
- New Castle County population projected at +9% by 2050 — modest demand growth; plan on rents tracking national, not racing it.
Negotiation context
- Only 5 days on market — expect competitive offers; lowballing is unlikely to land.
- 3 sale attempts since 34y ago; this cycle's ask is 57% above the opening price — seller raised mid-cycle; expect resistance to lowballs.
- Current owner paid $185k; 49% above their basis — modest negotiation headroom, anchor on the comps not their cost.
Risks & watch-outs
- Climate carrying-cost: major wind risk, 27% chance of damaging wind over 30y; extreme-heat days projected 7→15/yr by 2055 (HVAC capex compounding) — expect insurance premiums to compound above CPI over the hold.
Questions for the listing agent
- Built in 1962 — when were the roof, HVAC, electrical panel, plumbing, and water heater last replaced?
- Is there a deadline driving the sale (1031 exchange, divorce, estate, relocation)? That informs how much negotiation room exists.
- Schools are B-rated — typically a magnet for longer-tenancy family renters. What's the average tenant stay here, and is there a school-zone premium baked into asking?
- The area grade is low — what's the realistic commute time and amenity access for the typical tenant pool here? Any planned neighborhood developments (good or bad) we should know about?
- What's the average days-on-market for RENTAL listings here right now (not sales)? A rising rental-DOM trend means longer vacancies and softer asking-rent achievability than the comps imply.
- What's the recent tenant-quality profile in this submarket — average credit score on applications, eviction rate, late-payment / NSF rate, and stable-employment percentage? A property-management company in the area should have these aggregated.
- How much new for-sale + rental construction is in the pipeline within 1–3 miles? Heavy new supply typically softens prices + rents 12–24 months out; constrained supply supports both.
Investment metrics
- 1% rule
- 0.90% ✗
- Cap rate
- 7.55%
- Cash-on-cash
- 4.48%
- DSCR
- 1.20
- GRM
- 9.2
CMA / ARV
- ARV (on-the-fly)
- $249,750
- Comps found
- 12
Show comp detail 12 sales within ~0.75 mi
| Address | Dist | Beds/Ba | Sqft | Sold | Price | $/sf | Match |
|---|---|---|---|---|---|---|---|
| 180 Madison Dr | 0.14mi | 3/1.0 | 1,125 (0%) | 4mo | $268,000 | $238 | 90 |
| 181 Madison Dr | 0.16mi | 3/1.0 | 1,125 (0%) | 6mo | $250,000 | $222 | 88 |
| 146 Madison Dr | 0.11mi | 3/1.0 | 1,125 (0%) | 20mo | $255,000 | $227 | 79 |
| 81 Madison Dr | 0.09mi | 3/1.0 | 1,125 (0%) | 21mo | $201,000 | $179 | 78 |
| 130 Madison Dr | 0.10mi | 4/1.5 (+1) | 1,120 (-0%) | 19mo | $247,000 | $221 | 72 |
| 85 Madison Dr | 0.09mi | 3/1.0 | 1,275 (+13%) | 7mo | $260,000 | $204 | 68 |
| 109 Gateway Dr | 0.38mi | 2/1.5 (-1) | 1,125 (0%) | 10mo | $260,000 | $231 | 67 |
| 34 Ethan Allen Ct | 0.27mi | 3/1.5 | 1,225 (+9%) | 6mo | $265,000 | $216 | 65 |
| 115 Gateway Dr #8 | 0.40mi | 2/2.5 (-1) | 1,125 (0%) | 14mo | $241,000 | $214 | 58 |
| 179 Madison Dr | 0.16mi | 3/2.5 | 1,265 (+12%) | 12mo | $300,000 | $237 | 56 |
| 9 Patrick Henry Ct | 0.34mi | 3/1.5 | 1,275 (+13%) | 11mo | $262,000 | $205 | 51 |
| 1118 Blair Ct | 0.39mi | 3/1.5 | 1,250 (+11%) | 17mo | $285,500 | $228 | 47 |
Match score weights: distance 35% · size 25% · config 20% · recency 20%. Top-matched comps best support the ARV.
Projected returns pro-forma
-3.0% appreciation · 5.45% rent growth · sell at horizon
- IRR
- -6.9%
- Equity multiple
- 0.74×
- Total profit
- $-20,080
- Equity at exit
- $41,003
- IRR
- 5.2%
- Equity multiple
- 1.43×
- Total profit
- $32,765
- Equity at exit
- $23,777
Cash invested: $77,000 (down + closing). Projections, not guarantees.
Landlord ↔ Tenant lean methodology
- Overall (STATE)
- 70 Landlord-Friendly
- State Delaware
- 70 Landlord-Friendly · D+7
- County
- — inherits STATE
- City
- — inherits STATE
ZIP-level market 19711
- Rents YoY
- 5.5%
- Active inventory
- 130
- Price-to-rent
- 9.2×
Monthly cashflow live
- Estimated rent
- $2,486 high interval (Pro) →
- Mortgage (P&I)
- −$1,442
- Tax from tax record
- −$120 /mo · $1,438/yr
- Insurance
- −$115
- HOA
- −$0
- Vacancy / Maint / Mgmt
- −$522
- Net cashflow
- $287
Break-even live
Sensitivity live
| Price | -10% $443 | -5% $365 | +0% $287 | +5% $210 | +10% $132 |
|---|---|---|---|---|---|
| Rent | -10% $91 | -5% $189 | +0% $287 | +5% $386 | +10% $484 |
| Rate | -1.0pp $426 | -0.5pp $357 | base $287 | +0.5pp $216 | +1.0pp $144 |
UW: 25.0% down · 7.5% · 30yr · 1.5% tax · 5.0% vac · 8.0% maint · 8.0% mgmt
Financing live
Cash to close
- Down payment
- $68,750
- Closing costs
- $8,250
- Reserves months
- —
- Total cash needed
- —
Loan-product check · same deal, 3 products live
Conventional
25% down · 7.5% · 30yr
- Down + closing
- —
- Monthly P&I
- —
- Monthly cashflow
- —
- DSCR
- —
- Eligible?
- —
Personal DTI + credit; lowest rate.
DSCR
20% down · 8.5% · 30yr
- Down + closing
- —
- Monthly P&I
- —
- Monthly cashflow
- —
- DSCR
- —
- Eligible?
- —
No personal income docs; deal must DSCR.
Hard money
10% down · 12.0% · 12mo
- Down + closing
- —
- Monthly P&I
- —
- Monthly cashflow
- —
- DSCR
- —
- Eligible?
- —
Short-term bridge; refi at stabilization.
Rent comps 14 comps
| Address | Beds | Baths | Sqft | Rent | $/sqft | DOM | Units | Dist |
|---|---|---|---|---|---|---|---|---|
| 54 Madison Dr Newark, DE | 3.0 | 1.0 | 1400 | $1,849 | $1.32 | 20d | 1 | 0.02mi |
| 53 Madison Dr Newark, DE | 3.0 | 1.0 | 1125 | $2,200 | $1.96 | 3d | 1 | 0.04mi |
| 19 Lincoln Dr Newark, DE | 4.0 | 1.0 | 1400 | $3,150 | $2.25 | 45d | 1 | 0.10mi |
| 192 Madison Dr Newark, DE | 4.0 | 2.0 | 1125 | $1,850 | $1.64 | 18d | 1 | 0.12mi |
| 250 S Main St Ste 107 Newark, DE | 2.0–4.0 | 1.0–3.0 | 1567 | $3,430 | $2.19 | 0d | 1 | 0.18mi |
| 215 Murray Rd Newark, DE | 4.0 | 1.5 | 1300 | $2,600 | $2.00 | 4d | 1 | 0.19mi |
| 650 Lehigh Rd Newark, DE | 1.0–2.0 | 1.0 | 871 | $1,799 | $2.07 | 0d | 24 | 0.21mi |
| 1 Nathan Hale Ct Newark, DE | 3.0 | 2.0 | 1350 | $2,300 | $1.70 | 20d | 1 | 0.26mi |
| 112 W Park Pl Newark, DE | 3.0 | 2.0 | 1315 | $3,000 | $2.28 | 45d | 1 | 0.45mi |
| 112 W Park Pl Newark, DE | 3.0 | 2.0 | 1475 | $3,250 | $2.20 | 14d | 1 | 0.45mi |
| 100 Christina Mill Dr Newark, DE | 1.0–2.0 | 1.0–2.0 | 827 | $2,269 | $2.74 | 0d | 9 | 0.60mi |
| 366 Manuel St Newark, DE | 4.0 | 2.0 | 1362 | $2,300 | $1.69 | 5d | 1 | 1.04mi |
| 30 Prospect Ave Newark, DE | 4.0 | 1.0 | 950 | $2,800 | $2.95 | 45d | 1 | 1.05mi |
| 24 Fremont Rd Newark, DE | 4.0 | 2.0 | 1475 | $2,550 | $1.73 | 0d | 1 | 1.41mi |
Listing history 8 events
-
2026-06-21days on market $275,000 Active 5 DOM
-
2026-06-18days on market $275,000 Active 2 DOM
-
2026-06-17statusdays on market $275,000 Active 1 DOM
-
2026-06-16remarks 699-char remark
-
2026-06-16days on market $275,000 Coming Soon 3 DOM
-
2026-06-15days on market $275,000 Coming Soon 2 DOM
-
2026-06-13remarks 47-char remark
-
2026-06-13$275,000 Coming Soon 1 DOM
ⓘ Source: listings_history table (triggers on properties + properties_extension) + one-shot
backfill from property_details.listing_events for pre-trigger history.
Tax reassessment forecast DE · Partial reset (capped growth)
- Current annual tax
- $1,438 · $120/mo
- Projected year-2 tax
- $1,516 · $126/mo
- Expected delta
- +$79/yr (+$7/mo · 5.5%)
ⓘ Screening estimate from a state-policy table — verify with the county assessor before closing.
Climate risk First Street
- Flood 1/10 Low FEMA zone X (unshaded) · 0% chance over 30 yrs
- Wildfire 1/10 Low
- Heat 7/10 Severe 7 d/yr ≥104°F today · 15 d/yr by 30 yrs out
- Wind 6/10 Major 27% chance of damaging wind over 30 yrs
- Air quality 3/10 Moderate 2 unhealthy d/yr today · 3 by 30 yrs out
Nearby sold comps map
Loading sold comps map…
Walkable amenities ~0.75 mi
Loading nearby amenities…
Taxation est. · year 1
- Rental income
- $29,831
- − Mortgage interest
- −$15,404
- − Property taxes
- −$1,438
- − Insurance
- −$1,375
- − Repairs & maintenance
- −$2,387
- − Management
- −$2,387
- − Depreciation
- −$8,000
- Taxable loss
- −$1,158
- Est. tax savings @ 24.0%
- +$278
- After-tax cash flow
- $3,727/yr
For passive investors: Depreciation is non-cash, so a rental often shows a tax loss while cash-flowing — sheltering income. Rental losses are passive: they offset passive income freely, and up to $25,000/yr can offset ordinary (W-2) income if you actively participate and your MAGI is under $100k (phasing out to $0 by $150k); unused losses carry forward. On sale, claimed depreciation is recaptured at up to 25%, and gains may owe capital-gains tax (a 1031 exchange can defer both). Figures are a year-1 estimate at your 24.0% rate — not tax advice; consult a CPA.
Schools (NCES district)
- District
- Christina School District
- NCES district ID
- 1000200
- Math proficiency
- 22% ▼ -12.00%
- Reading proficiency
- 33% ▼ -5.00%
- Median HH income
- $58,838
- Composite
- 24.93/100
- National rank
- #7567
- State rank
- #18 of 26 in DE
Livability — Newark
- Score
- 85/100
- State rank
- #1
- US rank
- #569
Category grades
Schools grade is shown separately in the Schools card above.
Census & demographics
- Census place
- Newark, DE
- County
- New Castle County · 483,412 people
- City population
- 135,862
- Metro
- Philadelphia-Camden-Wilmington, PA-NJ-DE-MD
- Population (ZIP)
- 49,432
- Household income
- $95,403
- Rent vs Own
- Severe rent burden
- 2167.0
Population outlook (New Castle County) Hauer SSP2
- Today (2025)
- 594,686 people
- By 2030
- 609,164 · +2.4%
- By 2040
- 632,154 · +6.3%
- By 2050
- 649,068 · +9.1%
- By 2075
- 687,771 · +15.7%
- By 2100
- 694,961 · +16.9%
Race, ethnicity, and origin ACS 2023
- Neighborhood character
- Predominantly White (69%)
- Race & ethnicity
- White 69% Two or more races 9% Hispanic / Latino 9% Black 9% Asian 8%
- Hispanic origin (detail)
- Mexican 3% Puerto Rican 4%
- Common ancestry
- Romanian 5% Slovak 2% Italian 2%
- Foreign-born
- 12% · China, Canada, Vietnam
- Languages at home
- 84% English-only · Spanish 5% Other Indo-European 3% Chinese 3%
Political lean MEDSL · New Castle
- 2024 margin
- Solid D (+32.6) · D 65.5% · R 32.9% · Other 1.6%
- 2008→2024 swing
- -8.1pp toward R · 2008: 40.6pp · 2024: 32.6pp
- All cycles
- 2024: D+32.6 2020: D+37.1 2016: D+29.6 2012: D+34.1 2008: D+40.6
Not yet ingested
- Civics
- —
Market trends
- HPI YoY
- ▼ -214.42%
- Current HPI
- 225.6592
- Rent YoY
- ▲ 5.45%
- Metro
- Philadelphia-Camden-Wilmington, PA-NJ-DE-MD
- State GDP YoY
- —
- F500 in state
- 0
Price history
+428.8% since first listed13 events — show timeline
- 2026-06-13 Coming Soon $275,000 BRIGHT MLS
- 2022-07-06 Sold (Public Records) $185,000 Public Records
- 2022-06-20 Sold (MLS) $185,000 BRIGHT MLS
- 2022-06-02 Pending — BRIGHT MLS
- 2022-06-02 Contingent — BRIGHT MLS
- 2022-05-27 Listed $175,000 BRIGHT MLS
- 2002-03-27 Sold (Public Records) $83,000 Public Records
- 2002-03-27 Sold (MLS) $83,000 BRIGHT MLS
- 2002-02-19 Listed $83,000 BRIGHT MLS
- 1992-05-01 Sold (Public Records) $84,900 Public Records
- 1992-01-25 Sold (MLS) $84,900 BRIGHT MLS
- 1992-01-16 Listed $84,900 BRIGHT MLS
- 1986-04-01 Sold (Public Records) $52,000 Public Records
Property tax history
+3.9%/yrLatest (2024): $1,438 · +2.5% YoY. Source: county tax records.
Cash-flow waterfall
monthlySold comps — $/sqft
last 12 mo · ≤1 miLoading sold comps…