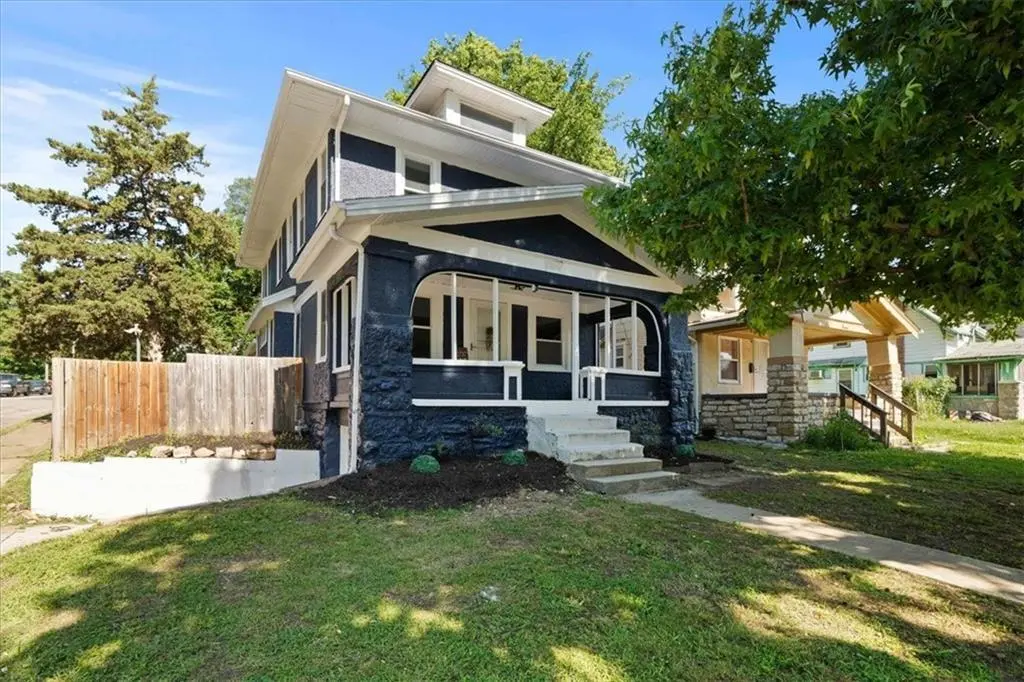
3344 Bales Ave · Kansas City, MO
Flood risk 1/10 · Minimal
- FEMA flood zone
- X (unshaded)
- Chance of flooding over 30 yrs
- 0.0%
- Est. flood insurance / yr
- $473 – $860
Fire risk 1/10 · Minimal
- Est. fire insurance / yr
- $1,054 – $1,958
Heat risk 4/10 · Minor
- Hot days now (above 107°F)
- 7 days/yr
- Hot days in 30 yrs
- 17 days/yr
Wind risk 2/10 · Minimal
- Chance of severe wind over 30 yrs
- —
Air-quality risk 3/10 · Minor
- Unhealthy air days now
- 2 days/yr
- Unhealthy air days in 30 yrs
- 3 days/yr
Risk factors via First Street. Map © Google.
Why this score? — see what drove the C- grade
The composite is a weighted blend of 9 inputs, each scored 0–100. Each bar is that input's sub-score; the figure is the points it added to the 100-point composite (weight × sub-score).
- Cash flow +15.0/30.0
- Appreciation +10.0/10.0
- ARV discount +7.5/15.0
- DSCR +4.6/10.0
- Livability +3.9/5.0
- Rent growth +3.7/5.0
- 1% rule +2.9/10.0
- Condition / age +2.5/5.0
- Schools +1.5/10.0
$180,000
🖨 Deal sheet (PDF) 📄 Offer letter ✓ Due diligence
Listing remarks
Ready for its new owner, this 3-bedroom, 1.5-bath home offers the perfect blend of comfort and modern style. Situated on a desirable corner lot, the home features fresh interior and exterior paint, updated finishes throughout, and an attached garage for added convenience. The spacious backyard provides plenty of room for entertaining, gardening, or simply enjoying the outdoors. With thoughtful updates and move-in-ready condition, this is a home you'll be proud to call your own. Schedule your showing today!
Key facts
- Updated finishes
- Spacious backyard
- Attached garage
Tags
Property features AI
Finance
- HOA & community: No association fees; No community maintenance provided
Exterior
- Parking: Attached garage (1 car)
- Utilities: Public water; Public sewer
- Home design: Single family residence (attached property); Two-story floor plan; Public records list finished living area above grade
- Construction: Stucco exterior; Composition roof; Unfinished basement
- Exterior features: Covered patio; Balcony; Wood fence; Property not in a flood plain
Interior
- Kitchen: Microwave, Refrigerator, Electric Range, Stainless steel appliances
- Bedrooms: Three bedrooms located on the second floor with wood flooring
- Flooring: Wood flooring; Luxury vinyl flooring
- Bathrooms: One full bathroom and one half bathroom
- Heating & cooling: Natural gas heating; Electric cooling
- Interior features: Fireplace in the living room; Breakfast area and kitchen/dining combo; Unfinished basement with inside and garage entrances
- Laundry & utility: Laundry on the main level
Neighborhood map
What this means for you Summary
Snapshot
- This is a 3-bed/1.0-bath single-family listed at $180k.
Deal economics
- At list price, monthly cash flow is $54 ($654/yr) — positive.
- The deal already cash-flows at list — no discount required.
- To meet the 1% rule (rent ≥ 1% of price), the offer needs to be $142k (21.3% below list).
- Recommended offer: $142k (21.3% below list) — sets the bar for 1% rule.
- Cap rate 6.7% vs local median 3.9% in Kansas City — top-decile yield for the area; either an underpriced asset or a hidden risk that comps aren't pricing in. Stress-test before assuming the spread holds.
Location & tenants
- Location reads 78/100 on livability (#28 in MO, #2,671 nationally) — a middle-class / working-renter tenant base. Strengths: amenities A+, commute A+, cost of living A+; Watch: crime F.
- Kansas City 33 (urban): math 12% / reading 24% proficiency, ranked #308 of 324 in MO (top 95%) — low school quality limits family demand, transient renter base, plan for 1-2y turnover; 75% free/reduced lunch — lower-income household profile, screen leases tightly.
- Zoned schools: Ac Prep Elementary (math 12% / reading 27%, grade F, #941 of 1,115 statewide, top 86%, 341 students, 99% FRL); Central Middle School (math 0% / reading 9%, grade F, #388 of 391 statewide, top 99%, 428 students, 99% FRL); Central High School (math 2% / reading 17%, grade F, #507 of 521 statewide, top 98%, 535 students, 99% FRL) — zoned schools average 99% FRL vs 75% district-wide (24 pts higher); higher-poverty schools than district average — tighter screening recommended.
- Market conditions: Rents rising fast (+4.7%/yr); 87 active listings in the ZIP; 40 comparable units currently listed for rent nearby; rentals at typical pace (median 26d on market — plan ~3-4 weeks tenant-placement turnaround); lower-income renter base — watch delinquency; 4,002 units permitted in Jackson County in 2024 (2,271 in 5+ unit buildings).
- At $1,417/mo this rent would consume 47% of the median local household income ($36k/yr) (locally 946% of renters already pay >50% of income on rent) — very limited rent-growth headroom before tenants either downsize or default.
Forward outlook
- In year one you build about $19k of equity ($1k loan paydown + $18k appreciation (10.0% local appreciation)).
- Jackson County population projected at +4% by 2050 — modest demand growth; plan on rents tracking national, not racing it.
- At projected returns (10.0% appreciation + 4.7% rent growth), your $50k cash investment doubles in ~3 years — after that, you're playing with house money.
- By year 2, paydown + projected appreciation supports a ~$31k cash-out refi (75% LTV) — recoverable capital for the next deal without selling this one.
Negotiation context
- Only 3 days on market — expect competitive offers; lowballing is unlikely to land.
Risks & watch-outs
- Watch-outs: built in 1919 — expect roof / HVAC / electrical / plumbing capex.
Questions for the listing agent
- Built in 1919 — when were the roof, HVAC, electrical panel, plumbing, and water heater last replaced?
- Is there a deadline driving the sale (1031 exchange, divorce, estate, relocation)? That informs how much negotiation room exists.
- Crime grade is F in this area — have there been break-ins, vandalism, or insurance claims at this property in the last 3 years? What carrier currently insures it and at what premium?
- What's the average days-on-market for RENTAL listings here right now (not sales)? A rising rental-DOM trend means longer vacancies and softer asking-rent achievability than the comps imply.
- What's the recent tenant-quality profile in this submarket — average credit score on applications, eviction rate, late-payment / NSF rate, and stable-employment percentage? A property-management company in the area should have these aggregated.
- How much new for-sale + rental construction is in the pipeline within 1–3 miles? Heavy new supply typically softens prices + rents 12–24 months out; constrained supply supports both.
Investment metrics
- 1% rule
- 0.79% ✗
- Cap rate
- 6.66%
- Cash-on-cash
- 1.30%
- DSCR
- 1.06
- GRM
- 10.6
CMA / ARV
- ARV (on-the-fly)
- $102,828
- Comps found
- 12
Show comp detail 12 sales within ~0.75 mi
| Address | Dist | Beds/Ba | Sqft | Sold | Price | $/sf | Match |
|---|---|---|---|---|---|---|---|
| 3615 College Ave | 0.31mi | 3/1.5 | 1,598 (+3%) | 5mo | $50,000 | $31 | 75 |
| 3431 Wabash Ave | 0.59mi | 3/1.5 | 1,533 (-2%) | 3mo | $214,900 | $140 | 65 |
| 3547 Bellefontaine Ave | 0.33mi | 3/1.0 | 1,748 (+12%) | 0mo | $95,000 | $54 | 64 |
| 3620 Agnes St | 0.44mi | 3/1.0 | 1,444 (-7%) | 5mo | $95,000 | $66 | 63 |
| 3717 Indiana Ave | 0.43mi | 4/1.5 (+1) | 1,644 (+6%) | 2mo | $129,000 | $78 | 62 |
| 3805 Bellefontaine Ave | 0.57mi | 3/1.5 | 1,624 (+4%) | 5mo | $169,900 | $105 | 60 |
| 3800 Chestnut Ave | 0.67mi | 3/1.0 | 1,470 (-6%) | 1mo | $79,900 | $54 | 59 |
| 2922 E 30th St | 0.58mi | 3/1.0 | 1,364 (-12%) | 3mo | $73,600 | $54 | 50 |
| 3915 Benton Blvd | 0.70mi | 3/2.0 | 1,672 (+7%) | 4mo | $95,000 | $57 | 48 |
| 3416 Park Ave | 0.74mi | 3/1.5 | 1,436 (-8%) | 5mo | $125,000 | $87 | 46 |
| 3933 Monroe Ave | 0.74mi | 2/1.0 (-1) | 1,440 (-8%) | 3mo | $64,000 | $44 | 45 |
| 3111 Kensington Ave | 0.68mi | 3/2.5 | 1,716 (+10%) | 2mo | $140,000 | $82 | 44 |
Match score weights: distance 35% · size 25% · config 20% · recency 20%. Top-matched comps best support the ARV.
Projected returns pro-forma
10.0% appreciation · 4.65% rent growth · sell at horizon
- IRR
- 25.7%
- Equity multiple
- 3.06×
- Total profit
- $103,805
- Equity at exit
- $162,158
- IRR
- 23.0%
- Equity multiple
- 7.11×
- Total profit
- $307,970
- Equity at exit
- $349,700
Cash invested: $50,400 (down + closing). Projections, not guarantees.
Landlord ↔ Tenant lean methodology
- Overall (STATE)
- 81 Strongly Landlord-Friendly
- State Missouri
- 81 Strongly Landlord-Friendly · R+10
- County
- — inherits STATE
- City
- — inherits STATE
ZIP-level market 64128
- Home prices YoY
- 21.6%
- Rents YoY
- 4.7%
- Active inventory
- 87
- Price-to-rent
- 10.6×
Monthly cashflow live
- Estimated rent
- $1,417 high interval (Pro) →
- Mortgage (P&I)
- −$944
- Tax from tax record
- −$46 /mo · $548/yr
- Insurance
- −$75
- HOA
- −$0
- Vacancy / Maint / Mgmt
- −$297
- Net cashflow
- $54
Break-even live
Sensitivity live
| Price | -10% $156 | -5% $105 | +0% $54 | +5% $4 | +10% $-47 |
|---|---|---|---|---|---|
| Rent | -10% $-57 | -5% $-1 | +0% $54 | +5% $110 | +10% $166 |
| Rate | -1.0pp $145 | -0.5pp $100 | base $54 | +0.5pp $8 | +1.0pp $-40 |
UW: 25.0% down · 7.5% · 30yr · 1.5% tax · 5.0% vac · 8.0% maint · 8.0% mgmt
Financing live
Cash to close
- Down payment
- $45,000
- Closing costs
- $5,400
- Reserves months
- —
- Total cash needed
- —
Loan-product check · same deal, 3 products live
Conventional
25% down · 7.5% · 30yr
- Down + closing
- —
- Monthly P&I
- —
- Monthly cashflow
- —
- DSCR
- —
- Eligible?
- —
Personal DTI + credit; lowest rate.
DSCR
20% down · 8.5% · 30yr
- Down + closing
- —
- Monthly P&I
- —
- Monthly cashflow
- —
- DSCR
- —
- Eligible?
- —
No personal income docs; deal must DSCR.
Hard money
10% down · 12.0% · 12mo
- Down + closing
- —
- Monthly P&I
- —
- Monthly cashflow
- —
- DSCR
- —
- Eligible?
- —
Short-term bridge; refi at stabilization.
Rent comps 40 comps
| Address | Beds | Baths | Sqft | Rent | $/sqft | DOM | Units | Dist |
|---|---|---|---|---|---|---|---|---|
| 3419 College Ave Kansas City, MO | 4.0 | 1.0 | 1608 | $1,300 | $0.81 | 4d | 1 | 0.10mi |
| 3305 Askew Ave Kansas City, MO | 3.0 | 1.5 | 1428 | $1,450 | $1.02 | 25d | 1 | 0.15mi |
| 3525 Monroe Ave Kansas City, MO | 3.0 | 2.0 | 1569 | $1,500 | $0.96 | 45d | 1 | 0.24mi |
| 3524 Bellefontaine Ave Kansas City, MO | 3.0 | 1.0 | 1228 | $1,350 | $1.10 | 45d | 1 | 0.31mi |
| 3346 Agnes Ave Kansas City, MO | 3.0 | 1.0 | 1400 | $1,200 | $0.86 | 9d | 1 | 0.32mi |
| 3304 Agnes Ave Unit Downstairs Kansas City, MO | 3.0 | 1.0 | 1150 | $1,095 | $0.95 | 45d | 1 | 0.33mi |
| 3332 Norton Ave Kansas City, MO | 3.0 | 1.0 | 1272 | $1,350 | $1.06 | 45d | 1 | 0.37mi |
| 3205 E 31st St Kansas City, MO | 4.0 | 1.0 | 1800 | $1,325 | $0.74 | 25d | 1 | 0.40mi |
| 3434 Chestnut Ave Kansas City, MO | 2.0 | 1.0 | 1512 | $1,100 | $0.73 | 12d | 1 | 0.44mi |
| 3630 Agnes Ave Kansas City, MO | 3.0 | 2.0 | 1448 | $1,500 | $1.04 | 12d | 1 | 0.46mi |
| 3713 Cleveland Ave Kansas City, MO | 4.0 | 1.0 | 1256 | $1,250 | $1.00 | 18d | 1 | 0.46mi |
| 3739 Bales Ave Kansas City, MO | 3.0 | 2.0 | 1400 | $1,575 | $1.12 | 25d | 1 | 0.48mi |
| 3220 E 30th St Unit 1A Kansas City, MO | 2.0 | 1.0 | 1214 | $950 | $0.78 | 45d | 1 | 0.54mi |
| 3818 Indiana Ave Kansas City, MO | 3.0 | 1.5 | 1223 | $1,147 | $0.94 | 45d | 1 | 0.54mi |
| 3817 S Benton Ave Kansas City, MO | 4.0 | 1.5 | 1380 | $1,650 | $1.20 | 25d | 1 | 0.63mi |
| 3840 Bellefontaine Ave Kansas City, MO | 3.0 | 1.0 | 1500 | $1,500 | $1.00 | 18d | 1 | 0.65mi |
| 3414 Elmwood Ave Kansas City, MO | 4.0 | 1.0 | 1109 | $1,300 | $1.17 | 18d | 1 | 0.68mi |
| 3434 Olive St Kansas City, MO | 3.0 | 2.0 | 2020 | $1,445 | $0.72 | 45d | 1 | 0.69mi |
| 2846 Myrtle Ave Kansas City, MO | 3.0 | 2.0 | 1705 | $1,350 | $0.79 | 18d | 1 | 0.70mi |
| 3736 Cypress Ave Kansas City, MO | 3.0 | 1.0 | 1100 | $1,200 | $1.09 | 9d | 1 | 0.77mi |
| 3920 Spruce Ave Kansas City, MO | 2.0 | 1.0 | 1968 | $1,195 | $0.61 | 25d | 1 | 0.85mi |
| 2120 Linwood Blvd Kansas City, MO | 3.0 | 1.0 | 1326 | $1,400 | $1.06 | 45d | 1 | 0.86mi |
| 4028 Myrtle Ave Kansas City, MO | 3.0 | 1.0 | 1100 | $1,490 | $1.35 | 45d | 1 | 0.87mi |
| 2018 E 35th St Kansas City, MO | 3.0 | 2.0 | 1502 | $1,800 | $1.20 | 5d | 1 | 0.88mi |
| 3902 Wabash Ave Kansas City, MO | 4.0 | 2.0 | 1400 | $1,850 | $1.32 | 45d | 1 | 0.88mi |
| 2002 E 35th St Kansas City, MO | 3.0 | 2.0 | 1426 | $1,295 | $0.91 | 9d | 1 | 0.91mi |
| 4116 Bellefontaine Ave Kansas City, MO | 3.0 | 1.0 | 1234 | $1,000 | $0.81 | 25d | 1 | 0.94mi |
| 4018 Prospect Ave Kansas City, MO | 4.0 | 1.5 | 1900 | $1,695 | $0.89 | 45d | 1 | 0.97mi |
| 3009 Garfield Ave Kansas City, MO | 3.0 | 1.5 | 1334 | $1,425 | $1.07 | 45d | 1 | 0.97mi |
| 4144 College Ave Kansas City, MO | 3.0 | 1.0 | 1108 | $1,095 | $0.99 | 25d | 1 | 0.98mi |
| 4119 S Benton Ave Kansas City, MO | 4.0 | 2.0 | 1700 | $1,800 | $1.06 | 45d | 1 | 0.98mi |
| 4014 Park Ave Kansas City, MO | 3.0 | 2.0 | 1271 | $1,273 | $1.00 | 45d | 1 | 1.07mi |
| 2708 Olive St Kansas City, MO | 4.0 | 2.0 | 1585 | $1,500 | $0.95 | 19d | 1 | 1.09mi |
| 4107 Olive St Kansas City, MO | 3.0 | 1.5 | 1271 | $1,578 | $1.24 | 9d | 1 | 1.10mi |
| 2724 Brooklyn Ave Kansas City, MO | 3.0 | 2.5 | 1398 | $1,440 | $1.03 | 25d | 1 | 1.15mi |
| 4112 Park Ave Kansas City, MO | 4.0 | 2.0 | 1700 | $1,800 | $1.06 | 16d | 1 | 1.17mi |
| 3609 Wayne Ave Kansas City, MO | 3.0 | 1.5 | 1118 | $1,900 | $1.70 | 25d | 1 | 1.18mi |
| 2419 Bales Ave Kansas City, MO | 3.0 | 1.5 | 1116 | $1,500 | $1.34 | 5d | 1 | 1.25mi |
| 4900 E 41st Ter Kansas City, MO | 3.0 | 2.0 | 1270 | $1,500 | $1.18 | 18d | 1 | 1.33mi |
| 4427 Agnes Ave Kansas City, MO | 3.0 | 1.0 | 1100 | $1,350 | $1.23 | 18d | 1 | 1.34mi |
Listing history 3 events
-
2026-06-21days on market $180,000 Active 3 DOM
-
2026-06-18remarks 511-char remark
-
2026-06-18$180,000 Active 1 DOM
ⓘ Source: listings_history table (triggers on properties + properties_extension) + one-shot
backfill from property_details.listing_events for pre-trigger history.
Tax reassessment forecast MO · Resets to sale price
- Current annual tax
- $548 · $46/mo
- Projected year-2 tax
- $1,746 · $146/mo
- Expected delta
- +$1,198/yr (+$100/mo · 218.6%)
ⓘ Screening estimate from a state-policy table — verify with the county assessor before closing.
Climate risk First Street
- Flood 1/10 Low FEMA zone X (unshaded) · 0% chance over 30 yrs
- Wildfire 1/10 Low
- Heat 4/10 Moderate 7 d/yr ≥107°F today · 17 d/yr by 30 yrs out
- Wind 2/10 Low
- Air quality 3/10 Moderate 2 unhealthy d/yr today · 3 by 30 yrs out
Nearby sold comps map
Loading sold comps map…
Walkable amenities ~0.75 mi
Loading nearby amenities…
Taxation est. · year 1
- Rental income
- $16,999
- − Mortgage interest
- −$10,083
- − Property taxes
- −$548
- − Insurance
- −$900
- − Repairs & maintenance
- −$1,360
- − Management
- −$1,360
- − Depreciation
- −$5,236
- Taxable loss
- −$2,488
- Est. tax savings @ 24.0%
- +$597
- After-tax cash flow
- $1,251/yr
For passive investors: Depreciation is non-cash, so a rental often shows a tax loss while cash-flowing — sheltering income. Rental losses are passive: they offset passive income freely, and up to $25,000/yr can offset ordinary (W-2) income if you actively participate and your MAGI is under $100k (phasing out to $0 by $150k); unused losses carry forward. On sale, claimed depreciation is recaptured at up to 25%, and gains may owe capital-gains tax (a 1031 exchange can defer both). Figures are a year-1 estimate at your 24.0% rate — not tax advice; consult a CPA.
Schools (NCES district)
- District
- Kansas City 33
- NCES district ID
- 2916400
- Math proficiency
- 12% ▼ -8.00%
- Reading proficiency
- 24% ▬ 0.00%
- Median HH income
- $35,227
- Composite
- 14.8/100
- National rank
- #9387
- State rank
- #308 of 324 in MO
Livability — Kansas City
- Score
- 78/100
- State rank
- #28
- US rank
- #2671
Category grades
Schools grade is shown separately in the Schools card above.
Census & demographics
- Census place
- Kansas City, MO
- County
- Jackson County · 687,798 people
- City population
- 439,467
- Metro
- Kansas City, MO-KS
- Population (ZIP)
- 11,912
- Household income
- $36,088
- Rent vs Own
- Severe rent burden
- 946.0
Population outlook (Jackson County) Hauer SSP2
- Today (2025)
- 719,589 people
- By 2030
- 731,456 · +1.6%
- By 2040
- 746,689 · +3.8%
- By 2050
- 749,289 · +4.1%
- By 2075
- 736,227 · +2.3%
- By 2100
- 668,210 · -7.1%
Race, ethnicity, and origin ACS 2023
- Neighborhood character
- Predominantly Black (79%)
- Race & ethnicity
- Black 79% Hispanic / Latino 9% White 8% Two or more races 7%
- Hispanic origin (detail)
- Mexican 6%
- Common ancestry
- Swedish 1% Hispanic 1%
- Foreign-born
- 7% · Canada
- Languages at home
- 88% English-only · Spanish 7% French/Haitian/Cajun 2%
Political lean MEDSL · Jackson
- 2024 margin
- D (+19.3) · D 58.9% · R 39.5% · Other 1.6%
- 2008→2024 swing
- -6.1pp toward R · 2008: 25.4pp · 2024: 19.3pp
- All cycles
- 2024: D+19.3 2020: D+22.0 2016: D+16.6 2012: D+19.0 2008: D+25.4
Not yet ingested
- Civics
- —
Market trends
- HPI YoY
- ▲ 73.41%
- Current HPI
- 412.6862
- Rent YoY
- ▲ 4.65%
- Metro
- Kansas City, MO-KS
- State GDP YoY
- ▲ 1.84%
- F500 in state
- 20
Industry mix (Fortune 500 HQ in MO)
| Industry | F500 HQs | Revenue |
|---|---|---|
| Healthcare | 1 | $163B |
|
||
| Insurance | 1 | $21B |
|
||
| Industrial Technology | 1 | $17B |
|
||
| Retail | 1 | $16B |
|
||
| Industrial Distribution | 1 | $10B |
|
||
| Utilities | 1 | $9B |
|
||
Price history
3 events — show timeline
- 2026-06-18 Listed $180,000 Heartland MLS as Distributed by MLS Grid
- 2008-06-16 Sold (Public Records) — Public Records
- 1987-04-15 Sold (Public Records) — Public Records
Property tax history
+4.5%/yrLatest (2025): $548 · -33.3% YoY. Source: county tax records.
Cash-flow waterfall
monthlySold comps — $/sqft
last 12 mo · ≤1 miLoading sold comps…