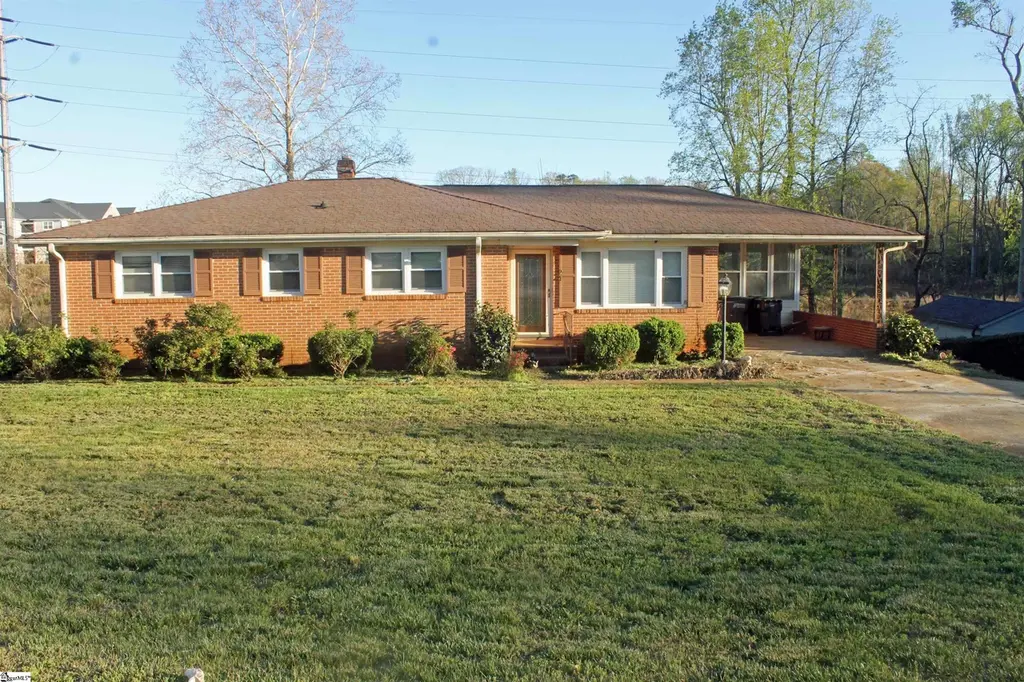
24 Alice Farr Dr · Berea, SC
Flood risk 1/10 · Minimal
- FEMA flood zone
- X (unshaded)
- Chance of flooding over 30 yrs
- 0.0%
- Est. flood insurance / yr
- $473 – $860
Fire risk 4/10 · Minor
- Est. fire insurance / yr
- $783 – $1,453
Heat risk 6/10 · Moderate
- Hot days now (above 102°F)
- 7 days/yr
- Hot days in 30 yrs
- 17 days/yr
Wind risk 2/10 · Minimal
- Chance of severe wind over 30 yrs
- —
Air-quality risk 4/10 · Minor
- Unhealthy air days now
- 3 days/yr
- Unhealthy air days in 30 yrs
- 4 days/yr
Risk factors via First Street. Map © Google.
Why this score? — see what drove the C+ grade
The composite is a weighted blend of 9 inputs, each scored 0–100. Each bar is that input's sub-score; the figure is the points it added to the 100-point composite (weight × sub-score).
- Cash flow +20.7/30.0
- ARV discount +15.0/15.0
- DSCR +6.6/10.0
- Appreciation +5.0/10.0
- 1% rule +4.2/10.0
- Schools +4.2/10.0
- Livability +3.6/5.0
- Rent growth +2.5/5.0
- Condition / age +2.5/5.0
$250,000
🖨 Deal sheet (PDF) 📄 Offer letter ✓ Due diligence
Listing remarks
Three Bedroom 2 Bath house on the main floor. Beautiful hardwood floors. Large kitchen with plenty of cabinets. A full basement allows many possibilities for a recreation room, bonus room or a fourth bedroom. Some TLC is needed which allows for instant equity. Relax on the front porch or enjoy a cookout on the back deck.
Key facts
- Front porch
- Large kitchen
- Full basement
Tags
Property features AI
Finance
- HOA & community: No HOA fees; No community amenities
Exterior
- Parking: Attached 1-car garage; 1-car carport; Paved concrete driveway; Additional garage and an outbuilding with electricity for storage
- Utilities: Public water; Public sewer; Public garbage pickup; Electric power
- Home design: Single-story with basement (1 + basement); Architectural roof; Brick veneer exterior; Lead-based paint disclosure required
- Construction: Basement foundation; Home approx. 50+ years old
- Exterior features: Front porch; Deck; Patio; Some storm doors; Tilt-out windows; Fenced yard; Mostly level lot with gentle slopes and some trees
Interior
- Kitchen: Kitchen approx. 12 x 10; Electric stand-alone range
- Bedrooms: Three bedrooms on the main level; Primary bedroom on main level with full bath and shower only (approx. 13 x 12); Second bedroom approx. 12 x 11; Third bedroom approx. 12 x 11
- Flooring: Carpet; Hardwood
- Bathrooms: Two full bathrooms (both on the main level)
- Heating & cooling: Electric forced air heating; Central forced cooling; Electric water heater
- Interior features: Attic with disappearing stairs; Cable available; Ceiling fan(s); Laminate countertops; Wood-burning fireplace (1)
- Laundry & utility: Laundry located in the basement
Neighborhood map
What this means for you Summary
Snapshot
- This is a 3-bed/2.0-bath single-family listed at $250k.
Deal economics
- At list price, monthly cash flow is $338 ($4k/yr) — positive.
- The deal already cash-flows at list — no discount required.
- To meet the 1% rule (rent ≥ 1% of price), the offer needs to be $230k (8.0% below list).
- Recommended offer: $230k (8.0% below list) — sets the bar for 1% rule.
- Cap rate 7.9% vs local median 3.9% in Berea — top-decile yield for the area; either an underpriced asset or a hidden risk that comps aren't pricing in. Stress-test before assuming the spread holds.
Location & tenants
- Location reads 72/100 on livability (#44 in SC) — a middle-class / working-renter tenant base. Strengths: cost of living A+, housing A+, commute A; Watch: crime F, amenities F, employment F.
- Greenville 01 (suburban): math 44% / reading 54% proficiency, ranked #10 of 80 in SC (top 12%) — families likely to look elsewhere, expect single-tenant / working-renter base with shorter leases.
- Zoned schools: Berea Elementary (math 44% / reading 38%, grade F, #276 of 597 statewide, top 48%, 462 students, 100% FRL) — zoned schools average 100% FRL vs 42% district-wide (58 pts higher); higher-poverty schools than district average — tighter screening recommended.
- Market conditions: 1 active listings in the ZIP; 1 comparable units currently listed for rent nearby; 5,595 units permitted in Greenville County in 2024 (566 in 5+ unit buildings).
Forward outlook
- In year one you build about $9k of equity ($2k loan paydown + $8k appreciation (3.0% local appreciation)).
- Greenville County population projected at +34% by 2050 — long-run rental-demand tailwind backs the buy-and-hold thesis.
- At projected returns (3.0% appreciation + 3.0% rent growth), your $70k cash investment doubles in ~5 years — after that, you're playing with house money.
- By year 4, paydown + projected appreciation supports a ~$31k cash-out refi (75% LTV) — recoverable capital for the next deal without selling this one.
Negotiation context
- Only 13 days on market — expect competitive offers; lowballing is unlikely to land.
- 2 sale attempts with the ask held roughly flat each time — persistent listings suggest the price (not the market) is what's stuck; bring a comps-based counter.
Risks & watch-outs
- Climate carrying-cost: extreme-heat days projected 7→17/yr by 2055 (HVAC capex compounding) — expect insurance premiums to compound above CPI over the hold.
Questions for the listing agent
- Built in 1960 — when were the roof, HVAC, electrical panel, plumbing, and water heater last replaced?
- Is there a deadline driving the sale (1031 exchange, divorce, estate, relocation)? That informs how much negotiation room exists.
- Schools are D-rated, which usually means shorter tenancies and higher turnover. Who's the typical renter profile here, and what's been the actual vacancy rate?
- Crime grade is F in this area — have there been break-ins, vandalism, or insurance claims at this property in the last 3 years? What carrier currently insures it and at what premium?
- What's the average days-on-market for RENTAL listings here right now (not sales)? A rising rental-DOM trend means longer vacancies and softer asking-rent achievability than the comps imply.
- What's the recent tenant-quality profile in this submarket — average credit score on applications, eviction rate, late-payment / NSF rate, and stable-employment percentage? A property-management company in the area should have these aggregated.
- How much new for-sale + rental construction is in the pipeline within 1–3 miles? Heavy new supply typically softens prices + rents 12–24 months out; constrained supply supports both.
Investment metrics
- 1% rule
- 0.92% ✗
- Cap rate
- 7.91%
- Cash-on-cash
- 5.79%
- DSCR
- 1.26
- GRM
- 9.1
CMA / ARV
- ARV (on-the-fly)
- $335,544
- Comps found
- 1
Show comp detail 1 sale within ~0.75 mi
| Address | Dist | Beds/Ba | Sqft | Sold | Price | $/sf | Match |
|---|---|---|---|---|---|---|---|
| 414 Berea Forest Cir | 0.41mi | 3/2.0 | 2,329 (-8%) | 24mo | $308,000 | $132 | 48 |
Match score weights: distance 35% · size 25% · config 20% · recency 20%. Top-matched comps best support the ARV.
Projected returns pro-forma
3.0% appreciation · 3.0% rent growth · sell at horizon
- IRR
- 12.9%
- Equity multiple
- 1.74×
- Total profit
- $51,500
- Equity at exit
- $112,411
- IRR
- 14.8%
- Equity multiple
- 3.19×
- Total profit
- $153,076
- Equity at exit
- $173,238
Cash invested: $70,000 (down + closing). Projections, not guarantees.
Landlord ↔ Tenant lean methodology
- Overall (STATE)
- 90 Strongly Landlord-Friendly
- State South Carolina
- 90 Strongly Landlord-Friendly · R+6
- County
- — inherits STATE
- City
- — inherits STATE
ZIP-level market 29617-1502
- Active inventory
- 1
- Price-to-rent
- 9.1×
Monthly cashflow live
- Estimated rent
- $2,299 medium interval (Pro) →
- Mortgage (P&I)
- −$1,311
- Tax from tax record
- −$63 /mo · $761/yr
- Insurance
- −$104
- HOA
- −$0
- Vacancy / Maint / Mgmt
- −$483
- Net cashflow
- $338
Break-even live
Sensitivity live
| Price | -10% $479 | -5% $408 | +0% $338 | +5% $267 | +10% $196 |
|---|---|---|---|---|---|
| Rent | -10% $156 | -5% $247 | +0% $338 | +5% $428 | +10% $519 |
| Rate | -1.0pp $463 | -0.5pp $401 | base $338 | +0.5pp $273 | +1.0pp $207 |
UW: 25.0% down · 7.5% · 30yr · 1.5% tax · 5.0% vac · 8.0% maint · 8.0% mgmt
Financing live
Cash to close
- Down payment
- $62,500
- Closing costs
- $7,500
- Reserves months
- —
- Total cash needed
- —
Loan-product check · same deal, 3 products live
Conventional
25% down · 7.5% · 30yr
- Down + closing
- —
- Monthly P&I
- —
- Monthly cashflow
- —
- DSCR
- —
- Eligible?
- —
Personal DTI + credit; lowest rate.
DSCR
20% down · 8.5% · 30yr
- Down + closing
- —
- Monthly P&I
- —
- Monthly cashflow
- —
- DSCR
- —
- Eligible?
- —
No personal income docs; deal must DSCR.
Hard money
10% down · 12.0% · 12mo
- Down + closing
- —
- Monthly P&I
- —
- Monthly cashflow
- —
- DSCR
- —
- Eligible?
- —
Short-term bridge; refi at stabilization.
Rent comps 1 comps
| Address | Beds | Baths | Sqft | Rent | $/sqft | DOM | Units | Dist |
|---|---|---|---|---|---|---|---|---|
| 8 Torrington Dr Greenville, SC | 4.0 | 2.5 | 1920 | $2,299 | $1.20 | 16d | 1 | 0.76mi |
Listing history 10 events
-
2026-06-03days on market $250,000 Active 13 DOM
-
2026-06-03days on market $250,000 Active 12 DOM
-
2026-06-01days on market $250,000 Active 11 DOM
-
2026-05-31days on market $250,000 Active 10 DOM
-
2026-05-21historical
-
2026-05-21$250,000 Active
-
2026-05-08historical Contingency Contract
-
2026-05-06price $250,000
-
2026-04-15price $265,000
-
2026-04-01$275,000 Active
ⓘ Source: listings_history table (triggers on properties + properties_extension) + one-shot
backfill from property_details.listing_events for pre-trigger history.
Tax reassessment forecast SC · Resets to sale price
- Current annual tax
- $761 · $63/mo
- Projected year-2 tax
- $1,425 · $119/mo
- Expected delta
- +$664/yr (+$55/mo · 87.3%)
ⓘ Screening estimate from a state-policy table — verify with the county assessor before closing.
Climate risk First Street
- Flood 1/10 Low FEMA zone X (unshaded) · 0% chance over 30 yrs
- Wildfire 4/10 Moderate
- Heat 6/10 Major 7 d/yr ≥102°F today · 17 d/yr by 30 yrs out
- Wind 2/10 Low
- Air quality 4/10 Moderate 3 unhealthy d/yr today · 4 by 30 yrs out
Nearby sold comps map
Loading sold comps map…
Walkable amenities ~0.75 mi
Loading nearby amenities…
Taxation est. · year 1
- Rental income
- $27,588
- − Mortgage interest
- −$14,004
- − Property taxes
- −$761
- − Insurance
- −$1,250
- − Repairs & maintenance
- −$2,207
- − Management
- −$2,207
- − Depreciation
- −$7,273
- Taxable loss
- −$114
- Est. tax savings @ 24.0%
- +$27
- After-tax cash flow
- $4,078/yr
For passive investors: Depreciation is non-cash, so a rental often shows a tax loss while cash-flowing — sheltering income. Rental losses are passive: they offset passive income freely, and up to $25,000/yr can offset ordinary (W-2) income if you actively participate and your MAGI is under $100k (phasing out to $0 by $150k); unused losses carry forward. On sale, claimed depreciation is recaptured at up to 25%, and gains may owe capital-gains tax (a 1031 exchange can defer both). Figures are a year-1 estimate at your 24.0% rate — not tax advice; consult a CPA.
Schools (NCES district)
- District
- Greenville 01
- NCES district ID
- 4502310
- Math proficiency
- 44% ▼ -10.00%
- Reading proficiency
- 54% ▼ -2.00%
- Median HH income
- $49,596
- Composite
- 41.88/100
- National rank
- #3370
- State rank
- #10 of 80 in SC
Livability — Berea
- Score
- 72/100
- State rank
- #44
- US rank
- #6173
Category grades
Schools grade is shown separately in the Schools card above.
Census & demographics
- Census place
- Berea, SC
Population outlook (Greenville County) Hauer SSP2
- Today (2025)
- 574,580 people
- By 2030
- 615,615 · +7.1%
- By 2040
- 695,373 · +21.0%
- By 2050
- 769,367 · +33.9%
- By 2075
- 933,296 · +62.4%
- By 2100
- 1,029,196 · +79.1%
Not yet ingested
- Political lean
- —
- Race & ethnicity
- —
- Common origin
- —
- Civics
- —
Market trends
- HPI YoY
- —
- Current HPI
- —
- Rent YoY
- —
- Metro
- —
- State GDP YoY
- ▲ 4.51%
- F500 in state
- 2
Industry mix (Fortune 500 HQ in SC)
| Industry | F500 HQs | Revenue |
|---|---|---|
| Packaging | 1 | $7B |
|
||
Price history
-9.1% since first listed6 events — show timeline
- 2026-05-21 Listed $250,000 Greater Greenville MLS
- 2026-05-21 Listing Removed — Greater Greenville MLS
- 2026-05-08 Contingent — Greater Greenville MLS
- 2026-05-06 Price Changed $250,000 Greater Greenville MLS
- 2026-04-15 Price Changed $265,000 Greater Greenville MLS
- 2026-04-01 Listed $275,000 Greater Greenville MLS
Property tax history
+1.5%/yrLatest (2025): $761 · +11.7% YoY. Source: county tax records.
Cash-flow waterfall
monthlySold comps — $/sqft
last 12 mo · ≤1 miLoading sold comps…