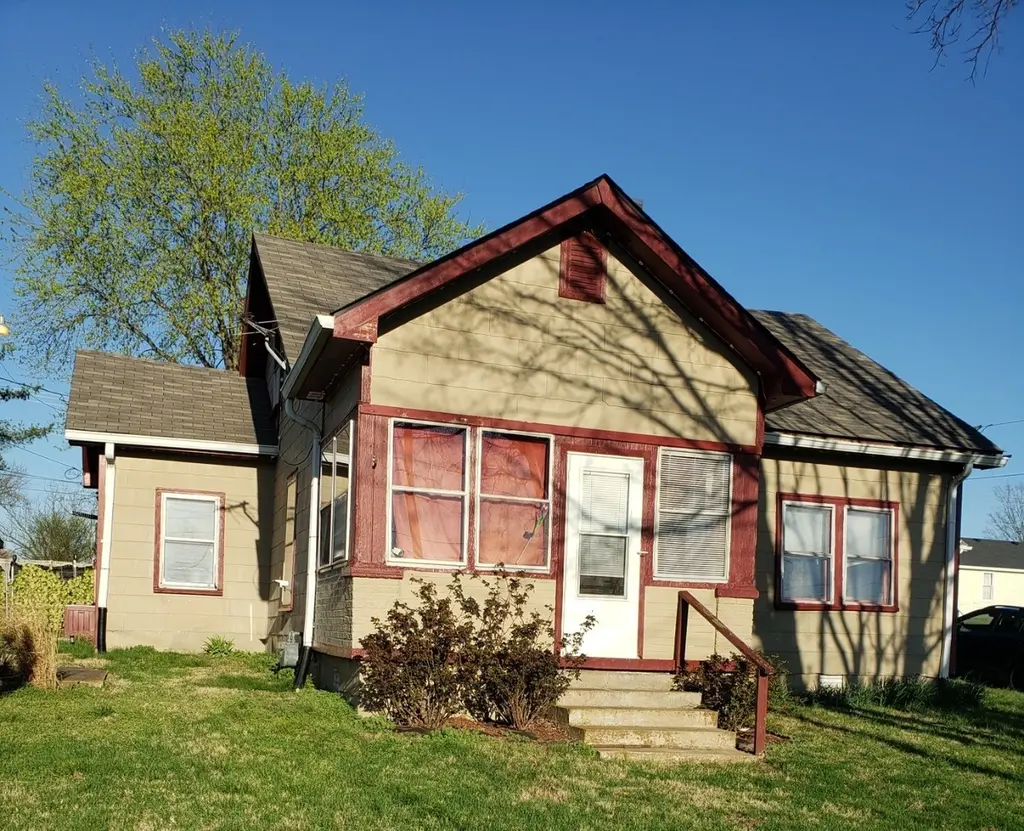
2461 Old Greenbrier Pike · Greenbrier, TN
Flood risk 1/10 · Minimal
- FEMA flood zone
- X (unshaded)
- Chance of flooding over 30 yrs
- 0.0%
- Est. flood insurance / yr
- $507 – $1,088
Fire risk 3/10 · Minor
- Est. fire insurance / yr
- $949 – $1,763
Heat risk 5/10 · Moderate
- Hot days now (above 105°F)
- 7 days/yr
- Hot days in 30 yrs
- 19 days/yr
Wind risk 4/10 · Minor
- Chance of severe wind over 30 yrs
- 8.0%
Air-quality risk 2/10 · Minimal
- Unhealthy air days now
- 0 days/yr
- Unhealthy air days in 30 yrs
- 1 days/yr
Risk factors via First Street. Map © Google.
Why this score? — see what drove the C grade
The composite is a weighted blend of 9 inputs, each scored 0–100. Each bar is that input's sub-score; the figure is the points it added to the 100-point composite (weight × sub-score).
- Cash flow +19.8/30.0
- ARV discount +15.0/15.0
- DSCR +6.3/10.0
- 1% rule +4.2/10.0
- Livability +3.2/5.0
- Rent growth +2.5/5.0
- Condition / age +2.5/5.0
- Schools +2.2/10.0
- Appreciation +0.0/10.0
$230,000
🖨 Deal sheet (PDF) 📄 Offer letter ✓ Due diligence
Listing remarks MLS
Great starter home or investment property. New flooring in kitchen with updated cabinets. Fresh paint throughout and new carpet in guest bedroom. Detached garage and a big back yard. Sunroom and large utility room with a newer water heater. Room to expand on the 2nd floor. The commercial property next door is included with this listing. (2463 Old Greenbrier Pike) Cash or conventional loan only. Seller to make no repairs.
Key facts
- Fenced yard
- Privacy fence
- New roof
Tags
Property features AI
Exterior
- Parking: Detached 1-car garage; 1 covered parking space (1 total parking space)
- Utilities: Public water; Public sewer; Water available
- Home design: Single family residence; One story
- Construction: Shingle roof; Other construction materials; Year built: existing (no specific year provided)
- Exterior features: Back yard fencing; Storage structure on property; Lot dimensions approximately 80 x 207
Interior
- Kitchen: Eat-in kitchen (approx. 20 x 13); No built-in appliances listed
- Bedrooms: 2 bedrooms (both on the main level); Primary bedroom approx. 15 x 10
- Flooring: Carpet; Concrete; Wood; Vinyl
- Bathrooms: 1 full bathroom
- Heating & cooling: Baseboard heating; Wall furnace; Wall/window air conditioning units
- Interior features: Two fireplaces; Crawl space basement; Eat-in kitchen
- Laundry & utility: Electric dryer hookup
Neighborhood map
What this means for you Summary
Snapshot
- This is a 2-bed/1.0-bath single-family listed at $230k.
Deal economics
- At list price, monthly cash flow is $275 ($3k/yr) — positive.
- The deal already cash-flows at list — no discount required.
- To meet the 1% rule (rent ≥ 1% of price), the offer needs to be $212k (7.8% below list).
- Recommended offer: $212k (7.8% below list) — sets the bar for 1% rule.
- Cap rate 7.7% vs local median 3.4% in Greenbrier — top-decile yield for the area; either an underpriced asset or a hidden risk that comps aren't pricing in. Stress-test before assuming the spread holds.
Location & tenants
- Location reads 63/100 on livability (#187 in TN) — a middle-class / working-renter tenant base. Strengths: crime A+, cost of living A+, housing A+; Watch: amenities F, commute F, health & safety F.
- Robertson County (rural): math 22% / reading 26% proficiency, ranked #82 of 139 in TN (top 59%) — low school quality limits family demand, transient renter base, plan for 1-2y turnover.
- Zoned schools: Greenbrier Elementary (math 41% / reading 36%, grade F, #260 of 952 statewide, top 28%, 624 students, 0% FRL); Greenbrier High School (math 15% / reading 22%, grade F, #208 of 332 statewide, top 63%, 812 students, 0% FRL) — zoned schools average 0% FRL vs 42% district-wide (42 pts lower); this property's tenant base skews higher-income than the district average.
- Market conditions: 122 active listings in the ZIP; 3 comparable units currently listed for rent nearby; rentals leasing fast (median 8d on market — plan ~1-2 weeks tenant-placement turnaround); 983 units permitted in Robertson County in 2024 (0 in 5+ unit buildings).
Forward outlook
- Local home prices are declining (-3.0%/yr); year-one equity from $2k of loan paydown is wiped out by about $7k of value loss. Plan a longer hold.
- Robertson County population projected at +7% by 2050 — modest demand growth; plan on rents tracking national, not racing it.
Negotiation context
- It's been on market 49 days — a 3% lower offer ($223k) is reasonable based on typical stale-listing flexibility.
- 8 sale attempts since 5y ago with the ask held roughly flat each time — persistent listings suggest the price (not the market) is what's stuck; bring a comps-based counter.
- Current owner paid $155k; 48% above their basis — modest negotiation headroom, anchor on the comps not their cost.
Risks & watch-outs
- Watch-outs: built in 1900 — expect roof / HVAC / electrical / plumbing capex.
- Climate carrying-cost: extreme-heat days projected 7→19/yr by 2055 (HVAC capex compounding) — expect insurance premiums to compound above CPI over the hold.
Questions for the listing agent
- It's been on market 49 days. Have you received any prior offers? Is the seller open to a 8% concession, seller financing, or rate buy-down credit?
- Built in 1900 — when were the roof, HVAC, electrical panel, plumbing, and water heater last replaced?
- Is there a deadline driving the sale (1031 exchange, divorce, estate, relocation)? That informs how much negotiation room exists.
- Schools are F-rated, which usually means shorter tenancies and higher turnover. Who's the typical renter profile here, and what's been the actual vacancy rate?
- What's the average days-on-market for RENTAL listings here right now (not sales)? A rising rental-DOM trend means longer vacancies and softer asking-rent achievability than the comps imply.
- What's the recent tenant-quality profile in this submarket — average credit score on applications, eviction rate, late-payment / NSF rate, and stable-employment percentage? A property-management company in the area should have these aggregated.
- How much new for-sale + rental construction is in the pipeline within 1–3 miles? Heavy new supply typically softens prices + rents 12–24 months out; constrained supply supports both.
Investment metrics
- 1% rule
- 0.92% ✗
- Cap rate
- 7.73%
- Cash-on-cash
- 5.12%
- DSCR
- 1.23
- GRM
- 9.0
CMA / ARV
- ARV (median comp)
- $326,819
- List price
- $230,000
- Delta
- -29.62%
- Verdict
- UNDERPRICED
- Comps
- 20 within 1.0 mi
Show comp detail 12 sales within ~0.75 mi
| Address | Dist | Beds/Ba | Sqft | Sold | Price | $/sf | Match |
|---|---|---|---|---|---|---|---|
| 2519 Old Greenbrier Pike | 0.18mi | 2/1.0 | 1,044 (-1%) | 12mo | $261,000 | $250 | 80 |
| 208 W South St | 0.26mi | 2/1.0 | 1,008 (-4%) | 1mo | $235,000 | $233 | 80 |
| 609 Draughon Dr | 0.41mi | 2/1.0 | 1,000 (-5%) | 11mo | $265,000 | $265 | 63 |
| 1212 Maple St | 0.35mi | 3/1.0 (+1) | 1,000 (-5%) | 12mo | $255,000 | $255 | 59 |
| 2241 Nunley St | 0.45mi | 3/1.5 (+1) | 1,050 (-1%) | 15mo | $268,000 | $255 | 58 |
| 2342 Old Greenbrier Pike | 0.53mi | 3/2.0 (+1) | 1,104 (+4%) | 1mo | $280,000 | $254 | 58 |
| 4610 Church St | 0.65mi | 3/2.0 (+1) | 1,120 (+6%) | 7mo | $299,900 | $268 | 45 |
| 619 Wilson St | 0.67mi | 3/2.0 (+1) | 1,120 (+6%) | 7mo | $297,000 | $265 | 44 |
| 2018 Elm Hill Ct | 0.72mi | 3/1.0 (+1) | 1,075 (+2%) | 20mo | $272,000 | $253 | 42 |
| 1022 West College | 0.73mi | 3/2.0 (+1) | 1,120 (+6%) | 8mo | $319,900 | $286 | 40 |
| 312 Dreamland Dr | 0.43mi | 3/2.0 (+1) | 1,200 (+14%) | 15mo | $325,000 | $271 | 36 |
| 803 Draughon Dr | 0.56mi | 3/2.0 (+1) | 1,204 (+14%) | 17mo | $298,000 | $248 | 28 |
Match score weights: distance 35% · size 25% · config 20% · recency 20%. Top-matched comps best support the ARV.
Projected returns pro-forma
-3.0% appreciation · 3.0% rent growth · sell at horizon
- IRR
- -8.4%
- Equity multiple
- 0.69×
- Total profit
- $-19,840
- Equity at exit
- $34,294
- IRR
- 1.1%
- Equity multiple
- 1.08×
- Total profit
- $4,934
- Equity at exit
- $19,886
Cash invested: $64,400 (down + closing). Projections, not guarantees.
Landlord ↔ Tenant lean methodology
- Overall (STATE)
- 87 Strongly Landlord-Friendly
- State Tennessee
- 87 Strongly Landlord-Friendly · R+13
- County
- — inherits STATE
- City
- — inherits STATE
ZIP-level market 37073
- Home prices YoY
- -24.7%
- Active inventory
- 122
- Price-to-rent
- 9.0×
Monthly cashflow live
- Estimated rent
- $2,121 medium interval (Pro) →
- Mortgage (P&I)
- −$1,206
- Tax from tax record
- −$98 /mo · $1,181/yr
- Insurance
- −$96
- HOA
- −$0
- Vacancy / Maint / Mgmt
- −$445
- Net cashflow
- $275
Break-even live
Sensitivity live
| Price | -10% $405 | -5% $340 | +0% $275 | +5% $210 | +10% $145 |
|---|---|---|---|---|---|
| Rent | -10% $107 | -5% $191 | +0% $275 | +5% $359 | +10% $443 |
| Rate | -1.0pp $391 | -0.5pp $333 | base $275 | +0.5pp $215 | +1.0pp $155 |
UW: 25.0% down · 7.5% · 30yr · 1.5% tax · 5.0% vac · 8.0% maint · 8.0% mgmt
Financing live
Cash to close
- Down payment
- $57,500
- Closing costs
- $6,900
- Reserves months
- —
- Total cash needed
- —
Loan-product check · same deal, 3 products live
Conventional
25% down · 7.5% · 30yr
- Down + closing
- —
- Monthly P&I
- —
- Monthly cashflow
- —
- DSCR
- —
- Eligible?
- —
Personal DTI + credit; lowest rate.
DSCR
20% down · 8.5% · 30yr
- Down + closing
- —
- Monthly P&I
- —
- Monthly cashflow
- —
- DSCR
- —
- Eligible?
- —
No personal income docs; deal must DSCR.
Hard money
10% down · 12.0% · 12mo
- Down + closing
- —
- Monthly P&I
- —
- Monthly cashflow
- —
- DSCR
- —
- Eligible?
- —
Short-term bridge; refi at stabilization.
Rent comps 3 comps
| Address | Beds | Baths | Sqft | Rent | $/sqft | DOM | Units | Dist |
|---|---|---|---|---|---|---|---|---|
| 1022 W College St Unit 2 Greenbrier, TN | 3.0 | 2.0 | 1120 | $2,400 | $2.14 | 5d | 1 | 0.43mi |
| 2126 Nunley St Greenbrier, TN | 3.0 | 2.0 | 1462 | $1,600 | $1.09 | 8d | 1 | 0.56mi |
| 2017 Smith Cir Greenbrier, TN | 3.0 | 2.0 | 1442 | $2,200 | $1.53 | 8d | 1 | 0.98mi |
Listing history 36 events
-
2026-06-18days on market $230,000 Active 49 DOM
-
2026-06-17days on market $230,000 Active 48 DOM
-
2026-06-16days on market $230,000 Active 47 DOM
-
2026-06-15days on market $230,000 Active 46 DOM
-
2026-06-13days on market $230,000 Active 44 DOM
-
2026-06-13days on market $230,000 Active 43 DOM
-
2026-06-09days on market $230,000 Active 40 DOM
-
2026-06-08days on market $230,000 Active 39 DOM
-
2026-06-07pricedays on market $230,000 Active 38 DOM
-
2026-06-03days on market $235,900 Active 34 DOM
-
2026-06-02days on market $235,900 Active 33 DOM
-
2026-06-01days on market $235,900 Active 32 DOM
-
2026-05-31days on market $235,900 Active 31 DOM
-
2026-04-30$235,900 Active 536-char remark
-
2026-04-21historical
-
2026-04-07price $245,000
-
2026-03-16price $249,900
-
2026-02-19price $257,400
-
2026-02-04$259,900 Active
-
2023-03-28soldstatus $155,000
-
2023-03-27soldstatus $155,000 Closed
Show marketing remark (424 chars)
Great starter home or investment property. New flooring in kitchen with updated cabinets. Fresh paint throughout and new carpet in guest bedroom. Detached garage and a big back yard. Sunroom and large utility room with a newer water heater. Room to expand on the 2nd floor. The commercial property next door is included with this listing. (2463 Old Greenbrier Pike) Cash or conventional loan only. Seller to make no repairs.
-
2022-09-07historical Active Under Contract
Show marketing remark (424 chars)
Great starter home or investment property. New flooring in kitchen with updated cabinets. Fresh paint throughout and new carpet in guest bedroom. Detached garage and a big back yard. Sunroom and large utility room with a newer water heater. Room to expand on the 2nd floor. The commercial property next door is included with this listing. (2463 Old Greenbrier Pike) Cash or conventional loan only. Seller to make no repairs.
-
2022-09-01historical
Show marketing remark (424 chars)
Great starter home or investment property. New flooring in kitchen with updated cabinets. Fresh paint throughout and new carpet in guest bedroom. Detached garage and a big back yard. Sunroom and large utility room with a newer water heater. Room to expand on the 2nd floor. The commercial property next door is included with this listing. (2463 Old Greenbrier Pike) Cash or conventional loan only. Seller to make no repairs.
-
2022-09-01$189,900 Active
Show marketing remark (424 chars)
Great starter home or investment property. New flooring in kitchen with updated cabinets. Fresh paint throughout and new carpet in guest bedroom. Detached garage and a big back yard. Sunroom and large utility room with a newer water heater. Room to expand on the 2nd floor. The commercial property next door is included with this listing. (2463 Old Greenbrier Pike) Cash or conventional loan only. Seller to make no repairs.
-
2022-08-12status Active
-
2022-07-12historical Active Under Contract
-
2022-06-15status Active
-
2022-06-09historical Active Under Contract
-
2022-05-25status Active
-
2022-05-18historical Active Under Contract
-
2022-05-12$189,900 Active
-
2022-02-01historical
-
2021-10-23price $199,999
-
2021-10-04price $215,900
-
2021-09-13price $219,900
-
2021-07-20$224,900 Active
ⓘ Source: listings_history table (triggers on properties + properties_extension) + one-shot
backfill from property_details.listing_events for pre-trigger history.
Tax reassessment forecast TN · Resets to sale price
- Current annual tax
- $1,181 · $98/mo
- Projected year-2 tax
- $1,633 · $136/mo
- Expected delta
- +$452/yr (+$38/mo · 38.3%)
ⓘ Screening estimate from a state-policy table — verify with the county assessor before closing.
Climate risk First Street
- Flood 1/10 Low FEMA zone X (unshaded) · 0% chance over 30 yrs
- Wildfire 3/10 Moderate
- Heat 5/10 Major 7 d/yr ≥105°F today · 19 d/yr by 30 yrs out
- Wind 4/10 Moderate 8% chance of damaging wind over 30 yrs
- Air quality 2/10 Low 0 unhealthy d/yr today · 1 by 30 yrs out
Nearby sold comps map
Loading sold comps map…
Walkable amenities ~0.75 mi
Loading nearby amenities…
Taxation est. · year 1
- Rental income
- $25,449
- − Mortgage interest
- −$12,884
- − Property taxes
- −$1,181
- − Insurance
- −$1,150
- − Repairs & maintenance
- −$2,036
- − Management
- −$2,036
- − Depreciation
- −$6,691
- Taxable loss
- −$528
- Est. tax savings @ 24.0%
- +$127
- After-tax cash flow
- $3,427/yr
For passive investors: Depreciation is non-cash, so a rental often shows a tax loss while cash-flowing — sheltering income. Rental losses are passive: they offset passive income freely, and up to $25,000/yr can offset ordinary (W-2) income if you actively participate and your MAGI is under $100k (phasing out to $0 by $150k); unused losses carry forward. On sale, claimed depreciation is recaptured at up to 25%, and gains may owe capital-gains tax (a 1031 exchange can defer both). Figures are a year-1 estimate at your 24.0% rate — not tax advice; consult a CPA.
Schools (NCES district)
- District
- Robertson County
- NCES district ID
- 4703600
- Math proficiency
- 22% ▼ -11.00%
- Reading proficiency
- 26% ▼ -5.00%
- Median HH income
- $53,503
- Composite
- 21.55/100
- National rank
- #8313
- State rank
- #82 of 139 in TN
Livability — Greenbrier
- Score
- 63/100
- State rank
- #187
- US rank
- #15098
Category grades
Schools grade is shown separately in the Schools card above.
Census & demographics
- Census place
- Greenbrier, TN
- City population
- 14,312
- Population (ZIP)
- 14,312
Population outlook (Robertson County) Hauer SSP2
- Today (2025)
- 72,786 people
- By 2030
- 74,478 · +2.3%
- By 2040
- 76,948 · +5.7%
- By 2050
- 77,618 · +6.6%
- By 2075
- 77,545 · +6.5%
- By 2100
- 72,836 · +0.1%
Race, ethnicity, and origin ACS 2023
- Neighborhood character
- Predominantly White (93%)
- Race & ethnicity
- White 93% Hispanic / Latino 4% Two or more races 2%
- Common ancestry
- Slovak 3% Italian 2% Scotch-Irish 2%
- Foreign-born
- 2% · Canada, South Korea
- Languages at home
- 97% English-only · Spanish 2% Korean 1%
Political lean MEDSL · Robertson
- 2024 margin
- Solid R (+50.9) · D 24.0% · R 74.9% · Other 1.1%
- 2008→2024 swing
- -19.8pp toward R · 2008: -31.1pp · 2024: -50.9pp
- All cycles
- 2024: R+50.9 2020: R+47.0 2016: R+47.2 2012: R+35.6 2008: R+31.1
Not yet ingested
- Civics
- —
Market trends
- HPI YoY
- ▼ -96.44%
- Current HPI
- 293.5595
- Rent YoY
- —
- Metro
- —
- State GDP YoY
- ▲ 2.78%
- F500 in state
- 22
Industry mix (Fortune 500 HQ in TN)
| Industry | F500 HQs | Revenue |
|---|---|---|
| Healthcare | 3 | $91B |
|
||
| Retail | 3 | $72B |
|
||
| Transportation / Logistics | 1 | $88B |
|
||
| Paper / Packaging | 1 | $19B |
|
||
| Insurance | 1 | $13B |
|
||
| Energy | 1 | $12B |
|
||
Price history
+2.3% since first listed24 events — show timeline
- 2026-06-06 Price Changed $230,000 REALTRACS as Distributed by MLS Grid
- 2026-04-30 Listed $235,900 REALTRACS as Distributed by MLS Grid
- 2026-04-21 Listing Removed — REALTRACS as Distributed by MLS Grid
- 2026-04-07 Price Changed $245,000 REALTRACS as Distributed by MLS Grid
- 2026-03-16 Price Changed $249,900 REALTRACS as Distributed by MLS Grid
- 2026-02-19 Price Changed $257,400 REALTRACS as Distributed by MLS Grid
- 2026-02-04 Listed $259,900 REALTRACS as Distributed by MLS Grid
- 2023-03-28 Sold (Public Records) $155,000 Public Records
- 2023-03-27 Sold (MLS) $155,000 REALTRACS as Distributed by MLS Grid
- 2022-09-07 Contingent — REALTRACS as Distributed by MLS Grid
- 2022-09-01 Listing Removed — REALTRACS as Distributed by MLS Grid
- 2022-09-01 Listed $189,900 REALTRACS as Distributed by MLS Grid
- 2022-08-12 Relisted — REALTRACS as Distributed by MLS Grid
- 2022-07-12 Contingent — REALTRACS as Distributed by MLS Grid
- 2022-06-15 Relisted — REALTRACS as Distributed by MLS Grid
- 2022-06-09 Contingent — REALTRACS as Distributed by MLS Grid
- 2022-05-25 Relisted — REALTRACS as Distributed by MLS Grid
- 2022-05-18 Contingent — REALTRACS as Distributed by MLS Grid
- 2022-05-12 Listed $189,900 REALTRACS as Distributed by MLS Grid
- 2022-02-01 Listing Removed — REALTRACS as Distributed by MLS Grid
- 2021-10-23 Price Changed $199,999 REALTRACS as Distributed by MLS Grid
- 2021-10-04 Price Changed $215,900 REALTRACS as Distributed by MLS Grid
- 2021-09-13 Price Changed $219,900 REALTRACS as Distributed by MLS Grid
- 2021-07-20 Listed $224,900 REALTRACS as Distributed by MLS Grid
Property tax history
+6.5%/yrLatest (2025): $1,181 · +0.0% YoY. Source: county tax records.
Cash-flow waterfall
monthlySold comps — $/sqft
last 12 mo · ≤1 miLoading sold comps…