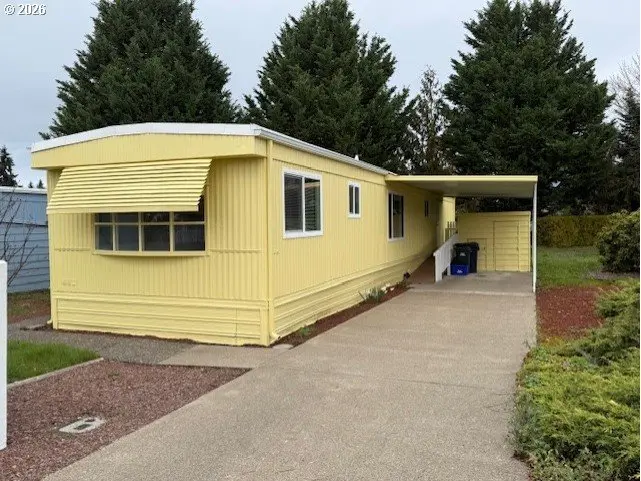
4800 Barger Dr #60 · Eugene, OR
Flood risk 1/10 · Minimal
- FEMA flood zone
- X (unshaded)
- Chance of flooding over 30 yrs
- 0.0%
- Est. flood insurance / yr
- $507 – $1,088
Fire risk 4/10 · Minor
- Est. fire insurance / yr
- $498 – $926
Heat risk 4/10 · Minor
- Hot days now (above 92°F)
- 7 days/yr
- Hot days in 30 yrs
- 15 days/yr
Wind risk 1/10 · Minimal
- Chance of severe wind over 30 yrs
- —
Air-quality risk 10/10 · Severe
- Unhealthy air days now
- 13 days/yr
- Unhealthy air days in 30 yrs
- 14 days/yr
Risk factors via First Street. Map © Google.
Why this score? — see what drove the B grade
The composite is a weighted blend of 9 inputs, each scored 0–100. Each bar is that input's sub-score; the figure is the points it added to the 100-point composite (weight × sub-score).
- Cash flow +29.0/30.0
- ARV discount +13.0/15.0
- 1% rule +10.0/10.0
- DSCR +10.0/10.0
- Livability +4.0/5.0
- Rent growth +2.9/5.0
- Condition / age +2.5/5.0
- Schools +2.3/10.0
- Appreciation +0.0/10.0
$65,000
🖨 Deal sheet (PDF) 📄 Offer letter ✓ Due diligence
Listing remarks MLS
Back on market now that the brand new flooring is installed. The home in this 55 and older park has been recently painted and ready for a new owner. This affordable home is perfect for the owner who wants affordable housing AND... a bigger than normal lot for picnics in the back yard during those upcoming spring and summer days. The fact that the extra large lot provides room for a garden and is a real plus
Key facts
- Community pool
- Built 1978
- Listed 101 days
Neighborhood map
What this means for you Summary
Snapshot
- This is a 2-bed/1.0-bath manufactured listed at $65k.
Deal economics
- At list price, monthly cash flow is $222 ($3k/yr) — positive.
- The deal already cash-flows at list — no discount required.
- Meets the 1% rule at list price ($2k rent vs $65k).
- Recommended offer: $59k (9.0% below list) — sets the bar for market timing.
- Cap rate 10.4% vs local median 2.8% in Eugene — top-decile yield for the area; either an underpriced asset or a hidden risk that comps aren't pricing in. Stress-test before assuming the spread holds.
Location & tenants
- Location reads 81/100 on livability (#52 in OR, #1,587 nationally) — a professional / high-income tenant draw. Strengths: amenities A+, commute A+, health & safety A+; Watch: employment C-, cost of living C-, crime D-.
- Bethel SD 52 (urban): math 18% / reading 34% proficiency, ranked #52 of 58 in OR (top 90%) — low school quality limits family demand, transient renter base, plan for 1-2y turnover.
- Zoned schools: Clear Lake Elementary School (math 5% / reading 30%, grade F, #384 of 412 statewide, top 93%, 300 students, 64% FRL); Shasta Middle School (math 12% / reading 37%, grade F, #108 of 128 statewide, top 89%, 392 students, 66% FRL); Willamette High School (math 24% / reading 50%, grade F, #85 of 143 statewide, top 61%, 1,516 students, 35% FRL).
- Market conditions: Rents rising (+1.6%/yr); 302 active listings in the ZIP; 10 comparable units currently listed for rent nearby; rentals at typical pace (median 15d on market — plan ~3-4 weeks tenant-placement turnaround); 1,808 units permitted in Lane County in 2024 (972 in 5+ unit buildings).
- This rent runs 37% of the median local income ($58k/yr) — at the standard rent-burdened threshold; future hikes will face affordability resistance.
Forward outlook
- Local home prices are declining (-3.0%/yr); year-one equity from $449 of loan paydown is wiped out by about $2k of value loss. Plan a longer hold.
- Lane County population projected at +15% by 2050 — long-run rental-demand tailwind backs the buy-and-hold thesis.
Negotiation context
- It's been on market 102 days — a 9% lower offer ($59k) is reasonable based on typical stale-listing flexibility.
- 2 sale attempts since 6y ago with the ask held roughly flat each time — persistent listings suggest the price (not the market) is what's stuck; bring a comps-based counter.
- Current owner paid $28k; list at $65k implies a 133% gain — meaningful room to come down on a strong offer.
Risks & watch-outs
- Watch-outs: HOA is 41% of rent.
Questions for the listing agent
- It's been on market 102 days. Have you received any prior offers? Is the seller open to a 9% concession, seller financing, or rate buy-down credit?
- Built in 1978 — when were the roof, HVAC, electrical panel, plumbing, and water heater last replaced?
- What does the HOA fee cover, when was the last increase, and are there any pending special assessments or reserve-fund shortfalls?
- Why hasn't it sold? Are there any deal-killer items the seller is aware of (foundation, flood, title, zoning, code violations)?
- Is there a deadline driving the sale (1031 exchange, divorce, estate, relocation)? That informs how much negotiation room exists.
- Schools are B-rated — typically a magnet for longer-tenancy family renters. What's the average tenant stay here, and is there a school-zone premium baked into asking?
- Crime grade is D in this area — have there been break-ins, vandalism, or insurance claims at this property in the last 3 years? What carrier currently insures it and at what premium?
- What's the average days-on-market for RENTAL listings here right now (not sales)? A rising rental-DOM trend means longer vacancies and softer asking-rent achievability than the comps imply.
- What's the recent tenant-quality profile in this submarket — average credit score on applications, eviction rate, late-payment / NSF rate, and stable-employment percentage? A property-management company in the area should have these aggregated.
- How much new for-sale + rental construction is in the pipeline within 1–3 miles? Heavy new supply typically softens prices + rents 12–24 months out; constrained supply supports both.
Investment metrics
- 1% rule
- 2.72% ✓
- Cap rate
- 10.40%
- Cash-on-cash
- 14.66%
- DSCR
- 1.65
- GRM
- 3.1
CMA / ARV
- ARV (median comp)
- $74,120
- List price
- $65,000
- Delta
- -12.30%
- Verdict
- UNDERPRICED
- Comps
- 20 within 1.0 mi
Show comp detail 12 sales within ~0.75 mi
| Address | Dist | Beds/Ba | Sqft | Sold | Price | $/sf | Match |
|---|---|---|---|---|---|---|---|
| 4800 Barger Dr #80 | 0.00mi | 2/1.0 | 924 (0%) | 7mo | $77,000 | $83 | 94 |
| 4800 Barger Dr #76 | 0.00mi | 2/1.0 | 924 (0%) | 8mo | $59,000 | $64 | 94 |
| 1400 Candlelight Dr #226 | 0.15mi | 2/1.0 | 924 (0%) | 2mo | $48,000 | $52 | 91 |
| 4800 Barger Dr #25 | 0.00mi | 2/2.0 | 924 (0%) | 7mo | $70,000 | $76 | 90 |
| 1400 Candlelight Dr #110 | 0.15mi | 2/2.0 | 924 (0%) | 13mo | $37,500 | $41 | 78 |
| 1199 N Terry St #258 | 0.53mi | 2/1.0 | 924 (0%) | 0mo | $64,900 | $70 | 75 |
| 1199 N Terry St | 0.50mi | 2/1.0 | 924 (0%) | 3mo | $81,000 | $88 | 74 |
| 1199 N Terry St #248 | 0.53mi | 2/1.0 | 924 (0%) | 3mo | $71,000 | $77 | 73 |
| 1199 N Terry St #315 | 0.53mi | 2/2.0 | 960 (+4%) | 9mo | $75,000 | $78 | 57 |
| 1199 N Terry St #264 | 0.53mi | 2/1.0 | 840 (-9%) | 7mo | $52,000 | $62 | 54 |
| 1400 Candlelight Dr #232 | 0.15mi | 2/2.0 | 1,056 (+14%) | 14mo | $166,000 | $157 | 54 |
| 5439 Olympic Cir | 0.40mi | 3/2.0 (+1) | 1,040 (+13%) | 12mo | $322,000 | $310 | 41 |
Match score weights: distance 35% · size 25% · config 20% · recency 20%. Top-matched comps best support the ARV.
Projected returns pro-forma
-3.0% appreciation · 1.58% rent growth · sell at horizon
- IRR
- 2.4%
- Equity multiple
- 1.09×
- Total profit
- $1,612
- Equity at exit
- $9,692
- IRR
- 9.4%
- Equity multiple
- 1.64×
- Total profit
- $11,623
- Equity at exit
- $5,620
Cash invested: $18,200 (down + closing). Projections, not guarantees.
Landlord ↔ Tenant lean methodology
- Overall (STATE)
- 28 Tenant-Leaning
- State Oregon
- 28 Tenant-Leaning · D+6
- County
- — inherits STATE
- City
- — inherits STATE
ZIP-level market 97402
- Rents YoY
- 1.6%
- Active inventory
- 302
- Price-to-rent
- 3.1×
Monthly cashflow live
- Estimated rent
- $1,769 high interval (Pro) →
- Mortgage (P&I)
- −$341
- Tax est. 1.5%
- −$81 /mo · $975/yr
- Insurance
- −$27
- HOA
- −$726
- Vacancy / Maint / Mgmt
- −$372
- Net cashflow
- $222
Break-even live
Sensitivity live
| Price | -10% $267 | -5% $245 | +0% $222 | +5% $200 | +10% $177 |
|---|---|---|---|---|---|
| Rent | -10% $83 | -5% $153 | +0% $222 | +5% $292 | +10% $362 |
| Rate | -1.0pp $255 | -0.5pp $239 | base $222 | +0.5pp $206 | +1.0pp $188 |
UW: 25.0% down · 7.5% · 30yr · 1.5% tax · 5.0% vac · 8.0% maint · 8.0% mgmt
Financing live
Cash to close
- Down payment
- $16,250
- Closing costs
- $1,950
- Reserves months
- —
- Total cash needed
- —
Loan-product check · same deal, 3 products live
Conventional
25% down · 7.5% · 30yr
- Down + closing
- —
- Monthly P&I
- —
- Monthly cashflow
- —
- DSCR
- —
- Eligible?
- —
Personal DTI + credit; lowest rate.
DSCR
20% down · 8.5% · 30yr
- Down + closing
- —
- Monthly P&I
- —
- Monthly cashflow
- —
- DSCR
- —
- Eligible?
- —
No personal income docs; deal must DSCR.
Hard money
10% down · 12.0% · 12mo
- Down + closing
- —
- Monthly P&I
- —
- Monthly cashflow
- —
- DSCR
- —
- Eligible?
- —
Short-term bridge; refi at stabilization.
Rent comps 10 comps
| Address | Beds | Baths | Sqft | Rent | $/sqft | DOM | Units | Dist |
|---|---|---|---|---|---|---|---|---|
| 1040 Lamplite Ln Eugene, OR | 3.0 | 1.0 | 912 | $1,895 | $2.08 | 45d | 1 | 0.57mi |
| 4175 Wagner St Eugene, OR | 1.0–2.0 | 1.0 | 743 | $1,645 | $2.21 | 15d | 1 | 0.81mi |
| 4175 Quest Dr Eugene, OR | 1.0–3.0 | 1.0–2.0 | 983 | $1,710 | $1.74 | 15d | 6 | 0.82mi |
| 4075 Aerial Way Eugene, OR | 1.0–2.0 | 1.0–2.0 | 847 | $2,155 | $2.54 | 15d | 24 | 0.92mi |
| 573 Hanover St Eugene, OR | 2.0 | 1.0 | 775 | $1,495 | $1.93 | 45d | 1 | 1.09mi |
| 543 Hanover St Eugene, OR | 2.0 | 1.0 | 710 | $1,725 | $2.43 | 15d | 1 | 1.11mi |
| 3700 Riviera Eugene, OR | 2.0 | 2.0 | 968 | $1,662 | $1.72 | 15d | 2 | 1.19mi |
| 4478 Fergus Ave Eugene, OR | 3.0 | 1.5 | 1120 | $1,695 | $1.51 | 45d | 1 | 1.20mi |
| 1920 Taft St Eugene, OR | 3.0 | 1.5 | 966 | $1,850 | $1.92 | 15d | 1 | 1.26mi |
| 1190 Taft St Unit 1190 Eugene, OR | 3.0 | 1.0 | 1116 | $1,650 | $1.48 | 22d | 1 | 1.35mi |
HOA detail
- Monthly dues
- $726 · $8,712/yr
Listing history 19 events
-
2026-06-21days on market $65,000 Active 102 DOM
-
2026-06-18days on market $65,000 Active 99 DOM
-
2026-06-17days on market $65,000 Active 98 DOM
-
2026-06-16days on market $65,000 Active 97 DOM
-
2026-06-15days on market $65,000 Active 96 DOM
-
2026-06-14days on market $65,000 Active 94 DOM
-
2026-06-10days on market $65,000 Active 91 DOM
-
2026-06-09days on market $65,000 Active 90 DOM
-
2026-06-08days on market $65,000 Active 89 DOM
-
2026-06-07days on market $65,000 Active 88 DOM
-
2026-06-03days on market $65,000 Active 84 DOM
-
2026-06-02days on market $65,000 Active 83 DOM
-
2026-06-01days on market $65,000 Active 82 DOM
-
2026-05-31days on market $65,000 Active 81 DOM
-
2026-05-30days on market $65,000 Active 80 DOM
-
2026-03-11$65,000 Active 410-char remark
Show marketing remark (410 chars)
Back on market now that the brand new flooring is installed. The home in this 55 and older park has been recently painted and ready for a new owner. This affordable home is perfect for the owner who wants affordable housing AND... a bigger than normal lot for picnics in the back yard during those upcoming spring and summer days. The fact that the extra large lot provides room for a garden and is a real plus
-
2020-07-06soldstatus $27,900 Sold 401-char remark
Show marketing remark (401 chars)
Easy living in popular 55+ Briarwood park with this sweet, 2 bedroom, Skyline manufactured home. Appreciate front dining w/built-in hutch, kitchen w/all appliances, and insulated vinyl windows and heat pump for economy! Nicely landscaped and in a great location in park; close to clubhouse. Briarwood offers seasonal pool, hot tub, weight room, library, tennis court, activities, and even a dog park!
-
2020-06-06status Pending 401-char remark
Show marketing remark (401 chars)
Easy living in popular 55+ Briarwood park with this sweet, 2 bedroom, Skyline manufactured home. Appreciate front dining w/built-in hutch, kitchen w/all appliances, and insulated vinyl windows and heat pump for economy! Nicely landscaped and in a great location in park; close to clubhouse. Briarwood offers seasonal pool, hot tub, weight room, library, tennis court, activities, and even a dog park!
-
2020-06-03$27,900 Active 401-char remark
Show marketing remark (401 chars)
Easy living in popular 55+ Briarwood park with this sweet, 2 bedroom, Skyline manufactured home. Appreciate front dining w/built-in hutch, kitchen w/all appliances, and insulated vinyl windows and heat pump for economy! Nicely landscaped and in a great location in park; close to clubhouse. Briarwood offers seasonal pool, hot tub, weight room, library, tennis court, activities, and even a dog park!
ⓘ Source: listings_history table (triggers on properties + properties_extension) + one-shot
backfill from property_details.listing_events for pre-trigger history.
Climate risk First Street
- Flood 1/10 Low FEMA zone X (unshaded) · 0% chance over 30 yrs
- Wildfire 4/10 Moderate
- Heat 4/10 Moderate 7 d/yr ≥92°F today · 15 d/yr by 30 yrs out
- Wind 1/10 Low
- Air quality 10/10 Extreme 13 unhealthy d/yr today · 14 by 30 yrs out
Nearby sold comps map
Loading sold comps map…
Walkable amenities ~0.75 mi
Loading nearby amenities…
Taxation est. · year 1
- Rental income
- $21,229
- − Mortgage interest
- −$3,641
- − Property taxes
- −$975
- − Insurance
- −$325
- − Repairs & maintenance
- −$1,698
- − Management
- −$1,698
- − HOA
- −$8,712
- − Depreciation
- −$1,891
- Taxable income
- $2,289
- Est. tax owed @ 24.0%
- −$549
- After-tax cash flow
- $2,119/yr
For passive investors: Depreciation is non-cash, so a rental often shows a tax loss while cash-flowing — sheltering income. Rental losses are passive: they offset passive income freely, and up to $25,000/yr can offset ordinary (W-2) income if you actively participate and your MAGI is under $100k (phasing out to $0 by $150k); unused losses carry forward. On sale, claimed depreciation is recaptured at up to 25%, and gains may owe capital-gains tax (a 1031 exchange can defer both). Figures are a year-1 estimate at your 24.0% rate — not tax advice; consult a CPA.
Schools (NCES district)
- District
- Bethel SD 52
- NCES district ID
- 4102040
- Math proficiency
- 18% ▼ -14.00%
- Reading proficiency
- 34% ▼ -14.00%
- Median HH income
- $47,860
- Composite
- 22.62/100
- National rank
- #8066
- State rank
- #52 of 58 in OR
Livability — Eugene
- Score
- 81/100
- State rank
- #52
- US rank
- #1587
Category grades
Schools grade is shown separately in the Schools card above.
Census & demographics
- Census place
- Eugene, OR
- County
- Lane County · 310,476 people
- City population
- 215,212
- Metro
- Eugene-Springfield, OR
- Population (ZIP)
- 53,823
- Household income
- $57,658
- Rent vs Own
- Severe rent burden
- 3142.0
Population outlook (Lane County) Hauer SSP2
- Today (2025)
- 391,933 people
- By 2030
- 405,860 · +3.6%
- By 2040
- 429,386 · +9.6%
- By 2050
- 452,016 · +15.3%
- By 2075
- 508,825 · +29.8%
- By 2100
- 531,208 · +35.5%
Race, ethnicity, and origin ACS 2023
- Neighborhood character
- Predominantly White (72%)
- Race & ethnicity
- White 72% Hispanic / Latino 17% Two or more races 11% Asian 2% Black 2%
- Hispanic origin (detail)
- Mexican 12%
- Common ancestry
- Italian 4% Lithuanian 3% Portuguese 3%
- Foreign-born
- 7% · Canada, China, Vietnam
- Languages at home
- 88% English-only · Spanish 9% Other Indo-European 1%
Political lean MEDSL · Lane
- 2024 margin
- Strong D (+23.1) · D 60.0% · R 36.9% · Other 3.1%
- 2008→2024 swing
- -4.3pp toward R · 2008: 27.4pp · 2024: 23.1pp
- All cycles
- 2024: D+23.1 2020: D+24.3 2016: D+18.9 2012: D+23.4 2008: D+27.4
Not yet ingested
- Civics
- —
Market trends
- HPI YoY
- ▼ -437.20%
- Current HPI
- 298.1167
- Rent YoY
- ▲ 1.58%
- Metro
- Eugene-Springfield, OR
- State GDP YoY
- ▲ 2.05%
- F500 in state
- 2
Industry mix (Fortune 500 HQ in OR)
| Industry | F500 HQs | Revenue |
|---|---|---|
| Consumer Goods | 1 | $51B |
|
||
Price history
+133.0% since first listed4 events — show timeline
- 2026-03-11 Listed $65,000 RMLS
- 2020-07-06 Sold (MLS) $27,900 RMLS
- 2020-06-06 Pending — RMLS
- 2020-06-03 Listed $27,900 RMLS
Property tax history
-44.9%/yrLatest (2015): $6 · +0.0% YoY. Source: county tax records.
Cash-flow waterfall
monthlySold comps — $/sqft
last 12 mo · ≤1 miLoading sold comps…