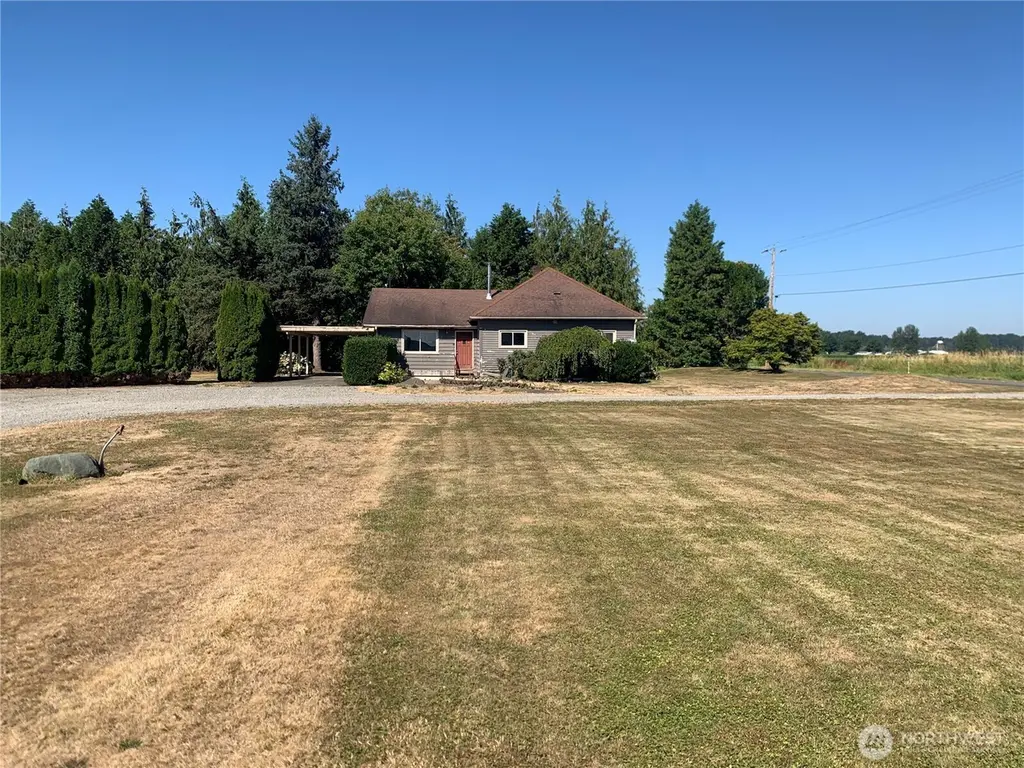
3037 Massey Rd · Everson, WA
Flood risk No data
- FEMA flood zone
- —
- Chance of flooding over 30 yrs
- —
- Est. flood insurance / yr
- —
Fire risk No data
- Est. fire insurance / yr
- —
Heat risk No data
- Hot days now (above threshold)
- —
- Hot days in 30 yrs
- —
Wind risk No data
- Chance of severe wind over 30 yrs
- —
Air-quality risk No data
- Unhealthy air days now
- —
- Unhealthy air days in 30 yrs
- —
Risk factors via First Street. Map © Google.
Why this score? — see what drove the D grade
The composite is a weighted blend of 9 inputs, each scored 0–100. Each bar is that input's sub-score; the figure is the points it added to the 100-point composite (weight × sub-score).
- ARV discount +15.0/15.0
- Appreciation +10.0/10.0
- Schools +5.5/10.0
- Livability +3.4/5.0
- Cash flow +3.3/30.0
- Rent growth +2.5/5.0
- Condition / age +2.5/5.0
- 1% rule +0.0/10.0
- DSCR +0.0/10.0
$434,900
🖨 Deal sheet 📄 Offer letter ✓ Due diligence
Listing remarks
Unlock the Potential – 1.55 Acres, 9200+ SqFt of Outbuildings, Endless Possibilities! Bring your vision to this 1,548 sq ft fixer-upper, nestled on a generous 1.55-acre lot. With over 9,200 sq ft of permitted outbuildings, the opportunities here are vast — whether you're dreaming of a workshop, storage, or something entirely unique. The home itself is ready for a full makeover, offering a blank canvas for your creativity. The outbuildings, though in need of some TLC, hold incredible potential for transformation. Whether you're an investor, entrepreneur, or someone looking to build a live-work space, this property is your opportunity to make it truly special
Key facts
- Blank canvas
- 1.55 acres
- Incredible potential
Tags
Neighborhood map
What this means for you Summary
Snapshot
- This is a 3-bed/2.0-bath single-family listed at $435k.
Deal economics
- At list price, monthly cash flow is $-1k ($-16k/yr) — negative.
- To cash-flow at today's rent, offer at most $194k (55.3% below list).
- To meet the 1% rule (rent ≥ 1% of price), the offer needs to be $219k (49.6% below list).
- Recommended offer: $194k (55.3% below list) — sets the bar for cash-flow.
Location & tenants
- Location reads 67/100 on livability (#294 in WA) — a middle-class / working-renter tenant base. Strengths: crime A+, commute A, housing A; Watch: schools C-, employment C-, cost of living C-.
- Nooksack Valley School District (rural): math 59% / reading 65% proficiency, ranked #50 of 291 in WA (top 17%) — acceptable for families but not a draw, mixed tenant base, ~2y average lease.
- Market conditions: 62 active listings in the ZIP; 5 comparable units currently listed for rent nearby; rentals leasing fast (median 14d on market — plan ~1-2 weeks tenant-placement turnaround); solid renter incomes; 1,190 units permitted in Whatcom County in 2024 (327 in 5+ unit buildings).
Forward outlook
- In year one you build about $46k of equity ($3k loan paydown + $43k appreciation (10.0% local appreciation)).
- Whatcom County population projected at +28% by 2050 — long-run rental-demand tailwind backs the buy-and-hold thesis.
- By year 2, paydown + projected appreciation supports a ~$75k cash-out refi (75% LTV) — recoverable capital for the next deal without selling this one.
Negotiation context
- It's been on market 113 days — a 9% lower offer ($396k) is reasonable based on typical stale-listing flexibility.
- 2 sale attempts; this cycle's ask has dropped $64k (13%) from the opening price — seller is motivated, your offer sets the floor, not the list.
Risks & watch-outs
- Watch-outs: built in 1900 — expect roof / HVAC / electrical / plumbing capex.
Questions for the listing agent
- What do current leases actually rent for vs. the listed asking? Can we see a recent rent roll and the last 12 months of T-12 income?
- It's been on market 113 days. Have you received any prior offers? Is the seller open to a 55% concession, seller financing, or rate buy-down credit?
- Built in 1900 — when were the roof, HVAC, electrical panel, plumbing, and water heater last replaced?
- Why hasn't it sold? Are there any deal-killer items the seller is aware of (foundation, flood, title, zoning, code violations)?
- Is there a deadline driving the sale (1031 exchange, divorce, estate, relocation)? That informs how much negotiation room exists.
- The area grade is low — what's the realistic commute time and amenity access for the typical tenant pool here? Any planned neighborhood developments (good or bad) we should know about?
- What's the average days-on-market for RENTAL listings here right now (not sales)? A rising rental-DOM trend means longer vacancies and softer asking-rent achievability than the comps imply.
- What's the recent tenant-quality profile in this submarket — average credit score on applications, eviction rate, late-payment / NSF rate, and stable-employment percentage? A property-management company in the area should have these aggregated.
- How much new for-sale + rental construction is in the pipeline within 1–3 miles? Heavy new supply typically softens prices + rents 12–24 months out; constrained supply supports both.
Investment metrics
- 1% rule
- 0.50% ✗
- Cap rate
- 2.54%
- Cash-on-cash
- -13.42%
- DSCR
- 0.40
- GRM
- 16.5
CMA / ARV
- ARV (median comp)
- $562,303
- List price
- $434,900
- Delta
- -22.66%
- Verdict
- UNDERPRICED
- Comps
- 6 within 1.0 mi
Show comp detail 1 sale within ~0.75 mi
| Address | Dist | Beds/Ba | Sqft | Sold | Price | $/sf | Match |
|---|---|---|---|---|---|---|---|
| 7420 Emerson Rd | 0.61mi | 3/1.0 | 1,392 (-10%) | 9mo | $570,000 | $409 | 44 |
Match score weights: distance 35% · size 25% · config 20% · recency 20%. Top-matched comps best support the ARV.
Projected returns pro-forma
10.0% appreciation · 3.0% rent growth · sell at horizon
- IRR
- 14.9%
- Equity multiple
- 2.23×
- Total profit
- $150,242
- Equity at exit
- $391,792
- IRR
- 14.7%
- Equity multiple
- 5.19×
- Total profit
- $510,792
- Equity at exit
- $844,915
Cash invested: $121,772 (down + closing). Projections, not guarantees.
Landlord ↔ Tenant lean methodology
- Overall (STATE)
- 28 Tenant-Leaning
- State Washington
- 28 Tenant-Leaning · D+8
- County
- — inherits STATE
- City
- — inherits STATE
ZIP-level market 98247
- Home prices YoY
- 2.2%
- Active inventory
- 62
- Price-to-rent
- 16.5×
Monthly cashflow live
- Estimated rent
- $2,191 high interval (Pro) →
- Mortgage (P&I)
- −$2,281
- Tax from tax record
- −$631 /mo · $7,568/yr
- Insurance
- −$181
- HOA
- −$0
- Vacancy / Maint / Mgmt
- −$460
- Net cashflow
- $-1,361
Break-even live
UW: 25.0% down · 7.5% · 30yr · 1.5% tax · 5.0% vac · 8.0% maint · 8.0% mgmt
Financing live
Cash to close
- Down payment
- $108,725
- Closing costs
- $13,047
- Reserves months
- —
- Total cash needed
- —
Loan-product check · same deal, 3 products live
Conventional
25% down · 7.5% · 30yr
- Down + closing
- —
- Monthly P&I
- —
- Monthly cashflow
- —
- DSCR
- —
- Eligible?
- —
Personal DTI + credit; lowest rate.
DSCR
20% down · 8.5% · 30yr
- Down + closing
- —
- Monthly P&I
- —
- Monthly cashflow
- —
- DSCR
- —
- Eligible?
- —
No personal income docs; deal must DSCR.
Hard money
10% down · 12.0% · 12mo
- Down + closing
- —
- Monthly P&I
- —
- Monthly cashflow
- —
- DSCR
- —
- Eligible?
- —
Short-term bridge; refi at stabilization.
Rent comps 5 comps
| Address | Beds | Baths | Sqft | Rent | $/sqft | DOM | Units | Dist |
|---|---|---|---|---|---|---|---|---|
| 103 Thendara Park Dr Everson, WA | 2.0 | 2.0 | 1075 | $1,800 | $1.67 | 13d | 1 | 1.03mi |
| 103 Thendara Park Dr Unit D Everson, WA | 2.0 | 1.5 | 1075 | $1,800 | $1.67 | 13d | 1 | 1.03mi |
| 313 E Main St Everson, WA | 3.0 | 2.0 | 1170 | $2,350 | $2.01 | 13d | 1 | 1.14mi |
| 211 Baker St Unit C Everson, WA | 2.0 | 3.0 | 1400 | $2,200 | $1.57 | 13d | 1 | 1.21mi |
| 110 W 3rd St Everson, WA | 3.0 | 2.0 | 1300 | $2,000 | $1.54 | 21d | 1 | 1.41mi |
Listing history 20 events
-
2026-06-18days on market $434,900 Active 113 DOM
-
2026-06-17days on market $434,900 Active 112 DOM
-
2026-06-16days on market $434,900 Active 111 DOM
-
2026-06-15days on market $434,900 Active 110 DOM
-
2026-06-14days on market $434,900 Active 108 DOM
-
2026-06-13days on market $434,900 Active 107 DOM
-
2026-06-10days on market $434,900 Active 105 DOM
-
2026-06-09days on market $434,900 Active 104 DOM
-
2026-06-08days on market $434,900 Active 103 DOM
-
2026-06-07days on market $434,900 Active 102 DOM
-
2026-06-02days on market $434,900 Active 97 DOM
-
2026-06-01days on market $434,900 Active 96 DOM
-
2026-05-31days on market $434,900 Active 95 DOM
-
2026-05-30days on market $434,900 Active 94 DOM
-
2026-04-29status Active
-
2026-04-29price $434,900
-
2025-09-30status Pending
-
2025-09-12price $449,000
-
2025-08-22price $475,000
-
2025-07-29$499,000 Active
ⓘ Source: listings_history table (triggers on properties + properties_extension) + one-shot
backfill from property_details.listing_events for pre-trigger history.
Tax reassessment forecast WA · Resets to sale price
- Current annual tax
- $7,568 · $631/mo
- Projected year-2 tax
- $7,568 · $631/mo
- Expected delta
- $0/yr ($0/mo · -0.0%)
ⓘ Screening estimate from a state-policy table — verify with the county assessor before closing.
Nearby sold comps map
Loading sold comps map…
Walkable amenities ~0.75 mi
Loading nearby amenities…
Taxation est. · year 1
- Rental income
- $26,298
- − Mortgage interest
- −$24,361
- − Property taxes
- −$7,568
- − Insurance
- −$2,174
- − Repairs & maintenance
- −$2,104
- − Management
- −$2,104
- − Depreciation
- −$12,652
- Taxable loss
- −$24,666
- Est. tax savings @ 24.0%
- +$5,920
- After-tax cash flow
- $-10,416/yr
For passive investors: Depreciation is non-cash, so a rental often shows a tax loss while cash-flowing — sheltering income. Rental losses are passive: they offset passive income freely, and up to $25,000/yr can offset ordinary (W-2) income if you actively participate and your MAGI is under $100k (phasing out to $0 by $150k); unused losses carry forward. On sale, claimed depreciation is recaptured at up to 25%, and gains may owe capital-gains tax (a 1031 exchange can defer both). Figures are a year-1 estimate at your 24.0% rate — not tax advice; consult a CPA.
Schools (NCES district)
- District
- Nooksack Valley School District
- NCES district ID
- 5305670
- Math proficiency
- 59% ▲ 1.00%
- Reading proficiency
- 65% ▼ -3.00%
- Median HH income
- $55,264
- Composite
- 54.76/100
- National rank
- #2832
- State rank
- #50 of 291 in WA
Livability — Everson
- Score
- 67/100
- State rank
- #294
- US rank
- #10287
Category grades
Schools grade is shown separately in the Schools card above.
Census & demographics
- County
- Whatcom County · 209,776 people
- Metro
- Bellingham, WA
- Population (ZIP)
- 9,115
- Household income
- $88,724
- Rent vs Own
- Severe rent burden
- 342.0
Population outlook (Whatcom County) Hauer SSP2
- Today (2025)
- 240,408 people
- By 2030
- 254,667 · +5.9%
- By 2040
- 281,365 · +17.0%
- By 2050
- 307,592 · +27.9%
- By 2075
- 375,576 · +56.2%
- By 2100
- 421,637 · +75.4%
Race, ethnicity, and origin ACS 2023
- Neighborhood character
- Predominantly White (72%)
- Race & ethnicity
- White 72% Hispanic / Latino 19% Two or more races 8% Asian 3% Native American 3%
- Hispanic origin (detail)
- Mexican 17%
- Common ancestry
- Iranian 12% Portuguese 4% Italian 3%
- Foreign-born
- 12% · Canada, Vietnam, China
- Languages at home
- 82% English-only · Spanish 14% Vietnamese 2% German/W. Germanic 1%
Political lean MEDSL · Whatcom
- 2024 margin
- Strong D (+24.9) · D 60.8% · R 35.9% · Other 3.3%
- 2008→2024 swing
- +6.9pp toward D · 2008: 18.0pp · 2024: 24.9pp
- All cycles
- 2024: D+24.9 2020: D+23.9 2016: D+17.7 2012: D+12.1 2008: D+18.0
Not yet ingested
- Civics
- —
Market trends
- HPI YoY
- ▲ 15.90%
- Current HPI
- 744.59
- Rent YoY
- —
- Metro
- Bellingham, WA
- State GDP YoY
- ▲ 4.65%
- F500 in state
- 22
Industry mix (Fortune 500 HQ in WA)
| Industry | F500 HQs | Revenue |
|---|---|---|
| Retail | 2 | $269B |
|
||
| Technology / Retail | 1 | $638B |
|
||
| Technology | 1 | $245B |
|
||
| Telecommunications | 1 | $38B |
|
||
| Food / Beverage | 1 | $36B |
|
||
| Automotive / Trucks | 1 | $34B |
|
||
Price history
-12.8% since first listed6 events — show timeline
- 2026-04-29 Relisted — NWMLS as Distributed by MLS Grid
- 2026-04-29 Price Changed $434,900 NWMLS as Distributed by MLS Grid
- 2025-09-30 Pending — NWMLS as Distributed by MLS Grid
- 2025-09-12 Price Changed $449,000 NWMLS as Distributed by MLS Grid
- 2025-08-22 Price Changed $475,000 NWMLS as Distributed by MLS Grid
- 2025-07-29 Listed $499,000 NWMLS as Distributed by MLS Grid
Property tax history
+6.5%/yrLatest (2017): $7,568 · +0.3% YoY. Source: county tax records.
Cash-flow waterfall
monthlySold comps — $/sqft
last 12 mo · ≤1 miLoading sold comps…