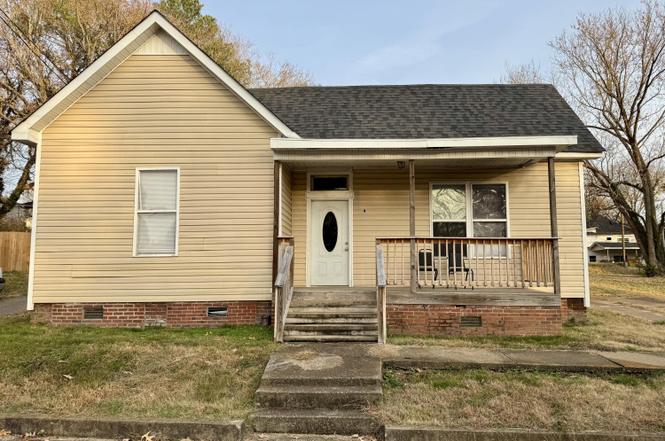
124 Glendale St · Jackson, TN
Flood risk 1/10 · Minimal
- FEMA flood zone
- X (unshaded)
- Chance of flooding over 30 yrs
- 0.0%
- Est. flood insurance / yr
- $507 – $1,088
Fire risk 1/10 · Minimal
- Est. fire insurance / yr
- $949 – $1,763
Heat risk 6/10 · Moderate
- Hot days now (above 108°F)
- 7 days/yr
- Hot days in 30 yrs
- 20 days/yr
Wind risk 4/10 · Minor
- Chance of severe wind over 30 yrs
- 15.0%
Air-quality risk 1/10 · Minimal
- Unhealthy air days now
- 0 days/yr
- Unhealthy air days in 30 yrs
- 0 days/yr
Risk factors via First Street. Map © Google.
Why this score? — see what drove the B- grade
The composite is a weighted blend of 9 inputs, each scored 0–100. Each bar is that input's sub-score; the figure is the points it added to the 100-point composite (weight × sub-score).
- Cash flow +27.3/30.0
- ARV discount +15.0/15.0
- DSCR +9.5/10.0
- 1% rule +6.6/10.0
- Rent growth +3.8/5.0
- Livability +3.1/5.0
- Condition / age +2.5/5.0
- Schools +1.2/10.0
- Appreciation +0.0/10.0
$149,500
🖨 Deal sheet (PDF) 📄 Offer letter ✓ Due diligence
Listing remarks
124 Glendale Street, a freshly updated 3-bedroom, 2-bath, 1,700sqft home that's move-in ready. The roof is only about 5 years old, and the HVAC system and furnace were both replaced roughly 2-3 years ago. The windows were updated just 3 years ago as well, which helps keep energy costs down. The dining room floor was replaced about 3 years ago, the kitchen was updated around the same time, and the bathroom received a refresh just 2 years ago. Plumbing and electrical has been replaced in the last 5 years. Conveniently located in Jackson's 38301 area, the home is close to downtown restaurants, shopping, parks, and everyday essentials. It's also near Arlington Elementary, North Parkway Middle,
Key facts
- Updated windows
- Updated kitchen
- Replaced plumbing
Tags
Property features AI
Exterior
- Parking: 3 parking spaces
- Utilities: Public water; Public sewer; 200+ amp electric service; Natural gas available and connected; Cable available; Electricity connected; Water connected; Sewer connected
- Home design: Single-family residence; One-level / 1 story; Residential zoning; Entry faces unspecified
- Construction: Brick and vinyl siding exterior; Shingle roof; Raised foundation; Built in (year not provided)
- Exterior features: Covered front porch; Shed(s); Corner lot; Concrete road frontage (city street); Publicly maintained road
Interior
- Kitchen: Built-in gas oven; Gas range; Refrigerator
- Bedrooms: 3 main-level bedrooms
- Bathrooms: 2 full bathrooms (both on main level)
- Heating & cooling: Central heating; Central air conditioning
- Interior features: Breakfast bar; Eat-in kitchen; High ceilings; Kitchen island; Laminate countertops; Open floorplan; Walk-in closet(s)
- Laundry & utility: Laundry room with washer and gas dryer hookups
Neighborhood map
What this means for you Summary
Snapshot
- This is a 3-bed/3.0-bath single-family listed at $150k.
Deal economics
- At list price, monthly cash flow is $434 ($5k/yr) — positive.
- The deal already cash-flows at list — no discount required.
- Meets the 1% rule at list price ($2k rent vs $150k).
- Recommended offer: $132k (12.0% below list) — sets the bar for market timing.
- Cap rate 9.8% vs local median 3.6% in Jackson — top-decile yield for the area; either an underpriced asset or a hidden risk that comps aren't pricing in. Stress-test before assuming the spread holds.
Location & tenants
- Location reads 62/100 on livability (#216 in TN) — a middle-class / working-renter tenant base. Strengths: cost of living A+, housing A+; Watch: health & safety C-, schools F, crime F.
- Madison County (urban): math 10% / reading 17% proficiency, ranked #131 of 139 in TN (top 94%) — low school quality limits family demand, transient renter base, plan for 1-2y turnover; 68% free/reduced lunch — lower-income household profile, screen leases tightly.
- Market conditions: Rents rising fast (+5.2%/yr); 254 active listings in the ZIP; 1 comparable units currently listed for rent nearby; lower-income renter base — watch delinquency; 247 units permitted in Madison County in 2024 (0 in 5+ unit buildings).
- At $1,737/mo this rent would consume 48% of the median local household income ($43k/yr) (locally 1701% of renters already pay >50% of income on rent) — very limited rent-growth headroom before tenants either downsize or default.
Forward outlook
- Local home prices are declining (-3.0%/yr); year-one equity from $1k of loan paydown is wiped out by about $4k of value loss. Plan a longer hold.
- Madison County population projected at -12% by 2050 — secular population decline; favor cash flow + early exit over multi-decade hold.
- At projected returns (-3.0% appreciation + 5.2% rent growth), your $42k cash investment doubles in ~8 years — after that, you're playing with house money.
Negotiation context
- It's been on market 199 days — a 12% lower offer ($132k) is reasonable based on typical stale-listing flexibility.
- 3 sale attempts since 2y ago; this cycle's ask has dropped $30k (17%) from the opening price — seller is motivated, your offer sets the floor, not the list.
Risks & watch-outs
- Watch-outs: built in 1935 — expect roof / HVAC / electrical / plumbing capex.
- Climate carrying-cost: extreme-heat days projected 7→20/yr by 2055 (HVAC capex compounding) — expect insurance premiums to compound above CPI over the hold.
Questions for the listing agent
- It's been on market 199 days. Have you received any prior offers? Is the seller open to a 12% concession, seller financing, or rate buy-down credit?
- Built in 1935 — when were the roof, HVAC, electrical panel, plumbing, and water heater last replaced?
- Why hasn't it sold? Are there any deal-killer items the seller is aware of (foundation, flood, title, zoning, code violations)?
- Is there a deadline driving the sale (1031 exchange, divorce, estate, relocation)? That informs how much negotiation room exists.
- Schools are F-rated, which usually means shorter tenancies and higher turnover. Who's the typical renter profile here, and what's been the actual vacancy rate?
- Crime grade is F in this area — have there been break-ins, vandalism, or insurance claims at this property in the last 3 years? What carrier currently insures it and at what premium?
- What's the average days-on-market for RENTAL listings here right now (not sales)? A rising rental-DOM trend means longer vacancies and softer asking-rent achievability than the comps imply.
- What's the recent tenant-quality profile in this submarket — average credit score on applications, eviction rate, late-payment / NSF rate, and stable-employment percentage? A property-management company in the area should have these aggregated.
- How much new for-sale + rental construction is in the pipeline within 1–3 miles? Heavy new supply typically softens prices + rents 12–24 months out; constrained supply supports both.
Investment metrics
- 1% rule
- 1.16% ✓
- Cap rate
- 9.77%
- Cash-on-cash
- 12.43%
- DSCR
- 1.55
- GRM
- 7.2
CMA / ARV
- ARV (on-the-fly)
- $237,580
- Comps found
- 12
Show comp detail 12 sales within ~0.75 mi
| Address | Dist | Beds/Ba | Sqft | Sold | Price | $/sf | Match |
|---|---|---|---|---|---|---|---|
| 200 Lambuth Blvd | 0.14mi | 3/2.0 | 1,658 (-2%) | 1mo | $190,000 | $115 | 85 |
| 275 W Deaderick St | 0.17mi | 3/2.0 | 1,852 (+9%) | 0mo | $267,900 | $145 | 73 |
| 237 Wells St | 0.26mi | 3/2.5 | 1,619 (-5%) | 7mo | $280,000 | $173 | 72 |
| 300 W Deaderick St | 0.12mi | 3/2.0 | 1,512 (-11%) | 8mo | $284,000 | $188 | 66 |
| 568 Westmoreland Pl | 0.59mi | 3/2.0 | 1,727 (+2%) | 2mo | $240,000 | $139 | 64 |
| 205 Morgan St | 0.18mi | 3/2.0 | 1,508 (-11%) | 6mo | $280,000 | $186 | 64 |
| 161 Hollywood Dr | 0.23mi | 3/2.0 | 1,944 (+15%) | 4mo | $165,000 | $85 | 58 |
| 161 W Grand St | 0.68mi | 4/3.0 (+1) | 1,780 (+5%) | 0mo | $255,000 | $143 | 55 |
| 400 W Grand St | 0.59mi | 3/1.5 | 1,792 (+6%) | 7mo | $92,500 | $52 | 52 |
| 415 Division Ave | 0.67mi | 2/2.0 (-1) | 1,614 (-5%) | 1mo | $194,500 | $121 | 50 |
| 145 Arlington Ave | 0.63mi | 4/2.5 (+1) | 1,859 (+10%) | 6mo | $260,000 | $140 | 43 |
| 517 Wisdom St | 0.73mi | 4/2.0 (+1) | 1,926 (+14%) | 8mo | $251,900 | $131 | 28 |
Match score weights: distance 35% · size 25% · config 20% · recency 20%. Top-matched comps best support the ARV.
Projected returns pro-forma
-3.0% appreciation · 5.19% rent growth · sell at horizon
- IRR
- 4.4%
- Equity multiple
- 1.17×
- Total profit
- $7,265
- Equity at exit
- $22,291
- IRR
- 15.7%
- Equity multiple
- 2.40×
- Total profit
- $58,537
- Equity at exit
- $12,926
Cash invested: $41,860 (down + closing). Projections, not guarantees.
Landlord ↔ Tenant lean methodology
- Overall (STATE)
- 87 Strongly Landlord-Friendly
- State Tennessee
- 87 Strongly Landlord-Friendly · R+13
- County
- — inherits STATE
- City
- — inherits STATE
ZIP-level market 38301
- Rents YoY
- 5.2%
- Active inventory
- 254
- Price-to-rent
- 7.2×
Monthly cashflow live
- Estimated rent
- $1,737 medium interval (Pro) →
- Mortgage (P&I)
- −$784
- Tax from tax record
- −$93 /mo · $1,112/yr
- Insurance
- −$62
- HOA
- −$0
- Vacancy / Maint / Mgmt
- −$365
- Net cashflow
- $434
Break-even live
Sensitivity live
| Price | -10% $518 | -5% $476 | +0% $434 | +5% $391 | +10% $349 |
|---|---|---|---|---|---|
| Rent | -10% $296 | -5% $365 | +0% $434 | +5% $502 | +10% $571 |
| Rate | -1.0pp $509 | -0.5pp $472 | base $434 | +0.5pp $395 | +1.0pp $355 |
UW: 25.0% down · 7.5% · 30yr · 1.5% tax · 5.0% vac · 8.0% maint · 8.0% mgmt
Financing live
Cash to close
- Down payment
- $37,375
- Closing costs
- $4,485
- Reserves months
- —
- Total cash needed
- —
Loan-product check · same deal, 3 products live
Conventional
25% down · 7.5% · 30yr
- Down + closing
- —
- Monthly P&I
- —
- Monthly cashflow
- —
- DSCR
- —
- Eligible?
- —
Personal DTI + credit; lowest rate.
DSCR
20% down · 8.5% · 30yr
- Down + closing
- —
- Monthly P&I
- —
- Monthly cashflow
- —
- DSCR
- —
- Eligible?
- —
No personal income docs; deal must DSCR.
Hard money
10% down · 12.0% · 12mo
- Down + closing
- —
- Monthly P&I
- —
- Monthly cashflow
- —
- DSCR
- —
- Eligible?
- —
Short-term bridge; refi at stabilization.
Rent comps 1 comps
| Address | Beds | Baths | Sqft | Rent | $/sqft | DOM | Units | Dist |
|---|---|---|---|---|---|---|---|---|
| 102 Jackson Walk Plz Jackson, TN | 1.0–3.0 | 1.0–2.5 | 1082 | $2,600 | $2.40 | 45d | 1 | 0.44mi |
Listing history 34 events
-
2026-06-21days on market $149,500 Active 199 DOM
-
2026-06-19days on market $149,500 Active 197 DOM
-
2026-06-18days on market $149,500 Active 196 DOM
-
2026-06-17days on market $149,500 Active 195 DOM
-
2026-06-16days on market $149,500 Active 194 DOM
-
2026-06-15pricedays on market $149,500 Active 193 DOM
-
2026-06-14days on market $153,000 Active 191 DOM
-
2026-06-13days on market $153,000 Active 190 DOM
-
2026-06-10days on market $153,000 Active 188 DOM
-
2026-06-09days on market $153,000 Active 187 DOM
-
2026-06-08days on market $153,000 Active 186 DOM
-
2026-06-07days on market $153,000 Active 185 DOM
-
2026-06-05days on market $153,000 Active 182 DOM
-
2026-06-03days on market $153,000 Active 181 DOM
-
2026-06-02days on market $153,000 Active 180 DOM
-
2026-06-01days on market $153,000 Active 179 DOM
-
2026-05-31days on market $153,000 Active 178 DOM
-
2026-05-30days on market $153,000 Active 177 DOM
-
2026-05-13price $157,500
-
2026-04-15price $159,900
-
2026-03-17price $161,900
-
2026-03-05price $164,900
-
2026-02-18status Active
-
2026-02-04status Pending
-
2026-01-20price $169,900
-
2026-01-07price $174,900
-
2025-12-01soldstatus $136,000
-
2025-11-19$179,900 Active
-
2025-05-14price $185,000
-
2025-01-28price $199,000
-
2024-11-19$210,000 Active
-
2012-09-10soldstatus $21,000
-
2002-04-02soldstatus $35,000
-
2001-07-12soldstatus $65,000
ⓘ Source: listings_history table (triggers on properties + properties_extension) + one-shot
backfill from property_details.listing_events for pre-trigger history.
Tax reassessment forecast TN · Resets to sale price
- Current annual tax
- $1,112 · $93/mo
- Projected year-2 tax
- $1,112 · $93/mo
- Expected delta
- $0/yr ($0/mo · 0.0%)
ⓘ Screening estimate from a state-policy table — verify with the county assessor before closing.
Climate risk First Street
- Flood 1/10 Low FEMA zone X (unshaded) · 0% chance over 30 yrs
- Wildfire 1/10 Low
- Heat 6/10 Major 7 d/yr ≥108°F today · 20 d/yr by 30 yrs out
- Wind 4/10 Moderate 15% chance of damaging wind over 30 yrs
- Air quality 1/10 Low 0 unhealthy d/yr today · 0 by 30 yrs out
Nearby sold comps map
Loading sold comps map…
Walkable amenities ~0.75 mi
Loading nearby amenities…
Taxation est. · year 1
- Rental income
- $20,847
- − Mortgage interest
- −$8,374
- − Property taxes
- −$1,112
- − Insurance
- −$748
- − Repairs & maintenance
- −$1,668
- − Management
- −$1,668
- − Depreciation
- −$4,349
- Taxable income
- $2,929
- Est. tax owed @ 24.0%
- −$703
- After-tax cash flow
- $4,499/yr
For passive investors: Depreciation is non-cash, so a rental often shows a tax loss while cash-flowing — sheltering income. Rental losses are passive: they offset passive income freely, and up to $25,000/yr can offset ordinary (W-2) income if you actively participate and your MAGI is under $100k (phasing out to $0 by $150k); unused losses carry forward. On sale, claimed depreciation is recaptured at up to 25%, and gains may owe capital-gains tax (a 1031 exchange can defer both). Figures are a year-1 estimate at your 24.0% rate — not tax advice; consult a CPA.
Schools (NCES district)
- District
- Madison County
- NCES district ID
- 4702580
- Math proficiency
- 10% ▼ -11.00%
- Reading proficiency
- 17% ▼ -4.00%
- Median HH income
- $42,015
- Composite
- 11.74/100
- National rank
- #9687
- State rank
- #131 of 139 in TN
Livability — Jackson
- Score
- 62/100
- State rank
- #216
- US rank
- #16488
Category grades
Schools grade is shown separately in the Schools card above.
Census & demographics
- Census place
- Jackson, TN
- County
- Madison County · 87,024 people
- City population
- 87,024
- Metro
- Jackson, TN
- Population (ZIP)
- 33,536
- Household income
- $43,227
- Rent vs Own
- Severe rent burden
- 1701.0
Population outlook (Madison County) Hauer SSP2
- Today (2025)
- 95,952 people
- By 2030
- 94,264 · -1.8%
- By 2040
- 89,607 · -6.6%
- By 2050
- 84,133 · -12.3%
- By 2075
- 72,215 · -24.7%
- By 2100
- 62,062 · -35.3%
Race, ethnicity, and origin ACS 2023
- Neighborhood character
- Diverse neighborhood (Simpson 0.57)
- Race & ethnicity
- Black 50% White 42% Two or more races 5% Hispanic / Latino 4%
- Common ancestry
- Slovak 1% Serbian 1% Portuguese 1%
- Foreign-born
- 3% · Canada
- Languages at home
- 96% English-only · Spanish 3%
Political lean MEDSL · Madison
- 2024 margin
- R (+18.2) · D 40.3% · R 58.5% · Other 1.2%
- 2008→2024 swing
- +3.4pp toward D · 2008: -21.6pp · 2024: -18.2pp
- All cycles
- 2024: R+18.2 2020: R+12.9 2016: R+15.6 2012: R+8.9 2008: R+21.6
Not yet ingested
- Civics
- —
Market trends
- HPI YoY
- ▼ -112.26%
- Current HPI
- 162.2273
- Rent YoY
- ▲ 5.19%
- Metro
- Jackson, TN
- State GDP YoY
- ▲ 2.78%
- F500 in state
- 22
Industry mix (Fortune 500 HQ in TN)
| Industry | F500 HQs | Revenue |
|---|---|---|
| Healthcare | 3 | $91B |
|
||
| Retail | 3 | $72B |
|
||
| Transportation / Logistics | 1 | $88B |
|
||
| Paper / Packaging | 1 | $19B |
|
||
| Insurance | 1 | $13B |
|
||
| Energy | 1 | $12B |
|
||
Price history
+142.3% since first listed16 events — show timeline
- 2026-05-13 Price Changed $157,500 CWTAR
- 2026-04-15 Price Changed $159,900 CWTAR
- 2026-03-17 Price Changed $161,900 CWTAR
- 2026-03-05 Price Changed $164,900 CWTAR
- 2026-02-18 Relisted — CWTAR
- 2026-02-04 Pending — CWTAR
- 2026-01-20 Price Changed $169,900 CWTAR
- 2026-01-07 Price Changed $174,900 CWTAR
- 2025-12-01 Sold (Public Records) $136,000 Public Records
- 2025-11-19 Listed $179,900 CWTAR
- 2025-05-14 Price Changed $185,000 CWTAR
- 2025-01-28 Price Changed $199,000 CWTAR
- 2024-11-19 Listed $210,000 CWTAR
- 2012-09-10 Sold (Public Records) $21,000 Public Records
- 2002-04-02 Sold (Public Records) $35,000 Public Records
- 2001-07-12 Sold (Public Records) $65,000 Public Records
Property tax history
+9.0%/yrLatest (2025): $1,112 · +0.0% YoY. Source: county tax records.
Cash-flow waterfall
monthlySold comps — $/sqft
last 12 mo · ≤1 miLoading sold comps…