5841 Darling St Unit C · Houston, TX
Flood risk 3/10 · Minor
- FEMA flood zone
- X (unshaded)
- Chance of flooding over 30 yrs
- 0.1%
- Est. flood insurance / yr
- $507 – $1,088
Fire risk 1/10 · Minimal
- Est. fire insurance / yr
- $1,222 – $2,270
Heat risk 9/10 · Severe
- Hot days now (above 109°F)
- 7 days/yr
- Hot days in 30 yrs
- 25 days/yr
Wind risk 9/10 · Severe
- Chance of severe wind over 30 yrs
- 99.0%
Air-quality risk 3/10 · Minor
- Unhealthy air days now
- 2 days/yr
- Unhealthy air days in 30 yrs
- 3 days/yr
Risk factors via First Street. Map © Google.
Why this score? — see what drove the C grade
The composite is a weighted blend of 9 inputs, each scored 0–100. Each bar is that input's sub-score; the figure is the points it added to the 100-point composite (weight × sub-score).
- Cash flow +22.3/30.0
- ARV discount +11.2/15.0
- DSCR +7.1/10.0
- 1% rule +6.8/10.0
- Livability +3.7/5.0
- Schools +2.7/10.0
- Condition / age +2.5/5.0
- Rent growth +2.3/5.0
- Appreciation +0.0/10.0
$375,000
🖨 Deal sheet 📄 Offer letter ✓ Due diligence
Listing remarks MLS
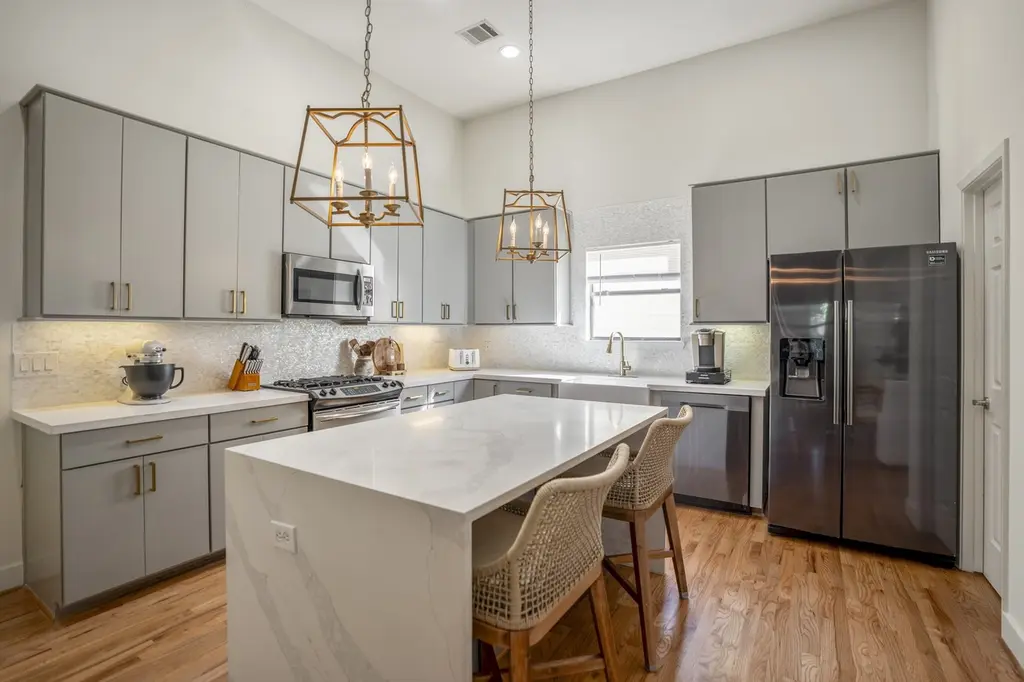
NEW ROOF (2026) | TRULY MOVE-IN READY! Stunning 3-story townhome in sought-after Cottage Grove, one of Houston’s most coveted Inner Loop neighborhoods. Minutes from Memorial Park, Downtown, the Galleria, I-10 & Washington Corridor dining. Soaring ceilings, rich wood floors (zero carpet!) & open-concept layout made for entertaining. Chef’s kitchen boasts stainless steel appliances, waterfall quartz island, upgraded cabinetry & generous pantry. Cozy up by the fireplace in the inviting living area or step onto your private balcony. Luxurious primary suite features a spa-inspired bath, oversized walk-in closet & private balcony retreat. Every bedroom offers en-suite bath privacy. Walk to Cottage Grove Park & Memorial Park trails. NO HOA. NEVER FLOODED, Low-maintenance living. ALL appliances convey — refrigerator, washer & dryer included. Lifestyle. Location. Value. It’s all here!
Key facts
- 2 garage spots
- Built 2007
- Listed 72 days
Neighborhood map
What this means for you Summary
Snapshot
- This is a 3-bed/3.5-bath townhouse listed at $375k.
Deal economics
- At list price, monthly cash flow is $618 ($7k/yr) — positive.
- The deal already cash-flows at list — no discount required.
- Meets the 1% rule at list price ($4k rent vs $375k).
- Recommended offer: $352k (6.0% below list) — sets the bar for market timing.
- Cap rate 8.3% vs local median 3.2% in Houston — top-decile yield for the area; either an underpriced asset or a hidden risk that comps aren't pricing in. Stress-test before assuming the spread holds.
Location & tenants
- Location reads 74/100 on livability (#184 in TX, #4,771 nationally) — a middle-class / working-renter tenant base. Strengths: amenities A+, cost of living A+, housing A+; Watch: schools D, crime F.
- Houston ISD (urban): math 27% / reading 35% proficiency, ranked #593 of 826 in TX (top 72%) — families likely to look elsewhere, expect single-tenant / working-renter base with shorter leases; 71% free/reduced lunch — lower-income household profile, screen leases tightly.
- Market conditions: Rents soft (-0.8%/yr); 646 active listings in the ZIP; 33 comparable units currently listed for rent nearby; rentals at typical pace (median 24d on market — plan ~3-4 weeks tenant-placement turnaround); 45% of comp listings sitting > 30 days — soft ceiling on asking rent; high-income renter base; 29,883 units permitted in Harris County in 2024 (8,621 in 5+ unit buildings).
- This rent runs 37% of the median local income ($145k/yr) — at the standard rent-burdened threshold; future hikes will face affordability resistance.
Forward outlook
- Local home prices are declining (-3.0%/yr); year-one equity from $3k of loan paydown is wiped out by about $11k of value loss. Plan a longer hold.
- Harris County population projected at +47% by 2050 — long-run rental-demand tailwind backs the buy-and-hold thesis.
Negotiation context
- It's been on market 72 days — a 6% lower offer ($352k) is reasonable based on typical stale-listing flexibility.
- 8 sale attempts since 17y ago with the ask held roughly flat each time — persistent listings suggest the price (not the market) is what's stuck; bring a comps-based counter.
Risks & watch-outs
- Climate carrying-cost: severe wind risk, 99% chance of damaging wind over 30y; extreme-heat days projected 7→25/yr by 2055 (HVAC capex compounding) — expect insurance premiums to compound above CPI over the hold.
Questions for the listing agent
- It's been on market 72 days. Have you received any prior offers? Is the seller open to a 6% concession, seller financing, or rate buy-down credit?
- Why hasn't it sold? Are there any deal-killer items the seller is aware of (foundation, flood, title, zoning, code violations)?
- Is there a deadline driving the sale (1031 exchange, divorce, estate, relocation)? That informs how much negotiation room exists.
- Schools are D-rated, which usually means shorter tenancies and higher turnover. Who's the typical renter profile here, and what's been the actual vacancy rate?
- Crime grade is F in this area — have there been break-ins, vandalism, or insurance claims at this property in the last 3 years? What carrier currently insures it and at what premium?
- What's the average days-on-market for RENTAL listings here right now (not sales)? A rising rental-DOM trend means longer vacancies and softer asking-rent achievability than the comps imply.
- What's the recent tenant-quality profile in this submarket — average credit score on applications, eviction rate, late-payment / NSF rate, and stable-employment percentage? A property-management company in the area should have these aggregated.
- How much new for-sale + rental construction is in the pipeline within 1–3 miles? Heavy new supply typically softens prices + rents 12–24 months out; constrained supply supports both.
Investment metrics
- 1% rule
- 1.18% ✓
- Cap rate
- 8.27%
- Cash-on-cash
- 7.06%
- DSCR
- 1.31
- GRM
- 7.1
CMA / ARV
- ARV (median comp)
- $408,103
- List price
- $375,000
- Delta
- -8.11%
- Verdict
- FAIR
- Comps
- 20 within 1.0 mi
Show comp detail 12 sales within ~0.75 mi
| Address | Dist | Beds/Ba | Sqft | Sold | Price | $/sf | Match |
|---|---|---|---|---|---|---|---|
| 5737 Kansas St | 0.22mi | 3/3.5 | 2,177 (+4%) | 0mo | $400,000 | $184 | 83 |
| 5617 Kiam St Unit A | 0.34mi | 3/3.5 | 2,126 (+2%) | 1mo | $370,000 | $174 | 81 |
| 5716 Kansas St Unit B | 0.27mi | 3/3.5 | 2,020 (-3%) | 1mo | $389,000 | $193 | 80 |
| 2506 Maxroy St | 0.21mi | 3/3.5 | 2,260 (+8%) | 4mo | $419,900 | $186 | 74 |
| 5714 Kansas St | 0.27mi | 3/3.5 | 1,957 (-6%) | 4mo | $360,000 | $184 | 74 |
| 5639 Petty St | 0.26mi | 3/3.5 | 2,252 (+8%) | 2mo | $459,000 | $204 | 73 |
| 6302 Prague St | 0.39mi | 3/3.5 | 2,205 (+6%) | 1mo | $749,999 | $340 | 72 |
| 5429 Larkin St | 0.57mi | 3/3.5 | 2,053 (-2%) | 2mo | $449,000 | $219 | 69 |
| 1625 Mcdonald St | 0.32mi | 3/3.5 | 2,401 (+15%) | 2mo | $425,000 | $177 | 59 |
| 3311 Green Lilly Ln | 0.75mi | 3/3.5 | 1,948 (-7%) | 3mo | $560,000 | $287 | 52 |
| 5527 Darling Unit A | 0.42mi | 3/2.5 | 2,401 (+15%) | 1mo | $450,000 | $187 | 51 |
| 918 Cohn St | 0.75mi | 2/2.0 (-1) | 2,022 (-3%) | 1mo | $420,000 | $208 | 48 |
Match score weights: distance 35% · size 25% · config 20% · recency 20%. Top-matched comps best support the ARV.
Projected returns pro-forma
-3.0% appreciation · 0.0% rent growth · sell at horizon
- IRR
- -9.2%
- Equity multiple
- 0.67×
- Total profit
- $-34,136
- Equity at exit
- $55,914
- IRR
- -4.8%
- Equity multiple
- 0.73×
- Total profit
- $-28,172
- Equity at exit
- $32,423
Cash invested: $105,000 (down + closing). Projections, not guarantees.
Landlord ↔ Tenant lean methodology
- Overall (STATE)
- 87 Strongly Landlord-Friendly
- State Texas
- 87 Strongly Landlord-Friendly · R+5
- County
- — inherits STATE
- City
- — inherits STATE
ZIP-level market 77007
- Rents YoY
- -0.8%
- Active inventory
- 646
- Price-to-rent
- 7.1×
Monthly cashflow live
- Estimated rent
- $4,424 high interval (Pro) →
- Mortgage (P&I)
- −$1,967
- Tax from tax record
- −$754 /mo · $9,052/yr
- Insurance
- −$156
- HOA
- −$0
- Vacancy / Maint / Mgmt
- −$929
- Net cashflow
- $618
Break-even live
UW: 25.0% down · 7.5% · 30yr · 1.5% tax · 5.0% vac · 8.0% maint · 8.0% mgmt
Financing live
Cash to close
- Down payment
- $93,750
- Closing costs
- $11,250
- Reserves months
- —
- Total cash needed
- —
Loan-product check · same deal, 3 products live
Conventional
25% down · 7.5% · 30yr
- Down + closing
- —
- Monthly P&I
- —
- Monthly cashflow
- —
- DSCR
- —
- Eligible?
- —
Personal DTI + credit; lowest rate.
DSCR
20% down · 8.5% · 30yr
- Down + closing
- —
- Monthly P&I
- —
- Monthly cashflow
- —
- DSCR
- —
- Eligible?
- —
No personal income docs; deal must DSCR.
Hard money
10% down · 12.0% · 12mo
- Down + closing
- —
- Monthly P&I
- —
- Monthly cashflow
- —
- DSCR
- —
- Eligible?
- —
Short-term bridge; refi at stabilization.
Rent comps 33 comps
| Address | Beds | Baths | Sqft | Rent | $/sqft | DOM | Units | Dist |
|---|---|---|---|---|---|---|---|---|
| 5732 Darling St Unit 1056419P Houston, TX | 3.0 | 3.5 | 2400 | $7,771 | $3.24 | 43d | 1 | 0.14mi |
| 5620 Petty St Unit 1019538P Houston, TX | 4.0 | 3.5 | 2884 | $16,259 | $5.64 | 22d | 1 | 0.32mi |
| 5620 Petty St Houston, TX | 4.0 | 3.5 | 2891 | $8,750 | $3.03 | 43d | 1 | 0.32mi |
| 5530 Kiam St Houston, TX | 4.0 | 2.5 | 2688 | $9,750 | $3.63 | 43d | 1 | 0.42mi |
| 5530 Kiam St Unit 1019540P Houston, TX | 4.0 | 2.5 | 2680 | $15,799 | $5.90 | 43d | 1 | 0.42mi |
| 2103 Radcliffe St Unit 1225772P Houston, TX | 3.0 | 2.0 | 1797 | $4,729 | $2.63 | 7d | 1 | 0.47mi |
| 2210 Radcliffe St Houston, TX | 3.0 | 3.5 | 2066 | $2,716 | $1.31 | 7d | 1 | 0.49mi |
| 5427 Kansas St Houston, TX | 3.0 | 4.0 | 2156 | $2,700 | $1.25 | 43d | 1 | 0.55mi |
| 5811 Maxie St Houston, TX | 3.0 | 3.5 | 2226 | $3,000 | $1.35 | 43d | 1 | 0.56mi |
| 543 T C Jester Blvd Unit 1225766P Houston, TX | 3.0 | 3.5 | 2389 | $5,222 | $2.19 | 16d | 1 | 0.60mi |
| 5336 Darling St Unit 1225767P Houston, TX | 3.0 | 3.0 | 2292 | $5,570 | $2.43 | 7d | 1 | 0.64mi |
| 929 Westcott St Houston, TX | 1.0–3.0 | 1.0–3.0 | 1375 | $9,263 | $6.74 | 3d | 22 | 0.67mi |
| 3001 W 11th St Houston, TX | 3.0 | 1.0–2.0 | 1031 | $4,533 | $4.40 | 1d | 50 | 0.68mi |
| 920 Westcott St Houston, TX | 1.0–2.0 | 1.0–2.0 | 1175 | $3,306 | $2.81 | 1d | 29 | 0.68mi |
| 5610 Schuler St Houston, TX | 3.0 | 3.5 | 2614 | $3,111 | $1.19 | 5d | 1 | 0.70mi |
| 5235 Petty St Unit B Houston, TX | 3.0 | 2.5 | 2532 | $3,000 | $1.18 | 43d | 1 | 0.76mi |
| 5454 Washington Ave Unit 5487 Houston, TX | 3.0 | 2.0 | 1444 | $2,726 | $1.89 | 11d | 1 | 0.84mi |
| 5454 Washington Ave Unit 525 Houston, TX | 3.0 | 2.0 | 1444 | $2,694 | $1.87 | 3d | 1 | 0.84mi |
| 5305 Nett St Unit A Houston, TX | 3.0 | 3.5 | 2104 | $2,950 | $1.40 | 24d | 1 | 0.88mi |
| 5108 Larkin St Houston, TX | 3.0 | 3.5 | 2108 | $2,850 | $1.35 | 44d | 1 | 0.90mi |
| 5237 Center St Houston, TX | 3.0 | 3.0 | 2284 | $2,995 | $1.31 | 43d | 1 | 0.96mi |
| 4917 Nolda St Houston, TX | 3.0 | 3.5 | 1764 | $5,000 | $2.83 | 24d | 1 | 1.02mi |
| 4510 Inker St Houston, TX | 4.0 | 4.0 | 2293 | $4,500 | $1.96 | 43d | 1 | 1.30mi |
| 4608 Nett St Houston, TX | 3.0 | 4.0 | 2261 | $3,750 | $1.66 | 43d | 1 | 1.30mi |
| 4508 Maxie St Unit B Houston, TX | 3.0 | 1.0 | 1700 | $3,003 | $1.77 | 15d | 1 | 1.32mi |
| 100 Detering St Houston, TX | 1.0–3.0 | 1.0–3.0 | 1162 | $3,486 | $3.00 | 3d | 26 | 1.33mi |
| 5359 Memorial Dr Houston, TX | 3.0 | 2.0 | 1478 | $2,562 | $1.73 | 43d | 1 | 1.39mi |
| 4311 Marina St Houston, TX | 3.0 | 4.0 | 2328 | $3,599 | $1.55 | 43d | 1 | 1.41mi |
| 4444 Center St Houston, TX | 3.0 | 3.0 | 2121 | $3,200 | $1.51 | 43d | 1 | 1.43mi |
| 5201 Memorial Dr Houston, TX | 1.0–2.0 | 1.0–2.5 | 1071 | $3,361 | $3.14 | 1d | 21 | 1.45mi |
| 1723 W 14th St Unit B Houston, TX | 3.0 | 3.5 | 2373 | $3,400 | $1.43 | 20d | 1 | 1.46mi |
| 5353 Memorial Dr Houston, TX | 1.0–3.0 | 1.0–2.5 | 1118 | $3,095 | $2.77 | 2d | 19 | 1.49mi |
| 1126 W 16th St Houston, TX | 3.0 | 4.0 | 2494 | $4,295 | $1.72 | 43d | 1 | 1.49mi |
Listing history 38 events
-
2026-06-18days on market $375,000 Active 72 DOM
-
2026-06-17days on market $375,000 Active 71 DOM
-
2026-06-16days on market $375,000 Active 70 DOM
-
2026-06-15days on market $375,000 Active 69 DOM
-
2026-06-13days on market $375,000 Active 67 DOM
-
2026-06-10days on market $375,000 Active 63 DOM
-
2026-06-08days on market $375,000 Active 62 DOM
-
2026-06-07days on market $375,000 Active 61 DOM
-
2026-06-04days on market $375,000 Active 58 DOM
-
2026-06-01days on market $375,000 Active 55 DOM
-
2026-05-31days on market $375,000 Active 54 DOM
-
2026-04-07$375,000 Active 936-char remark
Show marketing remark (936 chars)
NEW ROOF (2026) | TRULY MOVE-IN READY! Stunning 3-story townhome in sought-after Cottage Grove, one of Houston’s most coveted Inner Loop neighborhoods. Minutes from Memorial Park, Downtown, the Galleria, I-10 & Washington Corridor dining. Soaring ceilings, rich wood floors (zero carpet!) & open-concept layout made for entertaining. Chef’s kitchen boasts stainless steel appliances, waterfall quartz island, upgraded cabinetry & generous pantry. Cozy up by the fireplace in the inviting living area or step onto your private balcony. Luxurious primary suite features a spa-inspired bath, oversized walk-in closet & private balcony retreat. Every bedroom offers en-suite bath privacy. Walk to Cottage Grove Park & Memorial Park trails. NO HOA. NEVER FLOODED, Low-maintenance living. ALL appliances convey — refrigerator, washer & dryer included. Lifestyle. Location. Value. It’s all here!
-
2026-04-01status Pending
-
2026-04-01historical
-
2026-03-16price $375,000
-
2026-02-25status Active
-
2026-02-24historical
-
2026-02-03status Active
-
2026-02-02historical Active Under Contract
-
2026-01-30status Pending
-
2026-01-20price $389,990
-
2026-01-05$400,000 Active
-
2026-01-05historical
-
2025-12-26price $400,000
-
2025-10-16$419,900 Active
-
2021-04-16soldstatus
-
2021-04-14soldstatus Sold
-
2021-03-17status Pending
-
2021-03-08status Option Pending
-
2021-03-05$320,000 Active
-
2012-12-26soldstatus
-
2012-12-18soldstatus Sold
-
2012-12-12status Pending
-
2012-12-12status Pending, Continue to Show
-
2012-12-09historical
-
2012-09-01$265,500
-
2009-07-17soldstatus
-
2009-01-25$250,000
ⓘ Source: listings_history table (triggers on properties + properties_extension) + one-shot
backfill from property_details.listing_events for pre-trigger history.
Tax reassessment forecast TX · Resets to sale price
- Current annual tax
- $9,052 · $754/mo
- Projected year-2 tax
- $9,052 · $754/mo
- Expected delta
- $0/yr ($0/mo · 0.0%)
ⓘ Screening estimate from a state-policy table — verify with the county assessor before closing.
Climate risk First Street
- Flood 3/10 Moderate FEMA zone X (unshaded) · 10% chance over 30 yrs
- Wildfire 1/10 Low
- Heat 9/10 Extreme 7 d/yr ≥109°F today · 25 d/yr by 30 yrs out
- Wind 9/10 Extreme 99% chance of damaging wind over 30 yrs
- Air quality 3/10 Moderate 2 unhealthy d/yr today · 3 by 30 yrs out
Nearby sold comps map
Loading sold comps map…
Walkable amenities ~0.75 mi
Loading nearby amenities…
Taxation est. · year 1
- Rental income
- $53,088
- − Mortgage interest
- −$21,006
- − Property taxes
- −$9,052
- − Insurance
- −$1,875
- − Repairs & maintenance
- −$4,247
- − Management
- −$4,247
- − Depreciation
- −$10,909
- Taxable income
- $1,753
- Est. tax owed @ 24.0%
- −$421
- After-tax cash flow
- $6,994/yr
For passive investors: Depreciation is non-cash, so a rental often shows a tax loss while cash-flowing — sheltering income. Rental losses are passive: they offset passive income freely, and up to $25,000/yr can offset ordinary (W-2) income if you actively participate and your MAGI is under $100k (phasing out to $0 by $150k); unused losses carry forward. On sale, claimed depreciation is recaptured at up to 25%, and gains may owe capital-gains tax (a 1031 exchange can defer both). Figures are a year-1 estimate at your 24.0% rate — not tax advice; consult a CPA.
Schools (NCES district)
- District
- Houston ISD
- NCES district ID
- 4823640
- Math proficiency
- 27% ▼ -18.00%
- Reading proficiency
- 35% ▼ -6.00%
- Median HH income
- $46,054
- Composite
- 26.63/100
- National rank
- #7173
- State rank
- #593 of 826 in TX
Livability — Houston
- Score
- 74/100
- State rank
- #184
- US rank
- #4771
Category grades
Schools grade is shown separately in the Schools card above.
Census & demographics
- Census place
- Houston, TX
- County
- Harris County · 4,702,590 people
- City population
- 3,226,434
- Metro
- Houston-The Woodlands-Sugar Land, TX
- Population (ZIP)
- 47,808
- Household income
- $144,911
- Rent vs Own
- Severe rent burden
- 1812.0
Population outlook (Harris County) Hauer SSP2
- Today (2025)
- 5,571,493 people
- By 2030
- 6,089,821 · +9.3%
- By 2040
- 7,142,806 · +28.2%
- By 2050
- 8,185,864 · +46.9%
- By 2075
- 10,574,329 · +89.8%
- By 2100
- 12,109,958 · +117.4%
Race, ethnicity, and origin ACS 2023
- Neighborhood character
- Diverse neighborhood (Simpson 0.63)
- Race & ethnicity
- White 57% Hispanic / Latino 17% Two or more races 13% Asian 11% Black 9%
- Hispanic origin (detail)
- Mexican 12%
- Common ancestry
- Slovak 3% Romanian 3% Italian 3%
- Foreign-born
- 19% · Canada, China, South Korea
- Languages at home
- 75% English-only · Spanish 12% Other Indo-European 4% Chinese 2%
Political lean MEDSL · Harris
- 2024 margin
- Lean D (+5.5) · D 52.0% · R 46.4% · Other 1.6%
- 2008→2024 swing
- +3.9pp toward D · 2008: 1.6pp · 2024: 5.5pp
- All cycles
- 2024: D+5.5 2020: D+13.3 2016: D+12.4 2012: D+0.1 2008: D+1.6
Not yet ingested
- Civics
- —
Market trends
- HPI YoY
- ▼ -219.42%
- Current HPI
- 159.8157
- Rent YoY
- ▼ -0.83%
- Metro
- Houston-The Woodlands-Sugar Land, TX
- State GDP YoY
- ▲ 3.95%
- F500 in state
- 110
Industry mix (Fortune 500 HQ in TX)
| Industry | F500 HQs | Revenue |
|---|---|---|
| Energy | 16 | $1,198B |
|
||
| Technology | 5 | $198B |
|
||
| Engineering / Construction | 4 | $72B |
|
||
| Energy Services | 3 | $60B |
|
||
| Utilities | 3 | $41B |
|
||
| Healthcare | 2 | $330B |
|
||
Price history
+50.0% since first listed27 events — show timeline
- 2026-04-07 Listed $375,000 HARMLS
- 2026-04-01 Pending — HARMLS
- 2026-04-01 Listing Removed — HARMLS
- 2026-03-16 Price Changed $375,000 HARMLS
- 2026-02-25 Relisted — HARMLS
- 2026-02-24 Listing Removed — HARMLS
- 2026-02-03 Relisted — HARMLS
- 2026-02-02 Contingent — HARMLS
- 2026-01-30 Pending — HARMLS
- 2026-01-20 Price Changed $389,990 HARMLS
- 2026-01-05 Listing Removed — HARMLS
- 2026-01-05 Listed $400,000 HARMLS
- 2025-12-26 Price Changed $400,000 HARMLS
- 2025-10-16 Listed $419,900 HARMLS
- 2021-04-16 Sold (Public Records) — Public Records
- 2021-04-14 Sold (MLS) — HARMLS
- 2021-03-17 Pending — HARMLS
- 2021-03-08 Pending — HARMLS
- 2021-03-05 Listed $320,000 HARMLS
- 2012-12-26 Sold (Public Records) — Public Records
- 2012-12-18 Sold (MLS) — HARMLS
- 2012-12-12 Pending — HARMLS
- 2012-12-12 Pending — HARMLS
- 2012-12-09 Listing Removed — HARMLS
- 2012-09-01 Listed $265,500 HARMLS
- 2009-07-17 Sold (MLS) — HARMLS
- 2009-01-25 Listed $250,000 HARMLS
Property tax history
+5.0%/yrLatest (2025): $9,052 · +11.7% YoY. Source: county tax records.
Cash-flow waterfall
monthlySold comps — $/sqft
last 12 mo · ≤1 miLoading sold comps…