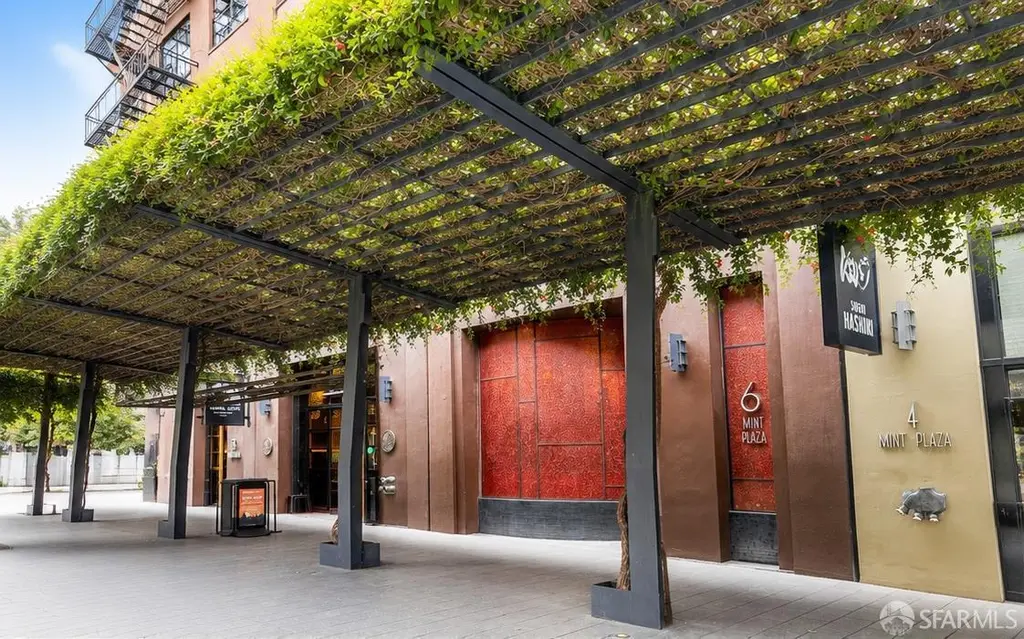
6 Mint Plz Unit 203A · San Francisco, CA
Flood risk 1/10 · Minimal
- FEMA flood zone
- X (unshaded)
- Chance of flooding over 30 yrs
- 0.0%
- Est. flood insurance / yr
- $507 – $1,088
Fire risk 1/10 · Minimal
- Est. fire insurance / yr
- $659 – $1,223
Heat risk 3/10 · Minor
- Hot days now (above 79°F)
- 8 days/yr
- Hot days in 30 yrs
- 18 days/yr
Wind risk 1/10 · Minimal
- Chance of severe wind over 30 yrs
- —
Air-quality risk 8/10 · Major
- Unhealthy air days now
- 15 days/yr
- Unhealthy air days in 30 yrs
- 15 days/yr
Risk factors via First Street. Map © Google.
Why this score? — see what drove the D grade
The composite is a weighted blend of 9 inputs, each scored 0–100. Each bar is that input's sub-score; the figure is the points it added to the 100-point composite (weight × sub-score).
- ARV discount +7.5/15.0
- Appreciation +7.5/10.0
- Cash flow +5.5/30.0
- Rent growth +5.0/5.0
- Schools +5.0/10.0
- 1% rule +4.1/10.0
- Condition / age +4.0/5.0
- Livability +3.8/5.0
- DSCR +0.0/10.0
$454,539
🖨 Deal sheet (PDF) 📄 Offer letter ✓ Due diligence
Listing remarks
2-Bedroom Below Market Rate (BMR) housing opportunity available at 100% Area Median Income (AMI). Maximum income for 2 people = $124,700; 3 = $140,250; 4 = $155,850, etc. Must be 1st-time homebuyer and income eligible. Unit available thru the Mayors Office of Housing and Community Development (MOHCD) and subject to resale controls, monitoring and other restrictions. Unit will be listed on DAHLIA, the SF Housing Portal (https://housing. sfgov. org) starting on the application date, Wednesday, May 27, 2026 at 5pm. Visit https://housing. sfgov.org for application and program info. Application, loan pre-approval, and homebuyer education verification due on Wednesday, June 24, 2026 at 5:00 PM
Key facts
- In-unit laundry
- Chef's kitchen
- $1,093 HOA
Tags
Property features AI
Finance
- HOA & community: Homeowners association with monthly fee; Monthly HOA fee; HOA amenities include barbecue, dog park, gym, and roof deck; HOA covers common areas, door person, structure insurance, structure maintenance, grounds maintenance, management, sewer, trash, and water; Community contains 83 units
Exterior
- Security: Secured access
- Utilities: Public water; Public sewer
- Home design: Residential condominium; Built in 1900
- Construction: 1900 construction
- Exterior features: Ground-level entry
Interior
- Kitchen: Dishwasher; Gas cooktop
- Bedrooms: 2 bedrooms
- Flooring: Concrete
- Bathrooms: 1 full bathroom
- Heating & cooling: Central heating
- Interior features: Central heating; Concrete flooring; Secured access
- Laundry & utility: Washer and dryer
Neighborhood map
What this means for you Summary
Snapshot
- This is a 2-bed/1.0-bath condo listed at $455k. Condition is rated good.
Deal economics
- At list price, monthly cash flow is $-966 ($-12k/yr) — negative.
- To cash-flow at today's rent, offer at most $315k (30.8% below list).
- To meet the 1% rule (rent ≥ 1% of price), the offer needs to be $414k (9.0% below list).
- Recommended offer: $315k (30.8% below list) — sets the bar for cash-flow.
- Cap rate 3.7% vs local median 2.1% in San Francisco — top-decile yield for the area; either an underpriced asset or a hidden risk that comps aren't pricing in. Stress-test before assuming the spread holds.
Location & tenants
- Location reads 76/100 on livability (#90 in CA, #3,143 nationally) — a middle-class / working-renter tenant base. Strengths: amenities A+, commute A+, employment A+; Watch: crime F, cost of living F.
- San Francisco Unified (urban): math 50% / reading 56% proficiency, ranked #322 of 1,400 in CA (top 23%) — acceptable for families but not a draw, mixed tenant base, ~2y average lease.
- Zoned schools: Lilienthal (Claire) Elementary (669 students, 19% FRL); Giannini (A.P.) Middle (1,192 students, 34% FRL); Lowell High (2,632 students, 37% FRL) — zoned schools average 30% FRL vs 49% district-wide (19 pts lower); this property's tenant base skews higher-income than the district average.
- Market conditions: Rents rising fast (+15.5%/yr); 113 active listings in the ZIP; 40 comparable units currently listed for rent nearby; rentals leasing fast (median 10d on market — plan ~1-2 weeks tenant-placement turnaround); high-income renter base; 750 units permitted in San Francisco County in 2024 (688 in 5+ unit buildings).
- This rent runs 43% of the median local income ($116k/yr) — at the standard rent-burdened threshold; future hikes will face affordability resistance.
Forward outlook
- In year one you build about $26k of equity ($3k loan paydown + $23k appreciation (5.0% local appreciation)).
- San Francisco County population projected at +39% by 2050 — long-run rental-demand tailwind backs the buy-and-hold thesis.
- By year 2, paydown + projected appreciation supports a ~$41k cash-out refi (75% LTV) — recoverable capital for the next deal without selling this one.
Negotiation context
- It's been on market 25 days — a 2% lower offer ($448k) is reasonable based on typical stale-listing flexibility.
Risks & watch-outs
- Watch-outs: HOA is 26% of rent; built in 1900 — expect roof / HVAC / electrical / plumbing capex.
Questions for the listing agent
- What do current leases actually rent for vs. the listed asking? Can we see a recent rent roll and the last 12 months of T-12 income?
- Built in 1900 — when were the roof, HVAC, electrical panel, plumbing, and water heater last replaced?
- What does the HOA fee cover, when was the last increase, and are there any pending special assessments or reserve-fund shortfalls?
- Any open or pending special assessments — roof, HVAC, plumbing, elevator, façade? What's the per-unit balance and payoff schedule, and is the seller paying it off at close or rolling it to the buyer?
- Is there a deadline driving the sale (1031 exchange, divorce, estate, relocation)? That informs how much negotiation room exists.
- Schools are B-rated — typically a magnet for longer-tenancy family renters. What's the average tenant stay here, and is there a school-zone premium baked into asking?
- Crime grade is F in this area — have there been break-ins, vandalism, or insurance claims at this property in the last 3 years? What carrier currently insures it and at what premium?
- The area grade is low — what's the realistic commute time and amenity access for the typical tenant pool here? Any planned neighborhood developments (good or bad) we should know about?
- What's the average days-on-market for RENTAL listings here right now (not sales)? A rising rental-DOM trend means longer vacancies and softer asking-rent achievability than the comps imply.
- What's the recent tenant-quality profile in this submarket — average credit score on applications, eviction rate, late-payment / NSF rate, and stable-employment percentage? A property-management company in the area should have these aggregated.
- How much new apartment / multifamily construction is in the pipeline within 1–3 miles? Heavy new supply (>2% of stock underway) typically softens rents 12–24 months out; light construction supports rent growth.
Investment metrics
- 1% rule
- 0.91% ✗
- Cap rate
- 3.74%
- Cash-on-cash
- -9.11%
- DSCR
- 0.59
- GRM
- 9.2
CMA / ARV
No comps found within radius.
Projected returns pro-forma
4.96% appreciation · 8.0% rent growth · sell at horizon
- IRR
- 7.7%
- Equity multiple
- 1.51×
- Total profit
- $64,837
- Equity at exit
- $256,546
- IRR
- 12.0%
- Equity multiple
- 3.39×
- Total profit
- $303,619
- Equity at exit
- $441,910
Cash invested: $127,271 (down + closing). Projections, not guarantees.
Landlord ↔ Tenant lean methodology
- Overall (CITY)
- 0 Strongly Tenant-Friendly
- State California
- 18 Strongly Tenant-Friendly · D+13
- County
- — inherits STATE
- City San Francisco
- 0 Strongly Tenant-Friendly · D+57
ZIP-level market 94103
- Home prices YoY
- 2.9%
- Rents YoY
- 15.5%
- Active inventory
- 113
- Price-to-rent
- 9.2×
Monthly cashflow live
- Estimated rent
- $4,136 high interval (Pro) →
- Mortgage (P&I)
- −$2,384
- Tax est. 1.5%
- −$568 /mo · $6,818/yr
- Insurance
- −$189
- HOA
- −$1,093
- Vacancy / Maint / Mgmt
- −$869
- Net cashflow
- $-966
Break-even live
Sensitivity live
| Price | -10% $-652 | -5% $-809 | +0% $-966 | +5% $-1,123 | +10% $-1,281 |
|---|---|---|---|---|---|
| Rent | -10% $-1,293 | -5% $-1,130 | +0% $-966 | +5% $-803 | +10% $-640 |
| Rate | -1.0pp $-737 | -0.5pp $-851 | base $-966 | +0.5pp $-1,084 | +1.0pp $-1,204 |
UW: 25.0% down · 7.5% · 30yr · 1.5% tax · 5.0% vac · 8.0% maint · 8.0% mgmt
Financing live
Cash to close
- Down payment
- $113,635
- Closing costs
- $13,636
- Reserves months
- —
- Total cash needed
- —
Loan-product check · same deal, 3 products live
Conventional
25% down · 7.5% · 30yr
- Down + closing
- —
- Monthly P&I
- —
- Monthly cashflow
- —
- DSCR
- —
- Eligible?
- —
Personal DTI + credit; lowest rate.
DSCR
20% down · 8.5% · 30yr
- Down + closing
- —
- Monthly P&I
- —
- Monthly cashflow
- —
- DSCR
- —
- Eligible?
- —
No personal income docs; deal must DSCR.
Hard money
10% down · 12.0% · 12mo
- Down + closing
- —
- Monthly P&I
- —
- Monthly cashflow
- —
- DSCR
- —
- Eligible?
- —
Short-term bridge; refi at stabilization.
Rent comps 40 comps
| Address | Beds | Baths | Sqft | Rent | $/sqft | DOM | Units | Dist |
|---|---|---|---|---|---|---|---|---|
| 960 Market St San Francisco, CA | 1.0 | 1.0 | 613 | $4,295 | $7.01 | 23d | 1 | 0.08mi |
| 434 Minna St San Francisco, CA | 2.0 | 1.0–2.0 | 719 | $6,581 | $9.15 | 0d | 15 | 0.11mi |
| 1028 Market St San Francisco, CA | 2.0 | 1.0 | 526 | $5,121 | $9.73 | 3d | 6 | 0.19mi |
| 50 Jones St San Francisco, CA | 1.0 | 1.0 | 471 | $3,347 | $7.11 | 0d | 7 | 0.24mi |
| 1075 Market St San Francisco, CA | 1.0 | 1.0 | 546 | $3,500 | $6.40 | 26d | 2 | 0.25mi |
| 1075 Market St #461 San Francisco, CA | 1.0 | 1.0 | 648 | $3,460 | $5.34 | 22d | 1 | 0.26mi |
| 400 Clementina St #1449 San Francisco, CA | 1.0–2.0 | 1.0–2.0 | 775 | $5,210 | $6.72 | 3d | 2 | 0.26mi |
| 900 Folsom St San Francisco, CA | 2.0 | 1.0–2.0 | 863 | $6,324 | $7.33 | 0d | 27 | 0.30mi |
| 285 Turk St Apt 507 San Francisco, CA | 1.0 | 1.0 | 462 | $1,795 | $3.89 | 45d | 1 | 0.32mi |
| 84 Harriet St Unit A San Francisco, CA | 1.0 | 1.0 | 718 | $3,295 | $4.59 | 22d | 1 | 0.34mi |
| 603 Natoma St Apt 406 San Francisco, CA | 1.0 | 1.0 | 556 | $2,950 | $5.31 | 45d | 1 | 0.36mi |
| 821 Folsom St #401 San Francisco, CA | 1.0 | 1.0 | 652 | $3,650 | $5.60 | 26d | 1 | 0.38mi |
| 540 Leavenworth St San Francisco, CA | 1.0 | 1.0 | 385 | $2,595 | $6.74 | 7d | 1 | 0.41mi |
| 1188 Mission St San Francisco, CA | 1.0 | 1.0 | 448 | $3,333 | $7.43 | 0d | 17 | 0.41mi |
| 631 O'Farrell St San Francisco, CA | 1.0 | 1.0 | 520 | $2,495 | $4.80 | 22d | 1 | 0.42mi |
| 631 Ofarrell St #1110 San Francisco, CA | 1.0 | 1.0 | 520 | $2,495 | $4.80 | 9d | 1 | 0.42mi |
| 631 Ofarrell St San Francisco, CA | 1.0 | 1.0 | 520 | $2,248 | $4.32 | 16d | 2 | 0.42mi |
| 676 Geary St San Francisco, CA | 1.0–2.0 | 1.0 | 616 | $4,340 | $7.04 | 3d | 2 | 0.43mi |
| 1177 Market St San Francisco, CA | 1.0–2.0 | 1.0 | 562 | $5,532 | $9.83 | 0d | 8 | 0.44mi |
| 1190 Mission St San Francisco, CA | 1.0 | 1.0 | 508 | $3,342 | $6.57 | 0d | 5 | 0.45mi |
| 737 Post St San Francisco, CA | 2.0 | 1.0–2.0 | 515 | $4,955 | $9.61 | 0d | 10 | 0.45mi |
| 33 8th St San Francisco, CA | 1.0–2.0 | 1.0 | 646 | $6,708 | $10.38 | 0d | 10 | 0.45mi |
| 99 Rausch St San Francisco, CA | 1.0 | 1.0 | 655 | $4,250 | $6.49 | 26d | 1 | 0.47mi |
| 737 Bush St San Francisco, CA | 1.0 | 1.0 | 750 | $2,595 | $3.46 | 16d | 1 | 0.47mi |
| 845 Sutter St San Francisco, CA | 1.0 | 1.0 | 700 | $2,895 | $4.14 | 16d | 1 | 0.50mi |
| 711 Leavenworth St Unit 1 San Francisco, CA | 1.0 | 1.0 | 400 | $1,895 | $4.74 | 20d | 1 | 0.51mi |
| 947 Bush St San Francisco, CA | 1.0 | 1.0 | 390 | $3,810 | $9.76 | 0d | 2 | 0.51mi |
| 725 Leavenworth St Unit 5 San Francisco, CA | 2.0 | 2.0 | 742 | $4,600 | $6.20 | 16d | 1 | 0.52mi |
| 755 Ofarrell St San Francisco, CA | 1.0 | 1.0 | 402 | $3,175 | $7.89 | 15d | 3 | 0.52mi |
| 750 Ofarrell St San Francisco, CA | 2.0 | 1.0–2.0 | 725 | $2,895 | $3.99 | 9d | 1 | 0.54mi |
| 919 Sutter St Unit 24 San Francisco, CA | 1.0 | 1.0 | 500 | $2,300 | $4.60 | 0d | 1 | 0.54mi |
| 935 Sutter St San Francisco, CA | 1.0 | 1.0 | 450 | $2,495 | $5.54 | 16d | 1 | 0.55mi |
| 540 Stockton St Apt 8 San Francisco, CA | 2.0 | 1.0 | 725 | $5,370 | $7.41 | 4d | 1 | 0.56mi |
| 965 Sutter St San Francisco, CA | 2.0 | 1.0–2.0 | 618 | $3,755 | $6.07 | 0d | 1 | 0.57mi |
| 1288 Howard St #604 San Francisco, CA | 1.0 | 1.0 | 431 | $3,400 | $7.89 | 45d | 1 | 0.57mi |
| 860 Geary St San Francisco, CA | 1.0 | 1.0 | 577 | $2,495 | $4.32 | 45d | 2 | 0.58mi |
| 1 St Francis Pl San Francisco, CA | 3.0 | 1.0–2.0 | 923 | $4,365 | $4.73 | 0d | 4 | 0.58mi |
| 55 9th St San Francisco, CA | 2.0 | 1.0–2.0 | 833 | $5,625 | $6.75 | 0d | 1 | 0.58mi |
| 1288 Howard St #1908 San Francisco, CA | 1.0–2.0 | 1.0–2.0 | 782 | $6,710 | $8.58 | 3d | 2 | 0.59mi |
| 1145 Pine St #21 San Francisco, CA | 1.0 | 1.0 | 600 | $3,100 | $5.17 | 0d | 1 | 0.61mi |
HOA detail condo
- Monthly dues
- $1,093 · $13,116/yr
- Assessments
- None detected in remarks — confirm with the listing agent.
Listing history 17 events
-
2026-06-21days on market $454,539 Active 25 DOM
-
2026-06-18days on market $454,539 Active 22 DOM
-
2026-06-17days on market $454,539 Active 21 DOM
-
2026-06-16days on market $454,539 Active 20 DOM
-
2026-06-15days on market $454,539 Active 19 DOM
-
2026-06-13days on market $454,539 Active 17 DOM
-
2026-06-13days on market $454,539 Active 16 DOM
-
2026-06-09days on market $454,539 Active 13 DOM
-
2026-06-08days on market $454,539 Active 12 DOM
-
2026-06-07days on market $454,539 Active 11 DOM
-
2026-06-04days on market $454,539 Active 8 DOM
-
2026-06-03days on market $454,539 Active 7 DOM
-
2026-06-02days on market $454,539 Active 6 DOM
-
2026-06-01days on market $454,539 Active 5 DOM
-
2026-05-31days on market $454,539 Active 4 DOM
-
2026-05-27price $454,539
-
2026-05-27$432,895 Active
ⓘ Source: listings_history table (triggers on properties + properties_extension) + one-shot
backfill from property_details.listing_events for pre-trigger history.
Climate risk First Street
- Flood 1/10 Low FEMA zone X (unshaded) · 0% chance over 30 yrs
- Wildfire 1/10 Low
- Heat 3/10 Moderate 8 d/yr ≥79°F today · 18 d/yr by 30 yrs out
- Wind 1/10 Low
- Air quality 8/10 Severe 15 unhealthy d/yr today · 15 by 30 yrs out
Nearby sold comps map
Loading sold comps map…
Walkable amenities ~0.75 mi
Loading nearby amenities…
Taxation est. · year 1
- Rental income
- $49,638
- − Mortgage interest
- −$25,461
- − Property taxes
- −$6,818
- − Insurance
- −$2,273
- − Repairs & maintenance
- −$3,971
- − Management
- −$3,971
- − HOA
- −$13,116
- − Depreciation
- −$13,223
- Taxable loss
- −$19,195
- Est. tax savings @ 24.0%
- +$4,607
- After-tax cash flow
- $-6,990/yr
For passive investors: Depreciation is non-cash, so a rental often shows a tax loss while cash-flowing — sheltering income. Rental losses are passive: they offset passive income freely, and up to $25,000/yr can offset ordinary (W-2) income if you actively participate and your MAGI is under $100k (phasing out to $0 by $150k); unused losses carry forward. On sale, claimed depreciation is recaptured at up to 25%, and gains may owe capital-gains tax (a 1031 exchange can defer both). Figures are a year-1 estimate at your 24.0% rate — not tax advice; consult a CPA.
Condition & rehab AI · 7 photos
This modern, move-in-ready condo features a good condition with a fresh exterior and interior design. Minimal maintenance and cosmetic updates can significantly enhance its resale and rental value.
Value-add opportunities
- Both Paint exterior walls — Enhances curb appeal and resale value
- Resale Replace countertops — Modernizes kitchen and improves resale value
- Both Install smart home devices — Enhances convenience and appeal
Renovation cost estimate screening
Value-add ROI direction
- Both Paint exterior walls — Enhances curb appeal and resale value ↑
- Resale Replace countertops — Modernizes kitchen and improves resale value ↑
- Both Install smart home devices — Enhances convenience and appeal ↑
ⓘ Cost ranges are severity-bucket heuristics (US national rule-of-thumb). Get contractor quotes + a written scope before underwriting a rehab budget.
Schools (NCES district)
- District
- San Francisco Unified
- NCES district ID
- 0634410
- Math proficiency
- 50% ▬ 0.00%
- Reading proficiency
- 56% ▲ 1.00%
- Median HH income
- $81,249
- Composite
- 50.14/100
- National rank
- #4088
- State rank
- #322 of 1400 in CA
Livability — San Francisco
- Score
- 76/100
- State rank
- #90
- US rank
- #3143
Category grades
Schools grade is shown separately in the Schools card above.
Census & demographics
- Census place
- San Francisco, CA
- County
- San Francisco County · 827,552 people
- City population
- 827,552
- Metro
- San Francisco-Oakland-Berkeley, CA
- Population (ZIP)
- 34,964
- Household income
- $116,438
- Rent vs Own
- Severe rent burden
- 2666.0
Population outlook (San Francisco County) Hauer SSP2
- Today (2025)
- 1,030,936 people
- By 2030
- 1,110,409 · +7.7%
- By 2040
- 1,270,010 · +23.2%
- By 2050
- 1,435,001 · +39.2%
- By 2075
- 1,779,074 · +72.6%
- By 2100
- 1,966,767 · +90.8%
Race, ethnicity, and origin ACS 2023
- Neighborhood character
- Highly diverse neighborhood (Simpson 0.75)
- Race & ethnicity
- White 32% Asian 31% Hispanic / Latino 20% Two or more races 11% Black 10% Native American 2%
- Hispanic origin (detail)
- Mexican 11%
- Common ancestry
- Lithuanian 2% Slovak 2% Romanian 2%
- Foreign-born
- 36% · Canada, China, Vietnam
- Languages at home
- 56% English-only · Spanish 16% Chinese 9% Tagalog/Filipino 6%
Political lean MEDSL · San Francisco
- 2024 margin
- Solid D (+64.8) · D 80.3% · R 15.5% · Other 4.1%
- 2008→2024 swing
- -5.7pp toward R · 2008: 70.5pp · 2024: 64.8pp
- All cycles
- 2024: D+64.8 2020: D+72.5 2016: D+76.1 2012: D+70.2 2008: D+70.5
Not yet ingested
- Civics
- —
Market trends
- HPI YoY
- ▲ 4.96%
- Current HPI
- 175.4945
- Rent YoY
- ▲ 15.50%
- Metro
- San Francisco-Oakland-Berkeley, CA
- State GDP YoY
- ▲ 3.21%
- F500 in state
- 116
Industry mix (Fortune 500 HQ in CA)
| Industry | F500 HQs | Revenue |
|---|---|---|
| Technology | 27 | $1,492B |
|
||
| Financial Services | 3 | $174B |
|
||
| Retail | 3 | $44B |
|
||
| Insurance | 3 | $26B |
|
||
| Media / Entertainment | 2 | $115B |
|
||
| Pharmaceuticals / Biotech | 2 | $62B |
|
||
Price history
+5.0% since first listed2 events — show timeline
- 2026-05-27 Price Changed $454,539 San Francisco MLS
- 2026-05-27 Listed $432,895 San Francisco MLS
Cash-flow waterfall
monthlySold comps — $/sqft
last 12 mo · ≤1 miLoading sold comps…