742 S Moody St · Oakwood, TX
Flood risk 1/10 · Minimal
- FEMA flood zone
- X (unshaded)
- Chance of flooding over 30 yrs
- 0.0%
- Est. flood insurance / yr
- $507 – $1,088
Fire risk 3/10 · Minor
- Est. fire insurance / yr
- $1,222 – $2,270
Heat risk 8/10 · Major
- Hot days now (above 110°F)
- 7 days/yr
- Hot days in 30 yrs
- 27 days/yr
Wind risk 8/10 · Major
- Chance of severe wind over 30 yrs
- 80.0%
Air-quality risk 1/10 · Minimal
- Unhealthy air days now
- 0 days/yr
- Unhealthy air days in 30 yrs
- 0 days/yr
Risk factors via First Street. Map © Google.
Why this score? — see what drove the B grade
The composite is a weighted blend of 9 inputs, each scored 0–100. Each bar is that input's sub-score; the figure is the points it added to the 100-point composite (weight × sub-score).
- Cash flow +30.0/30.0
- 1% rule +10.0/10.0
- DSCR +10.0/10.0
- ARV discount +7.5/15.0
- Appreciation +5.2/10.0
- Schools +3.4/10.0
- Livability +3.0/5.0
- Rent growth +2.5/5.0
- Condition / age +2.5/5.0
$45,000
🖨 Deal sheet (PDF) 📄 Offer letter ✓ Due diligence
Listing remarks MLS
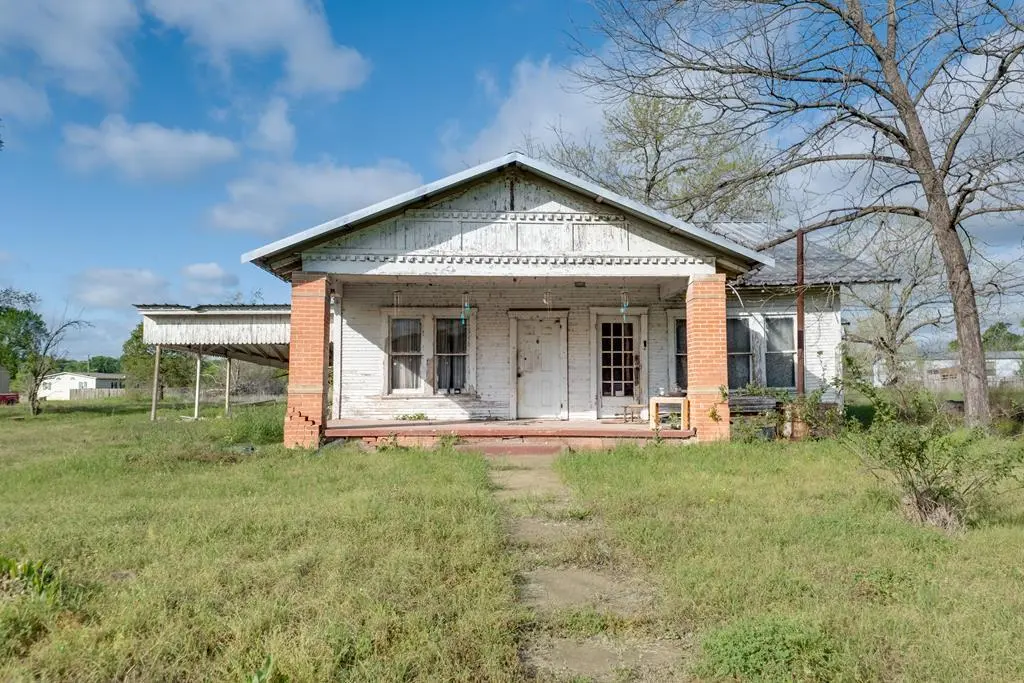
Investor Special – Farmhouse with Endless Potential Opportunity awaits with this classic frame farmhouse sitting on a pier & beam foundation, ready for someone with vision to bring it back to life. This property has been vacant for an extended period and is being sold as-is, offering a unique chance for investors, flippers, or buyers looking to create their dream rural retreat. Inside, you'll find the home filled with a variety of contents accumulated over time, providing a true clean-out and renovation project from top to bottom. The structure itself offers a solid starting point, with traditional farmhouse character just waiting to be restored. The pier & beam foundation allows for easier access to plumbing and electrical updates, making it an ideal candidate for a full rehab. With the right improvements, this property could be transformed into a charming residence, rental, or resale opportunity. If you're looking for a project with upside potential and aren't afraid to roll up your sleeves, this farmhouse could be the investment you've been searching for. Bring your contractor and your imagination. .. this one has possibilities written all over it! AI was used to remove debris.
Key facts
- Pier beam foundation
- Resale opportunity
- Full rehab
Tags
Neighborhood map
What this means for you Summary
Snapshot
- This is a 3-bed/1.0-bath single-family listed at $45k.
Deal economics
- At list price, monthly cash flow is $664 ($8k/yr) — positive.
- The deal already cash-flows at list — no discount required.
- Meets the 1% rule at list price ($1k rent vs $45k).
- Recommended offer: $42k (6.0% below list) — sets the bar for market timing.
Location & tenants
- Location reads 59/100 on livability (#1,177 in TX) — a working-class tenant base; expect higher turnover. Strengths: cost of living A+, housing A+; Watch: schools D+, crime F, amenities F.
- Oakwood ISD (rural): math 35% / reading 40% proficiency, ranked #853 of 1,141 in TX (top 75%) — families likely to look elsewhere, expect single-tenant / working-renter base with shorter leases; 72% free/reduced lunch — lower-income household profile, screen leases tightly.
- Market conditions: 53 active listings in the ZIP.
Forward outlook
- In year one you build about $467 of equity ($311 loan paydown + $156 appreciation (0.3% local appreciation)).
- At projected returns (0.3% appreciation + 3.0% rent growth), your $13k cash investment doubles in ~2 years — after that, you're playing with house money.
Negotiation context
- It's been on market 75 days — a 6% lower offer ($42k) is reasonable based on typical stale-listing flexibility.
Risks & watch-outs
- Watch-outs: built in 1945 — expect roof / HVAC / electrical / plumbing capex.
- Climate carrying-cost: severe wind risk, 80% chance of damaging wind over 30y; extreme-heat days projected 7→27/yr by 2055 (HVAC capex compounding) — expect insurance premiums to compound above CPI over the hold.
Questions for the listing agent
- It's been on market 75 days. Have you received any prior offers? Is the seller open to a 6% concession, seller financing, or rate buy-down credit?
- Built in 1945 — when were the roof, HVAC, electrical panel, plumbing, and water heater last replaced?
- Why hasn't it sold? Are there any deal-killer items the seller is aware of (foundation, flood, title, zoning, code violations)?
- Is there a deadline driving the sale (1031 exchange, divorce, estate, relocation)? That informs how much negotiation room exists.
- Schools are D-rated, which usually means shorter tenancies and higher turnover. Who's the typical renter profile here, and what's been the actual vacancy rate?
- Crime grade is F in this area — have there been break-ins, vandalism, or insurance claims at this property in the last 3 years? What carrier currently insures it and at what premium?
- What's the average days-on-market for RENTAL listings here right now (not sales)? A rising rental-DOM trend means longer vacancies and softer asking-rent achievability than the comps imply.
- What's the recent tenant-quality profile in this submarket — average credit score on applications, eviction rate, late-payment / NSF rate, and stable-employment percentage? A property-management company in the area should have these aggregated.
- How much new for-sale + rental construction is in the pipeline within 1–3 miles? Heavy new supply typically softens prices + rents 12–24 months out; constrained supply supports both.
Investment metrics
- 1% rule
- 2.74% ✓
- Cap rate
- 24.01%
- Cash-on-cash
- 63.27%
- DSCR
- 3.82
- GRM
- 3.0
CMA / ARV
- ARV (median comp)
- $132,337
- List price
- $45,000
- Delta
- -66.00%
- Verdict
- UNDERPRICED
- Comps
- 3 within 1.0 mi
Show comp detail 1 sale within ~0.75 mi
| Address | Dist | Beds/Ba | Sqft | Sold | Price | $/sf | Match |
|---|---|---|---|---|---|---|---|
| 623 N Granger St | 0.59mi | 4/2.0 (+1) | 1,983 (-0%) | 11mo | $175,000 | $88 | 54 |
Match score weights: distance 35% · size 25% · config 20% · recency 20%. Top-matched comps best support the ARV.
Projected returns pro-forma
0.35% appreciation · 3.0% rent growth · sell at horizon
- IRR
- 65.5%
- Equity multiple
- 4.31×
- Total profit
- $41,751
- Equity at exit
- $13,851
- IRR
- 67.2%
- Equity multiple
- 8.75×
- Total profit
- $97,664
- Equity at exit
- $17,288
Cash invested: $12,600 (down + closing). Projections, not guarantees.
Landlord ↔ Tenant lean methodology
- Overall (STATE)
- 87 Strongly Landlord-Friendly
- State Texas
- 87 Strongly Landlord-Friendly · R+5
- County
- — inherits STATE
- City
- — inherits STATE
ZIP-level market 75855
- Home prices YoY
- 0.3%
- Active inventory
- 53
- Price-to-rent
- 3.0×
Monthly cashflow live
- Estimated rent
- $1,235 medium interval (Pro) →
- Mortgage (P&I)
- −$236
- Tax est. 1.5%
- −$56 /mo · $675/yr
- Insurance
- −$19
- HOA
- −$0
- Vacancy / Maint / Mgmt
- −$259
- Net cashflow
- $664
Break-even live
Sensitivity live
| Price | -10% $695 | -5% $680 | +0% $664 | +5% $649 | +10% $633 |
|---|---|---|---|---|---|
| Rent | -10% $567 | -5% $616 | +0% $664 | +5% $713 | +10% $762 |
| Rate | -1.0pp $687 | -0.5pp $676 | base $664 | +0.5pp $653 | +1.0pp $641 |
UW: 25.0% down · 7.5% · 30yr · 1.5% tax · 5.0% vac · 8.0% maint · 8.0% mgmt
Financing live
Cash to close
- Down payment
- $11,250
- Closing costs
- $1,350
- Reserves months
- —
- Total cash needed
- —
Loan-product check · same deal, 3 products live
Conventional
25% down · 7.5% · 30yr
- Down + closing
- —
- Monthly P&I
- —
- Monthly cashflow
- —
- DSCR
- —
- Eligible?
- —
Personal DTI + credit; lowest rate.
DSCR
20% down · 8.5% · 30yr
- Down + closing
- —
- Monthly P&I
- —
- Monthly cashflow
- —
- DSCR
- —
- Eligible?
- —
No personal income docs; deal must DSCR.
Hard money
10% down · 12.0% · 12mo
- Down + closing
- —
- Monthly P&I
- —
- Monthly cashflow
- —
- DSCR
- —
- Eligible?
- —
Short-term bridge; refi at stabilization.
Listing history 22 events
-
2026-06-21days on market $45,000 Active 75 DOM
-
2026-06-19days on market $45,000 Active 73 DOM
-
2026-06-18days on market $45,000 Active 72 DOM
-
2026-06-17days on market $45,000 Active 71 DOM
-
2026-06-16days on market $45,000 Active 70 DOM
-
2026-06-15days on market $45,000 Active 69 DOM
-
2026-06-14days on market $45,000 Active 67 DOM
-
2026-06-12days on market $45,000 Active 66 DOM
-
2026-06-09days on market $45,000 Active 63 DOM
-
2026-06-08days on market $45,000 Active 62 DOM
-
2026-06-07days on market $45,000 Active 61 DOM
-
2026-06-05days on market $45,000 Active 59 DOM
-
2026-06-04days on market $45,000 Active 57 DOM
-
2026-06-02days on market $45,000 Active 56 DOM
-
2026-06-01days on market $45,000 Active 55 DOM
-
2026-05-31days on market $45,000 Active 54 DOM
-
2026-05-31days on market $45,000 Active 53 DOM
-
2026-05-08price $45,000 1217-char remark
Show marketing remark (1217 chars)
Investor Special – Farmhouse with Endless Potential Opportunity awaits with this classic frame farmhouse sitting on a pier & beam foundation, ready for someone with vision to bring it back to life. This property has been vacant for an extended period and is being sold as-is, offering a unique chance for investors, flippers, or buyers looking to create their dream rural retreat. Inside, you'll find the home filled with a variety of contents accumulated over time, providing a true clean-out and renovation project from top to bottom. The structure itself offers a solid starting point, with traditional farmhouse character just waiting to be restored. The pier & beam foundation allows for easier access to plumbing and electrical updates, making it an ideal candidate for a full rehab. With the right improvements, this property could be transformed into a charming residence, rental, or resale opportunity. If you're looking for a project with upside potential and aren't afraid to roll up your sleeves, this farmhouse could be the investment you've been searching for. Bring your contractor and your imagination. .. this one has possibilities written all over it! AI was used to remove debris.
-
2026-04-07$115,000 Active 1217-char remark
Show marketing remark (1217 chars)
Investor Special – Farmhouse with Endless Potential Opportunity awaits with this classic frame farmhouse sitting on a pier & beam foundation, ready for someone with vision to bring it back to life. This property has been vacant for an extended period and is being sold as-is, offering a unique chance for investors, flippers, or buyers looking to create their dream rural retreat. Inside, you'll find the home filled with a variety of contents accumulated over time, providing a true clean-out and renovation project from top to bottom. The structure itself offers a solid starting point, with traditional farmhouse character just waiting to be restored. The pier & beam foundation allows for easier access to plumbing and electrical updates, making it an ideal candidate for a full rehab. With the right improvements, this property could be transformed into a charming residence, rental, or resale opportunity. If you're looking for a project with upside potential and aren't afraid to roll up your sleeves, this farmhouse could be the investment you've been searching for. Bring your contractor and your imagination. .. this one has possibilities written all over it! AI was used to remove debris.
-
2012-06-18soldstatus
-
2006-09-01soldstatus $44,000
-
2006-08-01soldstatus
ⓘ Source: listings_history table (triggers on properties + properties_extension) + one-shot
backfill from property_details.listing_events for pre-trigger history.
Climate risk First Street
- Flood 1/10 Low FEMA zone X (unshaded) · 0% chance over 30 yrs
- Wildfire 3/10 Moderate
- Heat 8/10 Severe 7 d/yr ≥110°F today · 27 d/yr by 30 yrs out
- Wind 8/10 Severe 80% chance of damaging wind over 30 yrs
- Air quality 1/10 Low 0 unhealthy d/yr today · 0 by 30 yrs out
Nearby sold comps map
Loading sold comps map…
Walkable amenities ~0.75 mi
Loading nearby amenities…
Taxation est. · year 1
- Rental income
- $14,815
- − Mortgage interest
- −$2,521
- − Property taxes
- −$675
- − Insurance
- −$225
- − Repairs & maintenance
- −$1,185
- − Management
- −$1,185
- − Depreciation
- −$1,309
- Taxable income
- $7,715
- Est. tax owed @ 24.0%
- −$1,852
- After-tax cash flow
- $6,121/yr
For passive investors: Depreciation is non-cash, so a rental often shows a tax loss while cash-flowing — sheltering income. Rental losses are passive: they offset passive income freely, and up to $25,000/yr can offset ordinary (W-2) income if you actively participate and your MAGI is under $100k (phasing out to $0 by $150k); unused losses carry forward. On sale, claimed depreciation is recaptured at up to 25%, and gains may owe capital-gains tax (a 1031 exchange can defer both). Figures are a year-1 estimate at your 24.0% rate — not tax advice; consult a CPA.
Schools (NCES district)
- District
- Oakwood ISD
- NCES district ID
- 4833340
- Math proficiency
- 35% ▼ -25.00%
- Reading proficiency
- 40% ▼ -10.00%
- Median HH income
- $35,317
- Composite
- 33.54/100
- National rank
- #10506
- State rank
- #853 of 1141 in TX
Livability — Oakwood
- Score
- 59/100
- State rank
- #1177
- US rank
- #20592
Category grades
Schools grade is shown separately in the Schools card above.
Census & demographics
- Census place
- Oakwood, TX
- Population (ZIP)
- 2,779
Population outlook (Leon County) Hauer SSP2
- Today (2025)
- 17,271 people
- By 2030
- 17,271 · +0.0%
- By 2040
- 17,151 · -0.7%
- By 2050
- 16,863 · -2.4%
- By 2075
- 16,304 · -5.6%
- By 2100
- 13,968 · -19.1%
Race, ethnicity, and origin ACS 2023
- Neighborhood character
- Predominantly White (77%)
- Race & ethnicity
- White 77% Black 14% Two or more races 5% Hispanic / Latino 3%
- Common ancestry
- Romanian 4% Portuguese 1%
- Foreign-born
- 1% · Canada, Vietnam
- Languages at home
- 96% English-only · Spanish 3%
Political lean MEDSL · Leon
- 2024 margin
- Solid R (+76.7) · D 11.4% · R 88.1%
- 2008→2024 swing
- -17.8pp toward R · 2008: -58.9pp · 2024: -76.7pp
- All cycles
- 2024: R+76.7 2020: R+74.4 2016: R+74.0 2012: R+68.4 2008: R+58.9
Not yet ingested
- Civics
- —
Market trends
- HPI YoY
- ▲ 0.35%
- Current HPI
- 121.0165
- Rent YoY
- —
- Metro
- —
- State GDP YoY
- ▲ 3.95%
- F500 in state
- 110
Industry mix (Fortune 500 HQ in TX)
| Industry | F500 HQs | Revenue |
|---|---|---|
| Energy | 16 | $1,198B |
|
||
| Technology | 5 | $198B |
|
||
| Engineering / Construction | 4 | $72B |
|
||
| Energy Services | 3 | $60B |
|
||
| Utilities | 3 | $41B |
|
||
| Healthcare | 2 | $330B |
|
||
Price history
+2.3% since first listed5 events — show timeline
- 2026-05-08 Price Changed $45,000 PAOR
- 2026-04-07 Listed $115,000 PAOR
- 2012-06-18 Sold (Public Records) — Public Records
- 2006-09-01 Sold (Public Records) $44,000 Public Records
- 2006-08-01 Sold (Public Records) — Public Records
Property tax history
+17.1%/yrLatest (2025): $2,551 · +164.6% YoY. Source: county tax records.
Cash-flow waterfall
monthlySold comps — $/sqft
last 12 mo · ≤1 miLoading sold comps…