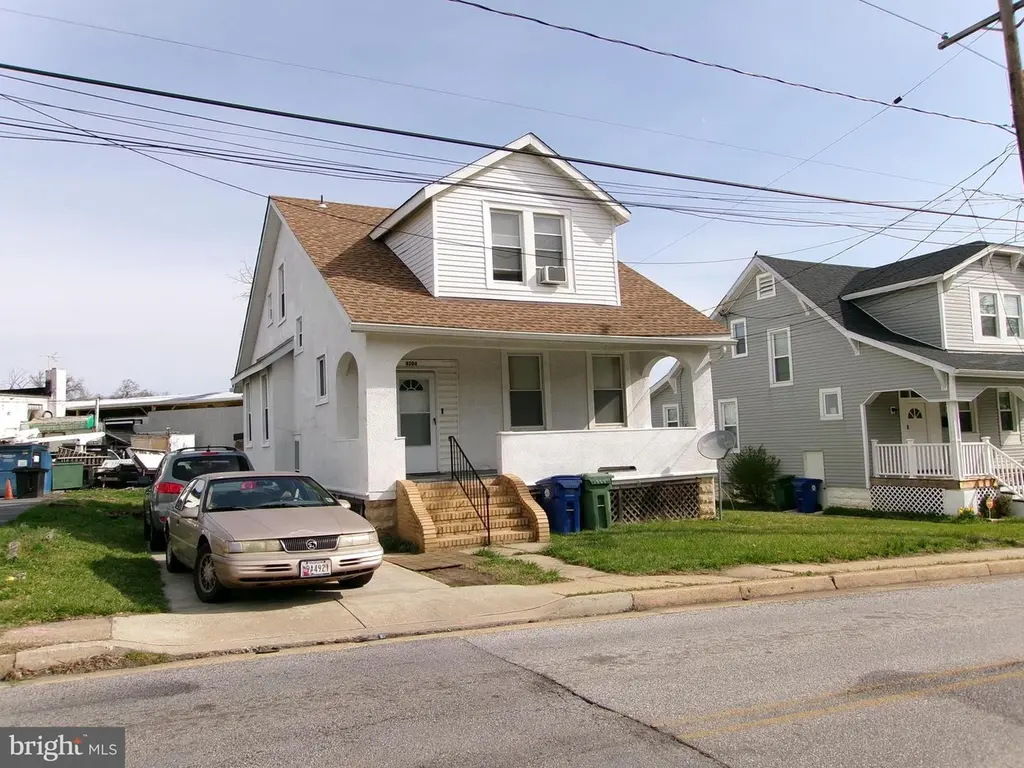
4204 Kenwood Ave · Baltimore, MD
Flood risk 1/10 · Minimal
- FEMA flood zone
- X (unshaded)
- Chance of flooding over 30 yrs
- 0.0%
- Est. flood insurance / yr
- $473 – $860
Fire risk 1/10 · Minimal
- Est. fire insurance / yr
- $755 – $1,403
Heat risk 7/10 · Major
- Hot days now (above 103°F)
- 7 days/yr
- Hot days in 30 yrs
- 15 days/yr
Wind risk 6/10 · Moderate
- Chance of severe wind over 30 yrs
- 27.0%
Air-quality risk 4/10 · Minor
- Unhealthy air days now
- 5 days/yr
- Unhealthy air days in 30 yrs
- 7 days/yr
Risk factors via First Street. Map © Google.
Why this score? — see what drove the D grade
The composite is a weighted blend of 9 inputs, each scored 0–100. Each bar is that input's sub-score; the figure is the points it added to the 100-point composite (weight × sub-score).
- ARV discount +13.6/15.0
- Cash flow +12.1/30.0
- Livability +3.8/5.0
- DSCR +3.6/10.0
- Rent growth +3.6/5.0
- 1% rule +3.4/10.0
- Condition / age +2.5/5.0
- Schools +1.0/10.0
- Appreciation +0.0/10.0
$270,000
🖨 Deal sheet (PDF) 📄 Offer letter ✓ Due diligence
Listing remarks MLS
Large Well Maintained 2 Apartment Home that can Easily be Converted back to a Single Family Home. Live in One and Rent the Other to Help Pay your Mortgage! 2nd Floor offers 1 Bedroom, Large Closets, Full Kitchen and Bath. New Tub Enclosure and Floor in Bath, New Kitchen Floor, Living Room and Large Storage room. 1st Floor features New Floors and New Carpet, Large Closets in every room (Some Walk In), French Doors between Living Room and Dining Room, Foyer, Full Unfinished Lower Level, Covered Front Porch, Side Entrance and Driveway. Separate Meters. Zoned. Must See! If possible prefer to use Cardinal Title Group.
Key facts
- New floors
- Covered front porch
- New tub enclosure
Tags
Neighborhood map
What this means for you Summary
Snapshot
- This is a 3-bed/2.0-bath single-family listed at $270k.
Deal economics
- At list price, monthly cash flow is $-57 ($-683/yr) — negative.
- To cash-flow at today's rent, offer at most $260k (3.7% below list).
- To meet the 1% rule (rent ≥ 1% of price), the offer needs to be $226k (16.5% below list).
- Recommended offer: $226k (16.5% below list) — sets the bar for 1% rule.
Location & tenants
- Location reads 76/100 on livability (#90 in MD, #3,396 nationally) — a middle-class / working-renter tenant base. Strengths: amenities A+, commute A+, housing A+; Watch: crime F.
- Baltimore City Public Schools (urban): math 7% / reading 16% proficiency, ranked #24 of 24 in MD (top 100%) — low school quality limits family demand, transient renter base, plan for 1-2y turnover; 79% free/reduced lunch — lower-income household profile, screen leases tightly.
- Zoned schools: Glenmount Elementary/Middle (math 6% / reading 15%, grade F, #590 of 860 statewide, top 70%, 657 students, 76% FRL); Baltimore Polytechnic Institute (math 71% / reading 84%, grade A-, #22 of 222 statewide, top 10%, 1,555 students, 43% FRL) — zoned schools average 60% FRL vs 79% district-wide (20 pts lower); this property's tenant base skews higher-income than the district average.
- Zoned-school proficiency averages 44% at this address vs 12% district-wide (+32 pts) — the actual schools serving this property are materially stronger than the Baltimore City Public Schools average implies; a family-tenant draw the district grade alone would hide.
- Market conditions: Rents rising fast (+4.4%/yr); 180 active listings in the ZIP; 22 comparable units currently listed for rent nearby; rentals at typical pace (median 26d on market — plan ~3-4 weeks tenant-placement turnaround); 1,273 units permitted in Baltimore city in 2024 (1,104 in 5+ unit buildings).
- This rent runs 42% of the median local income ($65k/yr) — at the standard rent-burdened threshold; future hikes will face affordability resistance.
Forward outlook
- Local home prices are declining (-3.0%/yr); year-one equity from $2k of loan paydown is wiped out by about $8k of value loss. Plan a longer hold.
- Baltimore County population projected to shrink 4% by 2050 — rents likely to lag national; underwrite the cash flow, not the appreciation.
Negotiation context
- It's been on market 444 days — a 12% lower offer ($238k) is reasonable based on typical stale-listing flexibility.
- 3 sale attempts since 28y ago with the ask held roughly flat each time — persistent listings suggest the price (not the market) is what's stuck; bring a comps-based counter.
- Current owner paid $50k; list at $270k implies a 440% gain — meaningful room to come down on a strong offer.
Risks & watch-outs
- Watch-outs: built in 1925 — expect roof / HVAC / electrical / plumbing capex.
- Climate carrying-cost: major wind risk, 27% chance of damaging wind over 30y; extreme-heat days projected 7→15/yr by 2055 (HVAC capex compounding) — expect insurance premiums to compound above CPI over the hold.
Questions for the listing agent
- What do current leases actually rent for vs. the listed asking? Can we see a recent rent roll and the last 12 months of T-12 income?
- It's been on market 444 days. Have you received any prior offers? Is the seller open to a 16% concession, seller financing, or rate buy-down credit?
- Built in 1925 — when were the roof, HVAC, electrical panel, plumbing, and water heater last replaced?
- Why hasn't it sold? Are there any deal-killer items the seller is aware of (foundation, flood, title, zoning, code violations)?
- Is there a deadline driving the sale (1031 exchange, divorce, estate, relocation)? That informs how much negotiation room exists.
- Schools are D-rated, which usually means shorter tenancies and higher turnover. Who's the typical renter profile here, and what's been the actual vacancy rate?
- Crime grade is F in this area — have there been break-ins, vandalism, or insurance claims at this property in the last 3 years? What carrier currently insures it and at what premium?
- The area grade is low — what's the realistic commute time and amenity access for the typical tenant pool here? Any planned neighborhood developments (good or bad) we should know about?
- What's the average days-on-market for RENTAL listings here right now (not sales)? A rising rental-DOM trend means longer vacancies and softer asking-rent achievability than the comps imply.
- What's the recent tenant-quality profile in this submarket — average credit score on applications, eviction rate, late-payment / NSF rate, and stable-employment percentage? A property-management company in the area should have these aggregated.
- How much new for-sale + rental construction is in the pipeline within 1–3 miles? Heavy new supply typically softens prices + rents 12–24 months out; constrained supply supports both.
Investment metrics
- 1% rule
- 0.84% ✗
- Cap rate
- 6.04%
- Cash-on-cash
- -0.90%
- DSCR
- 0.96
- GRM
- 10.0
CMA / ARV
- ARV (median comp)
- $312,057
- List price
- $270,000
- Delta
- -13.48%
- Verdict
- UNDERPRICED
- Comps
- 20 within 1.0 mi
Show comp detail 12 sales within ~0.75 mi
| Address | Dist | Beds/Ba | Sqft | Sold | Price | $/sf | Match |
|---|---|---|---|---|---|---|---|
| 6105 Walther Ave | 0.74mi | 3/2.0 | 1,500 (-0%) | 1mo | $250,000 | $167 | 64 |
| 4412 Springwood Ave | 0.40mi | 3/1.5 | 1,624 (+8%) | 3mo | $295,000 | $182 | 64 |
| 3800 E Northern Pkwy | 0.37mi | 4/2.0 (+1) | 1,408 (-6%) | 4mo | $305,000 | $217 | 64 |
| 524 Elmwood Rd | 0.42mi | 3/1.5 | 1,650 (+10%) | 1mo | $319,000 | $193 | 62 |
| 4103 Glenmore Ave | 0.31mi | 4/2.5 (+1) | 1,666 (+11%) | 2mo | $280,000 | $168 | 59 |
| 4422 Forest View Ave | 0.27mi | 4/2.0 (+1) | 1,686 (+12%) | 4mo | $150,000 | $89 | 59 |
| 3814 Walnut Ave | 0.47mi | 3/2.0 | 1,290 (-14%) | 0mo | $299,000 | $232 | 54 |
| 4502 Parkmont Ave | 0.51mi | 4/2.0 (+1) | 1,642 (+9%) | 4mo | $325,000 | $198 | 52 |
| 4433 Raspe Ave | 0.37mi | 4/2.5 (+1) | 1,720 (+14%) | 6mo | $309,000 | $180 | 47 |
| 713 Dale Ave | 0.46mi | 4/2.0 (+1) | 1,304 (-13%) | 7mo | $371,000 | $285 | 46 |
| 13 Elmont Ave | 0.67mi | 3/2.0 | 1,716 (+14%) | 2mo | $375,000 | $219 | 43 |
| 6000 Glen Falls Ave | 0.71mi | 4/2.0 (+1) | 1,282 (-15%) | 3mo | $205,000 | $160 | 35 |
Match score weights: distance 35% · size 25% · config 20% · recency 20%. Top-matched comps best support the ARV.
Projected returns pro-forma
-3.0% appreciation · 4.43% rent growth · sell at horizon
- IRR
- -16.2%
- Equity multiple
- 0.42×
- Total profit
- $-44,068
- Equity at exit
- $40,258
- IRR
- -5.6%
- Equity multiple
- 0.62×
- Total profit
- $-29,064
- Equity at exit
- $23,345
Cash invested: $75,600 (down + closing). Projections, not guarantees.
Landlord ↔ Tenant lean methodology
- Overall (CITY)
- 12 Strongly Tenant-Friendly
- State Maryland
- 27 Tenant-Leaning · D+14
- County
- — inherits STATE
- City Baltimore
- 12 Strongly Tenant-Friendly · D+58
ZIP-level market 21206
- Rents YoY
- 4.4%
- Active inventory
- 180
- Price-to-rent
- 10.0×
Monthly cashflow live
- Estimated rent
- $2,256 high interval (Pro) →
- Mortgage (P&I)
- −$1,416
- Tax from tax record
- −$310 /mo · $3,725/yr
- Insurance
- −$112
- HOA
- −$0
- Vacancy / Maint / Mgmt
- −$474
- Net cashflow
- $-57
Break-even live
Sensitivity live
| Price | -10% $96 | -5% $20 | +0% $-57 | +5% $-133 | +10% $-210 |
|---|---|---|---|---|---|
| Rent | -10% $-235 | -5% $-146 | +0% $-57 | +5% $32 | +10% $121 |
| Rate | -1.0pp $79 | -0.5pp $12 | base $-57 | +0.5pp $-127 | +1.0pp $-198 |
UW: 25.0% down · 7.5% · 30yr · 1.5% tax · 5.0% vac · 8.0% maint · 8.0% mgmt
Financing live
Cash to close
- Down payment
- $67,500
- Closing costs
- $8,100
- Reserves months
- —
- Total cash needed
- —
Loan-product check · same deal, 3 products live
Conventional
25% down · 7.5% · 30yr
- Down + closing
- —
- Monthly P&I
- —
- Monthly cashflow
- —
- DSCR
- —
- Eligible?
- —
Personal DTI + credit; lowest rate.
DSCR
20% down · 8.5% · 30yr
- Down + closing
- —
- Monthly P&I
- —
- Monthly cashflow
- —
- DSCR
- —
- Eligible?
- —
No personal income docs; deal must DSCR.
Hard money
10% down · 12.0% · 12mo
- Down + closing
- —
- Monthly P&I
- —
- Monthly cashflow
- —
- DSCR
- —
- Eligible?
- —
Short-term bridge; refi at stabilization.
Rent comps 22 comps
| Address | Beds | Baths | Sqft | Rent | $/sqft | DOM | Units | Dist |
|---|---|---|---|---|---|---|---|---|
| 29 E Elm Ave Baltimore, MD | 3.0 | 2.0 | 2052 | $3,000 | $1.46 | 6d | 1 | 0.47mi |
| 6410 Walther Ave Baltimore, MD | 2.0 | 1.0–2.0 | 1195 | $1,995 | $1.67 | 45d | 7 | 0.59mi |
| 5938 Clayton Ave Baltimore, MD | 4.0 | 2.0 | 1296 | $2,872 | $2.22 | 18d | 1 | 0.70mi |
| 35-C Mopec Cir Nottingham, MD | 2.0 | 1.0 | 1100 | $1,445 | $1.31 | 0d | 9 | 0.71mi |
| 3412 Fleetwood Ave Baltimore, MD | 3.0 | 2.5 | 1620 | $2,195 | $1.35 | 45d | 1 | 0.71mi |
| 4111 Century Rd Baltimore, MD | 3.0 | 1.5 | 1432 | $2,500 | $1.75 | 45d | 1 | 0.78mi |
| 5 Belhaven Dr Nottingham, MD | 4.0 | 1.5 | 1554 | $2,000 | $1.29 | 45d | 1 | 0.81mi |
| 5926 Belle Vista Ave Baltimore, MD | 3.0 | 2.0 | 1248 | $2,250 | $1.80 | 0d | 1 | 0.82mi |
| 100 Elinor Ave Nottingham, MD | 4.0 | 2.5 | 1800 | $2,800 | $1.56 | 25d | 1 | 0.90mi |
| 5110 Kenwood Ave Baltimore, MD | 3.0 | 1.5 | 1406 | $2,500 | $1.78 | 45d | 1 | 0.90mi |
| 101 Elinor Ave Nottingham, MD | 4.0 | 2.0 | 1476 | $2,900 | $1.96 | 45d | 1 | 0.92mi |
| 3158 Woodring Ave Parkville, MD | 3.0 | 1.5 | 1500 | $1,950 | $1.30 | 25d | 1 | 0.98mi |
| 4308 Hamilton Ave Baltimore, MD | 2.0 | 1.0 | 1110 | $1,416 | $1.28 | 25d | 1 | 1.12mi |
| 5307 Valiquet Ave Unit A Baltimore, MD | 2.0 | 1.0 | 1672 | $1,375 | $0.82 | 45d | 1 | 1.15mi |
| 5632 Belair Rd Baltimore, MD | 3.0 | 1.5 | 1260 | $2,100 | $1.67 | 25d | 1 | 1.19mi |
| 5676 Utrecht Rd Baltimore, MD | 3.0 | 2.0 | 1334 | $2,195 | $1.65 | 0d | 1 | 1.20mi |
| 3108 Glendale Ave Parkville, MD | 3.0 | 3.0 | 1224 | $2,550 | $2.08 | 25d | 1 | 1.28mi |
| 3510 Hamilton Ave Baltimore, MD | 3.0 | 2.5 | 2100 | $2,300 | $1.10 | 25d | 1 | 1.37mi |
| 5413 Pembroke Ave Baltimore, MD | 3.0 | 2.0 | 1350 | $1,895 | $1.40 | 0d | 1 | 1.37mi |
| 3026 Lavender Ave Parkville, MD | 2.0 | 2.0 | 2000 | $1,850 | $0.93 | 25d | 1 | 1.41mi |
| 3617 Double Rock Ln Parkville, MD | 3.0 | 2.5 | 2000 | $2,395 | $1.20 | 6d | 1 | 1.43mi |
| 3721 Frankford Ave Baltimore, MD | 3.0 | 2.0 | 1600 | $2,050 | $1.28 | 45d | 1 | 1.46mi |
Listing history 19 events
-
2026-06-21days on market $270,000 Active 444 DOM
-
2026-06-18days on market $270,000 Active 441 DOM
-
2026-06-17days on market $270,000 Active 440 DOM
-
2026-06-16days on market $270,000 Active 439 DOM
-
2026-06-15days on market $270,000 Active 438 DOM
-
2026-06-13pricedays on market $270,000 Active 436 DOM
-
2026-06-09days on market $280,000 Active 432 DOM
-
2026-06-08days on market $280,000 Active 431 DOM
-
2026-06-07days on market $280,000 Active 430 DOM
-
2026-06-04days on market $280,000 Active 427 DOM
-
2026-06-03days on market $280,000 Active 426 DOM
-
2026-06-02days on market $280,000 Active 425 DOM
-
2026-06-01days on market $280,000 Active 424 DOM
-
2026-05-31days on market $280,000 Active 423 DOM
-
2025-04-03$280,000 Active 621-char remark
Show marketing remark (623 chars)
Large Well Maintained 2 Apartment Home that can Easily be Converted back to a Single Family Home. Live in One and Rent the Other to Help Pay your Mortgage! 2nd Floor offers 1 Bedroom, Large Closets, Full Kitchen and Bath. New Tub Enclosure and Floor in Bath, New Kitchen Floor, Living Room and Large Storage room. 1st Floor features New Floors and New Carpet, Large Closets in every room (Some Walk In), French Doors between Living Room and Dining Room, Foyer, Full Unfinished Lower Level, Covered Front Porch, Side Entrance and Driveway. Separate Meters. Zoned. Must See! If possible prefer to use Cardinal Title Group.
-
2025-04-03$280,000 Active 623-char remark
Show marketing remark (623 chars)
Large Well Maintained 2 Apartment Home that can Easily be Converted back to a Single Family Home. Live in One and Rent the Other to Help Pay your Mortgage! 2nd Floor offers 1 Bedroom, Large Closets, Full Kitchen and Bath. New Tub Enclosure and Floor in Bath, New Kitchen Floor, Living Room and Large Storage room. 1st Floor features New Floors and New Carpet, Large Closets in every room (Some Walk In), French Doors between Living Room and Dining Room, Foyer, Full Unfinished Lower Level, Covered Front Porch, Side Entrance and Driveway. Separate Meters. Zoned. Must See! If possible prefer to use Cardinal Title Group.
-
1998-12-31historical
-
1998-03-17
-
1987-01-12soldstatus $50,000
ⓘ Source: listings_history table (triggers on properties + properties_extension) + one-shot
backfill from property_details.listing_events for pre-trigger history.
Tax reassessment forecast MD · Partial reset (capped growth)
- Current annual tax
- $3,725 · $310/mo
- Projected year-2 tax
- $3,725 · $310/mo
- Expected delta
- $0/yr ($0/mo · 0.0%)
ⓘ Screening estimate from a state-policy table — verify with the county assessor before closing.
Climate risk First Street
- Flood 1/10 Low FEMA zone X (unshaded) · 0% chance over 30 yrs
- Wildfire 1/10 Low
- Heat 7/10 Severe 7 d/yr ≥103°F today · 15 d/yr by 30 yrs out
- Wind 6/10 Major 27% chance of damaging wind over 30 yrs
- Air quality 4/10 Moderate 5 unhealthy d/yr today · 7 by 30 yrs out
Nearby sold comps map
Loading sold comps map…
Walkable amenities ~0.75 mi
Loading nearby amenities…
Taxation est. · year 1
- Rental income
- $27,067
- − Mortgage interest
- −$15,124
- − Property taxes
- −$3,725
- − Insurance
- −$1,350
- − Repairs & maintenance
- −$2,165
- − Management
- −$2,165
- − Depreciation
- −$7,855
- Taxable loss
- −$5,317
- Est. tax savings @ 24.0%
- +$1,276
- After-tax cash flow
- $593/yr
For passive investors: Depreciation is non-cash, so a rental often shows a tax loss while cash-flowing — sheltering income. Rental losses are passive: they offset passive income freely, and up to $25,000/yr can offset ordinary (W-2) income if you actively participate and your MAGI is under $100k (phasing out to $0 by $150k); unused losses carry forward. On sale, claimed depreciation is recaptured at up to 25%, and gains may owe capital-gains tax (a 1031 exchange can defer both). Figures are a year-1 estimate at your 24.0% rate — not tax advice; consult a CPA.
Schools (NCES district)
- District
- Baltimore City Public Schools
- NCES district ID
- 2400090
- Math proficiency
- 7% ▼ -9.00%
- Reading proficiency
- 16% ▼ -5.00%
- Median HH income
- $42,108
- Composite
- 10.08/100
- National rank
- #9805
- State rank
- #24 of 24 in MD
Livability — Baltimore
- Score
- 76/100
- State rank
- #90
- US rank
- #3396
Category grades
Schools grade is shown separately in the Schools card above.
Census & demographics
- Census place
- Baltimore, MD
- County
- Baltimore City · 558,601 people
- City population
- 588,727
- Metro
- Baltimore-Columbia-Towson, MD
- Population (ZIP)
- 48,902
- Household income
- $64,531
- Rent vs Own
- Severe rent burden
- 2317.0
Population outlook (Baltimore County) Hauer SSP2
- Today (2025)
- 624,249 people
- By 2030
- 621,541 · -0.4%
- By 2040
- 609,756 · -2.3%
- By 2050
- 597,249 · -4.3%
- By 2075
- 552,236 · -11.5%
- By 2100
- 513,934 · -17.7%
Race, ethnicity, and origin ACS 2023
- Neighborhood character
- Predominantly Black (73%)
- Race & ethnicity
- Black 73% White 20% Two or more races 3% Hispanic / Latino 3% Asian 2%
- Common ancestry
- Romanian 3% Ukrainian 1%
- Foreign-born
- 8% · Canada
- Languages at home
- 92% English-only · Spanish 2% Arabic 2% Other Indo-European 1%
Political lean MEDSL · Baltimore
- 2024 margin
- Solid D (+73.0) · D 85.2% · R 12.2% · Other 2.6%
- 2008→2024 swing
- -2.5pp toward R · 2008: 75.5pp · 2024: 73.0pp
- All cycles
- 2024: D+73.0 2020: D+76.6 2016: D+74.6 2012: D+76.4 2008: D+75.5
Not yet ingested
- Civics
- —
Market trends
- HPI YoY
- ▼ -191.83%
- Current HPI
- 284.5645
- Rent YoY
- ▲ 4.43%
- Metro
- Baltimore-Columbia-Towson, MD
- State GDP YoY
- ▲ 2.97%
- F500 in state
- 12
Industry mix (Fortune 500 HQ in MD)
| Industry | F500 HQs | Revenue |
|---|---|---|
| Aerospace / Defense | 1 | $71B |
|
||
| Utilities | 1 | $25B |
|
||
| Hotels | 1 | $24B |
|
||
| Consumer Goods | 1 | $7B |
|
||
| Real Estate | 1 | $6B |
|
||
| Chemicals | 1 | $2B |
|
||
Price history
+460.0% since first listed5 events — show timeline
- 2025-04-03 Listed $280,000 BRIGHT MLS
- 2025-04-03 Listed $280,000 BRIGHT MLS
- 1998-12-31 Delisted — MRIS
- 1998-03-17 Listed — MRIS
- 1987-01-12 Sold (Public Records) $50,000 Public Records
Property tax history
+0.2%/yrLatest (2025): $3,725 · +5.5% YoY. Source: county tax records.
Cash-flow waterfall
monthlySold comps — $/sqft
last 12 mo · ≤1 miLoading sold comps…