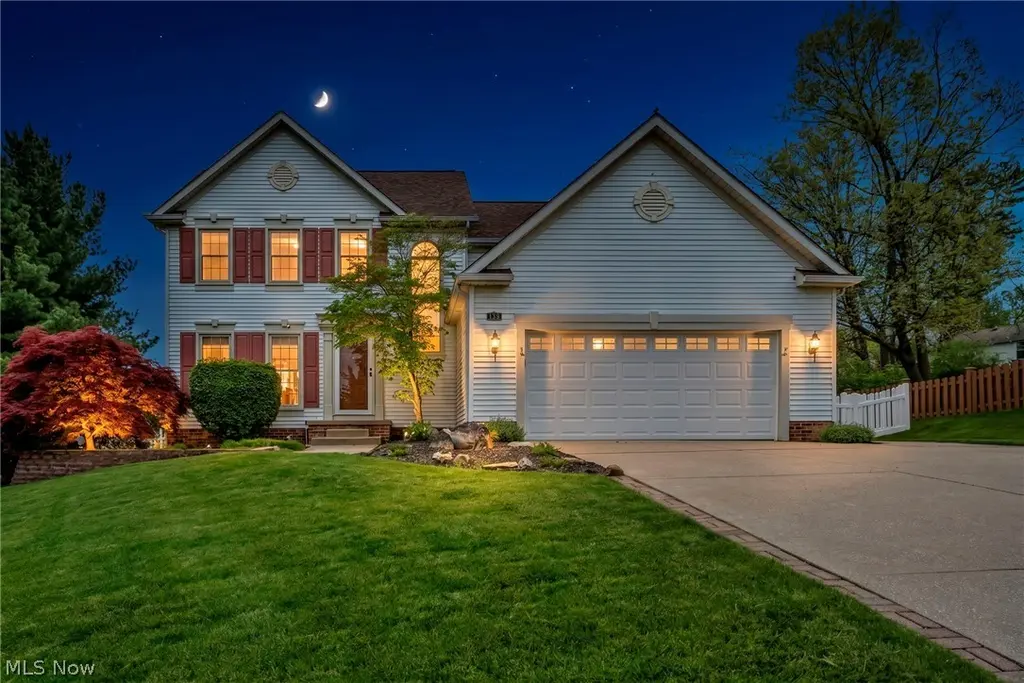
139 Mccleary Ct · Northfield, OH
Flood risk 1/10 · Minimal
- FEMA flood zone
- X (unshaded)
- Chance of flooding over 30 yrs
- 0.0%
- Est. flood insurance / yr
- $473 – $860
Fire risk 1/10 · Minimal
- Est. fire insurance / yr
- $713 – $1,323
Heat risk 3/10 · Minor
- Hot days now (above 96°F)
- 7 days/yr
- Hot days in 30 yrs
- 17 days/yr
Wind risk 1/10 · Minimal
- Chance of severe wind over 30 yrs
- —
Air-quality risk 2/10 · Minimal
- Unhealthy air days now
- 1 days/yr
- Unhealthy air days in 30 yrs
- 3 days/yr
Risk factors via First Street. Map © Google.
Why this score? — see what drove the B grade
The composite is a weighted blend of 9 inputs, each scored 0–100. Each bar is that input's sub-score; the figure is the points it added to the 100-point composite (weight × sub-score).
- Cash flow +30.0/30.0
- DSCR +10.0/10.0
- 1% rule +9.5/10.0
- Schools +6.6/10.0
- ARV discount +5.3/15.0
- Livability +4.0/5.0
- Rent growth +2.5/5.0
- Condition / age +2.5/5.0
- Appreciation +0.0/10.0
$450,000
🖨 Deal sheet (PDF) 📄 Offer letter ✓ Due diligence
Listing remarks
Welcome home to this well-maintained Eaton Estate property offering space, flexibility, and the lifestyle amenities that make this neighborhood so desirable. With 4 bedrooms, 2.5 baths, over 2,100 square feet, and an updated HVAC system already in place, you can focus less on projects and more on enjoying the next chapter. The main level offers a functional layout designed for everyday living, featuring multiple gathering spaces that provide flexibility for everything from entertaining to quiet evenings at home. Whether hosting family and friends or simply spreading out, the layout offers room to adapt to your lifestyle. All four bedrooms are located upstairs, including a spacious primary s
Key facts
- Updated hvac system
- Attached garage
- Finished basement
Tags
Property features AI
Finance
- Other: Below-grade finished area approximately 340 (estimated); Above-grade finished area approximately 2,134 (source: Realist)
- HOA & community: Homeowners association: Eaton Estate; Annual association fee ($425) covering common area maintenance, pool(s), recreation facilities and reserve fund; Community amenities include clubhouse, pool, fishing, sidewalks and tennis courts
Exterior
- Parking: Attached garage with 2 spaces
- Utilities: Public water; Public sewer
- Home design: Two-story home
- Construction: Vinyl siding; Asphalt roof; Built according to public records (year built source: Public Records)
- Exterior features: Gas grill; Private in-ground outdoor pool (association/community); Clubhouse, pool, fishing, sidewalks, tennis courts
Interior
- Kitchen: Dishwasher; Microwave; Range; Refrigerator; Eat-in kitchen
- Bedrooms: Multiple bedrooms located on the second floor
- Bathrooms: Two full bathrooms; One half bathroom; One main-level bathroom
- Heating & cooling: Central air conditioning; Forced-air gas heating
- Interior features: Accessible approach with ramp; Full, partially finished basement; Recreation room with a fireplace
- Laundry & utility: Washer; Dryer; Utility room in basement; First-floor laundry room
Neighborhood map
What this means for you Summary
Snapshot
- This is a 4-bed/2.5-bath single-family listed at $450k.
Deal economics
- At list price, monthly cash flow is $2k ($25k/yr) — positive.
- The deal already cash-flows at list — no discount required.
- Meets the 1% rule at list price ($7k rent vs $450k).
- Recommended offer: $443k (1.5% below list) — sets the bar for market timing.
- Cap rate 11.8% vs local median 5.2% in Northfield — top-decile yield for the area; either an underpriced asset or a hidden risk that comps aren't pricing in. Stress-test before assuming the spread holds.
Location & tenants
- Location reads 79/100 on livability (#143 in OH, #2,208 nationally) — a middle-class / working-renter tenant base. Strengths: schools A+, crime A+, cost of living A+; Watch: amenities F, commute F.
- Nordonia Hills City (suburban): math 72% / reading 79% proficiency, ranked #71 of 656 in OH (top 11%) — strong family-tenant draw, lease renewals of 3-5y typical; only 17% free/reduced lunch — higher-income household profile.
- Market conditions: 69 active listings in the ZIP; 1 comparable units currently listed for rent nearby; solid renter incomes; 1,114 units permitted in Summit County in 2024 (397 in 5+ unit buildings).
- At $6,547/mo this rent would consume 88% of the median local household income ($89k/yr) — very limited rent-growth headroom before tenants either downsize or default.
Forward outlook
- Local home prices are declining (-3.0%/yr); year-one equity from $3k of loan paydown is wiped out by about $14k of value loss. Plan a longer hold.
- Summit County population projected to shrink 6% by 2050 — rents likely to lag national; underwrite the cash flow, not the appreciation.
- At projected returns (-3.0% appreciation + 3.0% rent growth), your $126k cash investment doubles in ~7 years — after that, you're playing with house money.
Negotiation context
- It's been on market 15 days — a 2% lower offer ($443k) is reasonable based on typical stale-listing flexibility.
- 2 sale attempts since 6y ago with the ask held roughly flat each time — persistent listings suggest the price (not the market) is what's stuck; bring a comps-based counter.
Questions for the listing agent
- What does the HOA fee cover, when was the last increase, and are there any pending special assessments or reserve-fund shortfalls?
- Is there a deadline driving the sale (1031 exchange, divorce, estate, relocation)? That informs how much negotiation room exists.
- Schools are A-rated — typically a magnet for longer-tenancy family renters. What's the average tenant stay here, and is there a school-zone premium baked into asking?
- What's the average days-on-market for RENTAL listings here right now (not sales)? A rising rental-DOM trend means longer vacancies and softer asking-rent achievability than the comps imply.
- What's the recent tenant-quality profile in this submarket — average credit score on applications, eviction rate, late-payment / NSF rate, and stable-employment percentage? A property-management company in the area should have these aggregated.
- How much new for-sale + rental construction is in the pipeline within 1–3 miles? Heavy new supply typically softens prices + rents 12–24 months out; constrained supply supports both.
Investment metrics
- 1% rule
- 1.45% ✓
- Cap rate
- 11.79%
- Cash-on-cash
- 19.63%
- DSCR
- 1.87
- GRM
- 5.7
CMA / ARV
- ARV (median comp)
- $428,853
- List price
- $450,000
- Delta
- 4.93%
- Verdict
- FAIR
- Comps
- 20 within 1.0 mi
Show comp detail 12 sales within ~0.75 mi
| Address | Dist | Beds/Ba | Sqft | Sold | Price | $/sf | Match |
|---|---|---|---|---|---|---|---|
| 4930 Squire Dr | 0.21mi | 4/3.5 | 2,192 (+3%) | 2mo | $415,000 | $189 | 80 |
| 407 Woodside Dr | 0.32mi | 3/2.5 (-1) | 2,148 (+1%) | 9mo | $395,000 | $184 | 71 |
| 219 Baptist Cir | 0.09mi | 4/3.5 | 2,417 (+13%) | 4mo | $479,900 | $199 | 66 |
| 8708 Chesea Ct | 0.73mi | 4/2.5 | 2,189 (+3%) | 4mo | $387,500 | $177 | 58 |
| 417 Woodside Dr | 0.28mi | 3/2.5 (-1) | 2,355 (+10%) | 8mo | $425,000 | $180 | 58 |
| 445 Houghton Rd | 0.30mi | 3/1.5 (-1) | 1,906 (-11%) | 7mo | $250,000 | $131 | 53 |
| 376 Bishop Way | 0.66mi | 4/2.5 | 1,984 (-7%) | 7mo | $415,000 | $209 | 52 |
| 8564 Penfield Dr | 0.55mi | 4/2.5 | 2,391 (+12%) | 6mo | $485,000 | $203 | 49 |
| 8683 Pine Creek Ln | 0.61mi | 3/2.5 (-1) | 2,343 (+10%) | 3mo | $409,000 | $175 | 48 |
| 219 Monroe Dr | 0.41mi | 3/2.0 (-1) | 1,854 (-13%) | 9mo | $292,500 | $158 | 45 |
| 22 Fell Ave | 0.71mi | 4/1.5 | 1,951 (-9%) | 8mo | $260,000 | $133 | 42 |
| 8579 Pine Creek Ln | 0.69mi | 3/3.5 (-1) | 2,328 (+9%) | 9mo | $435,000 | $187 | 36 |
Match score weights: distance 35% · size 25% · config 20% · recency 20%. Top-matched comps best support the ARV.
Projected returns pro-forma
-3.0% appreciation · 3.0% rent growth · sell at horizon
- IRR
- 11.7%
- Equity multiple
- 1.46×
- Total profit
- $58,424
- Equity at exit
- $67,096
- IRR
- 20.7%
- Equity multiple
- 2.75×
- Total profit
- $220,276
- Equity at exit
- $38,908
Cash invested: $126,000 (down + closing). Projections, not guarantees.
Landlord ↔ Tenant lean methodology
- Overall (STATE)
- 73 Landlord-Friendly
- State Ohio
- 73 Landlord-Friendly · R+6
- County
- — inherits STATE
- City
- — inherits STATE
ZIP-level market 44067
- Active inventory
- 69
- Price-to-rent
- 5.7×
Monthly cashflow live
- Estimated rent
- $6,547 medium interval (Pro) →
- Mortgage (P&I)
- −$2,360
- Tax from tax record
- −$529 /mo · $6,350/yr
- Insurance
- −$188
- HOA
- −$35
- Vacancy / Maint / Mgmt
- −$1,375
- Net cashflow
- $2,061
Break-even live
Sensitivity live
| Price | -10% $2,315 | -5% $2,188 | +0% $2,061 | +5% $1,933 | +10% $1,806 |
|---|---|---|---|---|---|
| Rent | -10% $1,543 | -5% $1,802 | +0% $2,061 | +5% $2,319 | +10% $2,578 |
| Rate | -1.0pp $2,287 | -0.5pp $2,175 | base $2,061 | +0.5pp $1,944 | +1.0pp $1,825 |
UW: 25.0% down · 7.5% · 30yr · 1.5% tax · 5.0% vac · 8.0% maint · 8.0% mgmt
Financing live
Cash to close
- Down payment
- $112,500
- Closing costs
- $13,500
- Reserves months
- —
- Total cash needed
- —
Loan-product check · same deal, 3 products live
Conventional
25% down · 7.5% · 30yr
- Down + closing
- —
- Monthly P&I
- —
- Monthly cashflow
- —
- DSCR
- —
- Eligible?
- —
Personal DTI + credit; lowest rate.
DSCR
20% down · 8.5% · 30yr
- Down + closing
- —
- Monthly P&I
- —
- Monthly cashflow
- —
- DSCR
- —
- Eligible?
- —
No personal income docs; deal must DSCR.
Hard money
10% down · 12.0% · 12mo
- Down + closing
- —
- Monthly P&I
- —
- Monthly cashflow
- —
- DSCR
- —
- Eligible?
- —
Short-term bridge; refi at stabilization.
Rent comps 1 comps
| Address | Beds | Baths | Sqft | Rent | $/sqft | DOM | Units | Dist |
|---|---|---|---|---|---|---|---|---|
| 185 Heights Ave Unit 1496098P Northfield, OH | 4.0 | 2.0 | 1603 | $6,547 | $4.08 | 2d | 1 | 1.11mi |
HOA detail
- Monthly dues
- $35 · $420/yr
Listing history 3 events
-
2026-05-14$450,000 Active 1518-char remark
-
2020-10-08$335,000 Active
-
1997-10-28soldstatus $880,000
ⓘ Source: listings_history table (triggers on properties + properties_extension) + one-shot
backfill from property_details.listing_events for pre-trigger history.
Tax reassessment forecast OH · Partial reset (capped growth)
- Current annual tax
- $6,350 · $529/mo
- Projected year-2 tax
- $6,685 · $557/mo
- Expected delta
- +$335/yr (+$28/mo · 5.3%)
ⓘ Screening estimate from a state-policy table — verify with the county assessor before closing.
Climate risk First Street
- Flood 1/10 Low FEMA zone X (unshaded) · 0% chance over 30 yrs
- Wildfire 1/10 Low
- Heat 3/10 Moderate 7 d/yr ≥96°F today · 17 d/yr by 30 yrs out
- Wind 1/10 Low
- Air quality 2/10 Low 1 unhealthy d/yr today · 3 by 30 yrs out
Nearby sold comps map
Loading sold comps map…
Walkable amenities ~0.75 mi
Loading nearby amenities…
Taxation est. · year 1
- Rental income
- $78,564
- − Mortgage interest
- −$25,207
- − Property taxes
- −$6,350
- − Insurance
- −$2,250
- − Repairs & maintenance
- −$6,285
- − Management
- −$6,285
- − HOA
- −$420
- − Depreciation
- −$13,091
- Taxable income
- $18,676
- Est. tax owed @ 24.0%
- −$4,482
- After-tax cash flow
- $20,245/yr
For passive investors: Depreciation is non-cash, so a rental often shows a tax loss while cash-flowing — sheltering income. Rental losses are passive: they offset passive income freely, and up to $25,000/yr can offset ordinary (W-2) income if you actively participate and your MAGI is under $100k (phasing out to $0 by $150k); unused losses carry forward. On sale, claimed depreciation is recaptured at up to 25%, and gains may owe capital-gains tax (a 1031 exchange can defer both). Figures are a year-1 estimate at your 24.0% rate — not tax advice; consult a CPA.
Schools (NCES district)
- District
- Nordonia Hills City
- NCES district ID
- 3905004
- Math proficiency
- 72% ▼ -9.00%
- Reading proficiency
- 79% ▼ -3.00%
- Median HH income
- $74,658
- Composite
- 66.26/100
- National rank
- #428
- State rank
- #71 of 656 in OH
Livability — Northfield
- Score
- 79/100
- State rank
- #143
- US rank
- #2208
Category grades
Schools grade is shown separately in the Schools card above.
Census & demographics
- County
- Summit · 539,389 people
- Metro
- Akron, OH
- Population (ZIP)
- 19,917
- Household income
- $89,082
- Rent vs Own
- Severe rent burden
- 13.4
Population outlook (Summit County) Hauer SSP2
- Today (2025)
- 546,583 people
- By 2030
- 544,028 · -0.5%
- By 2040
- 531,363 · -2.8%
- By 2050
- 514,923 · -5.8%
- By 2075
- 481,765 · -11.9%
- By 2100
- 432,265 · -20.9%
Race, ethnicity, and origin ACS 2023
- Neighborhood character
- Predominantly White (85%)
- Race & ethnicity
- White 85% Black 6% Two or more races 4% Asian 3% Hispanic / Latino 2%
- Common ancestry
- Romanian 14% Slovak 3% Lithuanian 1%
- Foreign-born
- 6% · Canada, China
- Languages at home
- 94% English-only · Other Indo-European 2% Chinese 1% Spanish 1%
Political lean MEDSL · Summit
- 2024 margin
- Lean D (+7.0) · D 53.0% · R 46.0%
- 2008→2024 swing
- -9.6pp toward R · 2008: 16.6pp · 2024: 7.0pp
- All cycles
- 2024: D+7.0 2020: D+9.6 2016: D+8.2 2012: D+14.8 2008: D+16.6
Not yet ingested
- Civics
- —
Market trends
- HPI YoY
- ▼ -112.75%
- Current HPI
- 198.7729
- Rent YoY
- —
- Metro
- —
- State GDP YoY
- ▲ 1.98%
- F500 in state
- 48
Industry mix (Fortune 500 HQ in OH)
| Industry | F500 HQs | Revenue |
|---|---|---|
| Insurance | 3 | $145B |
|
||
| Industrial Machinery | 3 | $49B |
|
||
| Financial Services | 3 | $24B |
|
||
| Consumer Goods | 2 | $93B |
|
||
| Aerospace / Defense | 2 | $47B |
|
||
| Utilities | 2 | $33B |
|
||
Price history
-48.9% since first listed4 events — show timeline
- 2026-05-29 Pending — MLSNOW
- 2026-05-14 Listed $450,000 MLSNOW
- 2020-10-08 Listed $335,000 MLSNOW
- 1997-10-28 Sold (Public Records) $880,000 Public Records
Property tax history
+2.7%/yrLatest (2025): $6,350 · +13.2% YoY. Source: county tax records.
Cash-flow waterfall
monthlySold comps — $/sqft
last 12 mo · ≤1 miLoading sold comps…