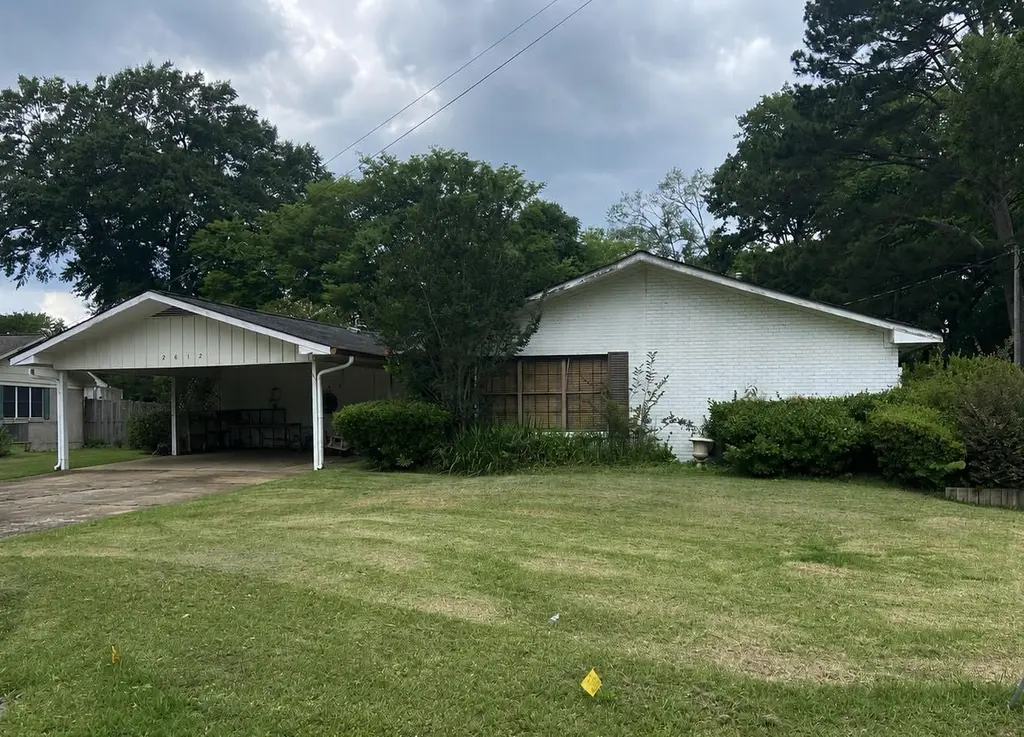
2612 Ewell Ave · Tupelo, MS
Flood risk 1/10 · Minimal
- FEMA flood zone
- X (unshaded)
- Chance of flooding over 30 yrs
- 0.0%
- Est. flood insurance / yr
- $507 – $1,088
Fire risk 1/10 · Minimal
- Est. fire insurance / yr
- $1,241 – $2,305
Heat risk 6/10 · Moderate
- Hot days now (above 108°F)
- 7 days/yr
- Hot days in 30 yrs
- 21 days/yr
Wind risk 6/10 · Moderate
- Chance of severe wind over 30 yrs
- 27.0%
Air-quality risk 1/10 · Minimal
- Unhealthy air days now
- 0 days/yr
- Unhealthy air days in 30 yrs
- 0 days/yr
Risk factors via First Street. Map © Google.
Why this score? — see what drove the C+ grade
The composite is a weighted blend of 9 inputs, each scored 0–100. Each bar is that input's sub-score; the figure is the points it added to the 100-point composite (weight × sub-score).
- Cash flow +21.5/30.0
- ARV discount +15.0/15.0
- DSCR +6.8/10.0
- 1% rule +4.7/10.0
- Rent growth +4.3/5.0
- Schools +3.7/10.0
- Livability +3.6/5.0
- Condition / age +2.5/5.0
- Appreciation +0.0/10.0
$149,900
🖨 Deal sheet 📄 Offer letter ✓ Due diligence
Listing remarks
Conveniently located just minutes from town and close to shopping, dining, schools, and other local amenities. This home offers plenty of potential for the right buyer. Featuring two master suites, the layout provides flexibility for multi-generational living, guests, or rental potential. This fixer-upper presents an excellent opportunity for investors or buyers looking to add their own personal touch. With some updates and improvements, this property could truly shine. Property is being sold AS-IS. Seller will make no repairs.
Key facts
- 0.28 acre lot
- Built 1972
- Listed 3 days
Property features AI
Exterior
- Parking: Attached carport
- Home design: Single-family residence; Residential property
- Exterior features: Lot dimensions approximately 79.4 x 151.6
Interior
- Bathrooms: 3 full bathrooms
- Interior features: Total of 8 rooms
Neighborhood map
What this means for you Summary
Snapshot
- This is a 3-bed/1.0-bath single-family listed at $150k.
Deal economics
- At list price, monthly cash flow is $224 ($3k/yr) — positive.
- The deal already cash-flows at list — no discount required.
- To meet the 1% rule (rent ≥ 1% of price), the offer needs to be $146k (2.6% below list).
- Recommended offer: $146k (2.6% below list) — sets the bar for 1% rule.
Location & tenants
- Location reads 72/100 on livability (#26 in MS) — a middle-class / working-renter tenant base. Strengths: cost of living A+, housing A+, health & safety A-; Watch: schools C-, amenities D+, employment D+.
- Tupelo Public School District (town): math 46% / reading 42% proficiency, ranked #28 of 130 in MS (top 22%) — families likely to look elsewhere, expect single-tenant / working-renter base with shorter leases.
- Market conditions: Rents rising fast (+7.3%/yr); 235 active listings in the ZIP; 154 units permitted in Lee County in 2024 (24 in 5+ unit buildings).
Forward outlook
- Local home prices are declining (-3.0%/yr); year-one equity from $1k of loan paydown is wiped out by about $4k of value loss. Plan a longer hold.
- Lee County population projected at +6% by 2050 — modest demand growth; plan on rents tracking national, not racing it.
- At projected returns (-3.0% appreciation + 7.3% rent growth), your $42k cash investment doubles in ~9 years — after that, you're playing with house money.
Negotiation context
- Only 3 days on market — expect competitive offers; lowballing is unlikely to land.
- Current owner paid $130k; 15% above their basis — modest negotiation headroom, anchor on the comps not their cost.
Risks & watch-outs
- Climate carrying-cost: major wind risk, 27% chance of damaging wind over 30y; extreme-heat days projected 7→21/yr by 2055 (HVAC capex compounding) — expect insurance premiums to compound above CPI over the hold.
Questions for the listing agent
- Built in 1972 — when were the roof, HVAC, electrical panel, plumbing, and water heater last replaced?
- Is there a deadline driving the sale (1031 exchange, divorce, estate, relocation)? That informs how much negotiation room exists.
- Crime grade is F in this area — have there been break-ins, vandalism, or insurance claims at this property in the last 3 years? What carrier currently insures it and at what premium?
- What's the average days-on-market for RENTAL listings here right now (not sales)? A rising rental-DOM trend means longer vacancies and softer asking-rent achievability than the comps imply.
- What's the recent tenant-quality profile in this submarket — average credit score on applications, eviction rate, late-payment / NSF rate, and stable-employment percentage? A property-management company in the area should have these aggregated.
- How much new for-sale + rental construction is in the pipeline within 1–3 miles? Heavy new supply typically softens prices + rents 12–24 months out; constrained supply supports both.
Investment metrics
- 1% rule
- 0.97% ✗
- Cap rate
- 8.08%
- Cash-on-cash
- 6.39%
- DSCR
- 1.28
- GRM
- 8.6
CMA / ARV
- ARV (on-the-fly)
- $223,300
- Comps found
- 12
Show comp detail 12 sales within ~0.75 mi
| Address | Dist | Beds/Ba | Sqft | Sold | Price | $/sf | Match |
|---|---|---|---|---|---|---|---|
| 608 Smokey Mtn | 0.27mi | 3/2.0 | 1,933 (+0%) | 21mo | $283,500 | $147 | 65 |
| 2504 Ewell | 0.20mi | 3/2.0 | 1,740 (-10%) | 12mo | $170,000 | $98 | 61 |
| 2404 Ewell Ave | 0.28mi | 3/2.0 | 1,793 (-7%) | 21mo | $216,000 | $120 | 54 |
| 2513 Hood Ave | 0.19mi | 3/3.0 | 2,120 (+10%) | 22mo | $204,000 | $96 | 48 |
| 2613 Bryan Dr | 0.47mi | 3/2.0 | 1,794 (-7%) | 18mo | $210,900 | $118 | 48 |
| 2515 Pemberton Ave | 0.32mi | 3/2.0 | 1,768 (-8%) | 24mo | $190,000 | $107 | 48 |
| 700 Smokey Mtn | 0.42mi | 4/2.0 (+1) | 2,000 (+4%) | 23mo | $204,000 | $102 | 46 |
| 2010 Winfield Dr | 0.64mi | 3/2.0 | 1,830 (-5%) | 22mo | $270,000 | $148 | 40 |
| 108 Vinewood Crk | 0.64mi | 3/2.0 | 2,066 (+7%) | 20mo | $239,900 | $116 | 38 |
| 313 Hillfield Cv | 0.62mi | 4/2.0 (+1) | 1,796 (-7%) | 23mo | $242,000 | $135 | 32 |
| 606 Meeks St | 0.60mi | 3/2.0 | 1,650 (-14%) | 21mo | $167,000 | $101 | 27 |
| 517 Augusta | 0.70mi | 4/2.0 (+1) | 1,754 (-9%) | 22mo | $62,000 | $35 | 25 |
Match score weights: distance 35% · size 25% · config 20% · recency 20%. Top-matched comps best support the ARV.
Projected returns pro-forma
-3.0% appreciation · 7.3% rent growth · sell at horizon
- IRR
- -2.1%
- Equity multiple
- 0.92×
- Total profit
- $-3,502
- Equity at exit
- $22,351
- IRR
- 11.5%
- Equity multiple
- 2.06×
- Total profit
- $44,664
- Equity at exit
- $12,961
Cash invested: $41,972 (down + closing). Projections, not guarantees.
Landlord ↔ Tenant lean methodology
- Overall (STATE)
- 90 Strongly Landlord-Friendly
- State Mississippi
- 90 Strongly Landlord-Friendly · R+11
- County
- — inherits STATE
- City
- — inherits STATE
ZIP-level market 38801
- Home prices YoY
- -20.7%
- Rents YoY
- 7.3%
- Active inventory
- 235
- Price-to-rent
- 8.6×
Monthly cashflow live
- Estimated rent
- $1,460 medium interval (Pro) →
- Mortgage (P&I)
- −$786
- Tax from tax record
- −$81 /mo · $973/yr
- Insurance
- −$62
- HOA
- −$0
- Vacancy / Maint / Mgmt
- −$307
- Net cashflow
- $224
Break-even live
UW: 25.0% down · 7.5% · 30yr · 1.5% tax · 5.0% vac · 8.0% maint · 8.0% mgmt
Financing live
Cash to close
- Down payment
- $37,475
- Closing costs
- $4,497
- Reserves months
- —
- Total cash needed
- —
Loan-product check · same deal, 3 products live
Conventional
25% down · 7.5% · 30yr
- Down + closing
- —
- Monthly P&I
- —
- Monthly cashflow
- —
- DSCR
- —
- Eligible?
- —
Personal DTI + credit; lowest rate.
DSCR
20% down · 8.5% · 30yr
- Down + closing
- —
- Monthly P&I
- —
- Monthly cashflow
- —
- DSCR
- —
- Eligible?
- —
No personal income docs; deal must DSCR.
Hard money
10% down · 12.0% · 12mo
- Down + closing
- —
- Monthly P&I
- —
- Monthly cashflow
- —
- DSCR
- —
- Eligible?
- —
Short-term bridge; refi at stabilization.
Listing history 4 events
-
2026-06-07statusdays on market $149,900 Pending 3 DOM
-
2026-06-05days on market $149,900 Active 2 DOM
-
2026-06-03remarks 533-char remark
-
2026-06-03$149,900 Active 1 DOM
ⓘ Source: listings_history table (triggers on properties + properties_extension) + one-shot
backfill from property_details.listing_events for pre-trigger history.
Tax reassessment forecast MS · Resets to sale price
- Current annual tax
- $973 · $81/mo
- Projected year-2 tax
- $1,184 · $99/mo
- Expected delta
- +$212/yr (+$18/mo · 21.8%)
ⓘ Screening estimate from a state-policy table — verify with the county assessor before closing.
Climate risk First Street
- Flood 1/10 Low FEMA zone X (unshaded) · 0% chance over 30 yrs
- Wildfire 1/10 Low
- Heat 6/10 Major 7 d/yr ≥108°F today · 21 d/yr by 30 yrs out
- Wind 6/10 Major 27% chance of damaging wind over 30 yrs
- Air quality 1/10 Low 0 unhealthy d/yr today · 0 by 30 yrs out
Nearby sold comps map
Loading sold comps map…
Walkable amenities ~0.75 mi
Loading nearby amenities…
Taxation est. · year 1
- Rental income
- $17,517
- − Mortgage interest
- −$8,397
- − Property taxes
- −$973
- − Insurance
- −$750
- − Repairs & maintenance
- −$1,401
- − Management
- −$1,401
- − Depreciation
- −$4,361
- Taxable income
- $235
- Est. tax owed @ 24.0%
- −$56
- After-tax cash flow
- $2,627/yr
For passive investors: Depreciation is non-cash, so a rental often shows a tax loss while cash-flowing — sheltering income. Rental losses are passive: they offset passive income freely, and up to $25,000/yr can offset ordinary (W-2) income if you actively participate and your MAGI is under $100k (phasing out to $0 by $150k); unused losses carry forward. On sale, claimed depreciation is recaptured at up to 25%, and gains may owe capital-gains tax (a 1031 exchange can defer both). Figures are a year-1 estimate at your 24.0% rate — not tax advice; consult a CPA.
Schools (NCES district)
- District
- Tupelo Public School District
- NCES district ID
- 2804320
- Math proficiency
- 46% ▼ -13.00%
- Reading proficiency
- 42% ▼ -7.00%
- Median HH income
- $44,002
- Composite
- 37.26/100
- National rank
- #4456
- State rank
- #28 of 130 in MS
Livability — Tupelo
- Score
- 72/100
- State rank
- #26
- US rank
- #6369
Category grades
Schools grade is shown separately in the Schools card above.
Census & demographics
- Census place
- Tupelo, MS
- County
- Lee County · 52,445 people
- City population
- 46,551
- Metro
- Tupelo, MS
- Population (ZIP)
- 29,858
- Household income
- $62,946
- Rent vs Own
- Severe rent burden
- 890.0
Population outlook (Lee County) Hauer SSP2
- Today (2025)
- 90,253 people
- By 2030
- 92,125 · +2.1%
- By 2040
- 94,914 · +5.2%
- By 2050
- 95,841 · +6.2%
- By 2075
- 94,189 · +4.4%
- By 2100
- 83,736 · -7.2%
Race, ethnicity, and origin ACS 2023
- Neighborhood character
- Diverse neighborhood (Simpson 0.59)
- Race & ethnicity
- Black 45% White 44% Hispanic / Latino 6% Two or more races 4% Asian 1%
- Hispanic origin (detail)
- Mexican 5%
- Common ancestry
- Slovak 1% Italian 1% Serbian 1%
- Foreign-born
- 4% · Canada
- Languages at home
- 93% English-only · Spanish 5%
Political lean MEDSL · Lee
- 2024 margin
- Solid R (+38.8) · D 30.0% · R 68.9% · Other 1.1%
- 2008→2024 swing
- -8.3pp toward R · 2008: -30.5pp · 2024: -38.8pp
- All cycles
- 2024: R+38.8 2020: R+32.5 2016: R+37.7 2012: R+29.0 2008: R+30.5
Not yet ingested
- Civics
- —
Market trends
- HPI YoY
- ▼ -45.12%
- Current HPI
- 173.1355
- Rent YoY
- ▲ 7.30%
- Metro
- Tupelo, MS
- State GDP YoY
- —
- F500 in state
- 0
Price history
+27.0% since first listed6 events — show timeline
- 2026-06-02 Listed $149,900 NEMSBD
- 2021-12-28 Sold (Public Records) $130,000 Public Records
- 2019-08-27 Sold (Public Records) $130,000 Public Records
- 2014-07-30 Sold (Public Records) $130,000 Public Records
- 2009-06-30 Sold (Public Records) $130,000 Public Records
- 2007-12-28 Sold (Public Records) $118,000 Public Records
Property tax history
-8.4%/yrLatest (2025): $973 · +1.5% YoY. Source: county tax records.
Cash-flow waterfall
monthlySold comps — $/sqft
last 12 mo · ≤1 miLoading sold comps…