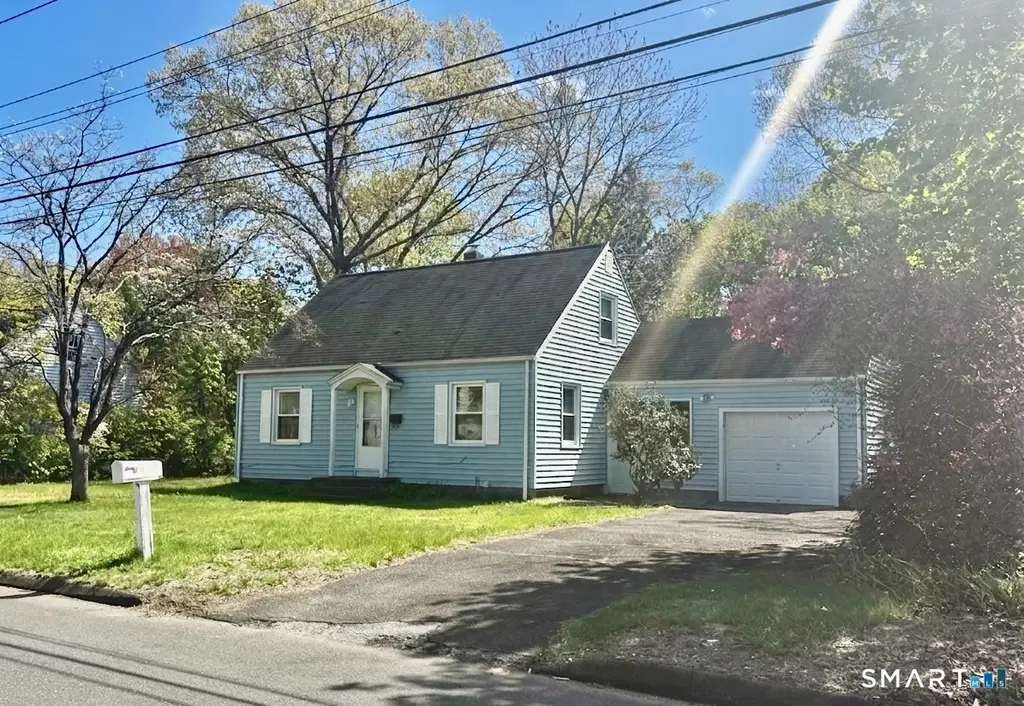
10 Monroe St · North Haven, CT
Flood risk No data
- FEMA flood zone
- —
- Chance of flooding over 30 yrs
- —
- Est. flood insurance / yr
- —
Fire risk No data
- Est. fire insurance / yr
- —
Heat risk No data
- Hot days now (above threshold)
- —
- Hot days in 30 yrs
- —
Wind risk No data
- Chance of severe wind over 30 yrs
- —
Air-quality risk No data
- Unhealthy air days now
- —
- Unhealthy air days in 30 yrs
- —
Risk factors via First Street. Map © Google.
Why this score? — see what drove the D grade
The composite is a weighted blend of 9 inputs, each scored 0–100. Each bar is that input's sub-score; the figure is the points it added to the 100-point composite (weight × sub-score).
- ARV discount +12.2/15.0
- Cash flow +10.4/30.0
- Schools +5.2/10.0
- Livability +3.9/5.0
- DSCR +3.0/10.0
- 1% rule +2.8/10.0
- Rent growth +2.5/5.0
- Condition / age +2.5/5.0
- Appreciation +0.0/10.0
$349,900
🖨 Deal sheet (PDF) 📄 Offer letter ✓ Due diligence
Listing remarks MLS
Cape cod style,3 brs,dr,lr,1 bth. Convenient location, close to shopping and park.To be sold in as is condition.
Key facts
- Rich hardwood floors
- Cape cod style home
- Sunroom
Tags
Property features AI
Exterior
- Parking: Attached garage (1-car)
- Utilities: Public water connected; Public sewer connected; Fuel tank located in basement
- Home design: Single-family home
- Construction: Frame and concrete construction; Concrete foundation
- Exterior features: Lightly wooded and open lot; Vinyl siding; Asphalt shingle roof; Blue exterior color
Interior
- Kitchen: Electric range; Refrigerator
- Bedrooms: Three bedrooms
- Bathrooms: One full bathroom
- Heating & cooling: Hot air heating fueled by oil; Electric hot water
- Interior features: Seven total rooms; Basement is full and partially finished; Central air conditioning
- Laundry & utility: Laundry in basement
Neighborhood map
What this means for you Summary
Snapshot
- This is a 3-bed/1.0-bath single-family listed at $350k.
Deal economics
- At list price, monthly cash flow is $-186 ($-2k/yr) — negative.
- To cash-flow at today's rent, offer at most $317k (9.4% below list).
- To meet the 1% rule (rent ≥ 1% of price), the offer needs to be $273k (21.8% below list).
- Recommended offer: $273k (21.8% below list) — sets the bar for 1% rule.
- Cap rate 5.7% vs local median 4.0% in North Haven — top-decile yield for the area; either an underpriced asset or a hidden risk that comps aren't pricing in. Stress-test before assuming the spread holds.
Location & tenants
- Location reads 78/100 on livability (#39 in CT, #2,723 nationally) — a middle-class / working-renter tenant base. Strengths: employment A+, housing A+, health & safety A+; Watch: amenities F, commute F, cost of living D-.
- North Haven School District (suburban): math 49% / reading 64% proficiency, ranked #55 of 153 in CT (top 36%) — acceptable for families but not a draw, mixed tenant base, ~2y average lease; only 8% free/reduced lunch — higher-income household profile.
- Zoned schools: Clintonville Elementary School (math 47% / reading 52%, grade D, #237 of 553 statewide, top 45%, 371 students, 19% FRL); North Haven Middle School (math 45% / reading 68%, grade B, #59 of 175 statewide, top 34%, 724 students, 22% FRL); North Haven High School (math 41% / reading 64%, grade C-, #79 of 194 statewide, top 40%, 921 students, 25% FRL).
- Market conditions: 78 active listings in the ZIP; 4 comparable units currently listed for rent nearby; rentals at typical pace (median 16d on market — plan ~3-4 weeks tenant-placement turnaround); 1,059 units permitted in South Central Connecticut Planning Region in 2024 (779 in 5+ unit buildings).
Forward outlook
- Local home prices are declining (-3.0%/yr); year-one equity from $2k of loan paydown is wiped out by about $10k of value loss. Plan a longer hold.
Negotiation context
- Only 14 days on market — expect competitive offers; lowballing is unlikely to land.
- 2 sale attempts since 12y ago with the ask held roughly flat each time — persistent listings suggest the price (not the market) is what's stuck; bring a comps-based counter.
- Current owner paid $115k; list at $350k implies a 204% gain — meaningful room to come down on a strong offer.
Risks & watch-outs
- Watch-outs: built in 1948 — expect roof / HVAC / electrical / plumbing capex.
Questions for the listing agent
- What do current leases actually rent for vs. the listed asking? Can we see a recent rent roll and the last 12 months of T-12 income?
- Built in 1948 — when were the roof, HVAC, electrical panel, plumbing, and water heater last replaced?
- Is there a deadline driving the sale (1031 exchange, divorce, estate, relocation)? That informs how much negotiation room exists.
- Schools are A-rated — typically a magnet for longer-tenancy family renters. What's the average tenant stay here, and is there a school-zone premium baked into asking?
- The area grade is low — what's the realistic commute time and amenity access for the typical tenant pool here? Any planned neighborhood developments (good or bad) we should know about?
- What's the average days-on-market for RENTAL listings here right now (not sales)? A rising rental-DOM trend means longer vacancies and softer asking-rent achievability than the comps imply.
- What's the recent tenant-quality profile in this submarket — average credit score on applications, eviction rate, late-payment / NSF rate, and stable-employment percentage? A property-management company in the area should have these aggregated.
- How much new for-sale + rental construction is in the pipeline within 1–3 miles? Heavy new supply typically softens prices + rents 12–24 months out; constrained supply supports both.
Investment metrics
- 1% rule
- 0.78% ✗
- Cap rate
- 5.66%
- Cash-on-cash
- -2.27%
- DSCR
- 0.90
- GRM
- 10.7
CMA / ARV
- ARV (median comp)
- $390,420
- List price
- $349,900
- Delta
- -10.38%
- Verdict
- UNDERPRICED
- Comps
- 20 within 1.0 mi
Show comp detail 8 sales within ~0.75 mi
| Address | Dist | Beds/Ba | Sqft | Sold | Price | $/sf | Match |
|---|---|---|---|---|---|---|---|
| 12 Lincoln St | 0.08mi | 3/1.0 | 1,008 (0%) | 19mo | $302,500 | $300 | 80 |
| 33 Postman Hwy | 0.66mi | 3/1.0 | 1,047 (+4%) | 8mo | $365,100 | $349 | 56 |
| 40 Woodland Ave | 0.56mi | 3/2.0 | 1,080 (+7%) | 5mo | $410,000 | $380 | 54 |
| 29 Lincoln St | 0.13mi | 4/2.0 (+1) | 1,137 (+13%) | 22mo | $395,000 | $347 | 46 |
| 6 Red Brick Ln | 0.65mi | 3/1.5 | 1,152 (+14%) | 0mo | $411,000 | $357 | 43 |
| 32 Grove Rd | 0.70mi | 3/1.0 | 1,056 (+5%) | 20mo | $290,000 | $275 | 43 |
| 54 Park Rd | 0.67mi | 2/1.0 (-1) | 950 (-6%) | 17mo | $310,000 | $326 | 40 |
| 43 Allen Rd | 0.75mi | 3/1.5 | 1,075 (+7%) | 17mo | $360,000 | $335 | 38 |
Match score weights: distance 35% · size 25% · config 20% · recency 20%. Top-matched comps best support the ARV.
Projected returns pro-forma
-3.0% appreciation · 3.0% rent growth · sell at horizon
- IRR
- -20.1%
- Equity multiple
- 0.30×
- Total profit
- $-68,520
- Equity at exit
- $52,171
- IRR
- -13.1%
- Equity multiple
- 0.24×
- Total profit
- $-74,896
- Equity at exit
- $30,253
Cash invested: $97,972 (down + closing). Projections, not guarantees.
Landlord ↔ Tenant lean methodology
- Overall (STATE)
- 27 Tenant-Leaning
- State Connecticut
- 27 Tenant-Leaning · D+7
- County
- — inherits STATE
- City
- — inherits STATE
ZIP-level market 06473
- Active inventory
- 78
- Price-to-rent
- 10.7×
Monthly cashflow live
- Estimated rent
- $2,735 medium interval (Pro) →
- Mortgage (P&I)
- −$1,835
- Tax from tax record
- −$366 /mo · $4,386/yr
- Insurance
- −$146
- HOA
- −$0
- Vacancy / Maint / Mgmt
- −$574
- Net cashflow
- $-186
Break-even live
Sensitivity live
| Price | -10% $13 | -5% $-87 | +0% $-186 | +5% $-285 | +10% $-384 |
|---|---|---|---|---|---|
| Rent | -10% $-402 | -5% $-294 | +0% $-186 | +5% $-78 | +10% $31 |
| Rate | -1.0pp $-9 | -0.5pp $-97 | base $-186 | +0.5pp $-276 | +1.0pp $-368 |
UW: 25.0% down · 7.5% · 30yr · 1.5% tax · 5.0% vac · 8.0% maint · 8.0% mgmt
Financing live
Cash to close
- Down payment
- $87,475
- Closing costs
- $10,497
- Reserves months
- —
- Total cash needed
- —
Loan-product check · same deal, 3 products live
Conventional
25% down · 7.5% · 30yr
- Down + closing
- —
- Monthly P&I
- —
- Monthly cashflow
- —
- DSCR
- —
- Eligible?
- —
Personal DTI + credit; lowest rate.
DSCR
20% down · 8.5% · 30yr
- Down + closing
- —
- Monthly P&I
- —
- Monthly cashflow
- —
- DSCR
- —
- Eligible?
- —
No personal income docs; deal must DSCR.
Hard money
10% down · 12.0% · 12mo
- Down + closing
- —
- Monthly P&I
- —
- Monthly cashflow
- —
- DSCR
- —
- Eligible?
- —
Short-term bridge; refi at stabilization.
Rent comps 4 comps
| Address | Beds | Baths | Sqft | Rent | $/sqft | DOM | Units | Dist |
|---|---|---|---|---|---|---|---|---|
| 86 Howe St Unit A North Haven, CT | 2.0 | 1.0 | 750 | $2,500 | $3.33 | 4d | 1 | 0.60mi |
| 23 Maiden Ln North Haven, CT | 2.0 | 1.5 | 879 | $2,662 | $3.03 | 4d | 6 | 0.62mi |
| 100 Avalon Haven Dr North Haven, CT | 1.0–3.0 | 1.0–2.0 | 1009 | $3,000 | $2.97 | 16d | 5 | 1.04mi |
| 1400 Hartford Tpke #10 North Haven, CT | 3.0 | 2.0 | 1295 | $2,990 | $2.31 | 45d | 1 | 1.45mi |
Listing history 5 events
-
2026-05-12$349,900 Active 991-char remark
-
2015-02-20soldstatus $115,000 112-char remark
Show marketing remark (112 chars)
Cape cod style,3 brs,dr,lr,1 bth. Convenient location, close to shopping and park.To be sold in as is condition.
-
2015-01-16historical 112-char remark
Show marketing remark (112 chars)
Cape cod style,3 brs,dr,lr,1 bth. Convenient location, close to shopping and park.To be sold in as is condition.
-
2014-05-25$115,000 112-char remark
Show marketing remark (112 chars)
Cape cod style,3 brs,dr,lr,1 bth. Convenient location, close to shopping and park.To be sold in as is condition.
-
1992-09-30soldstatus $125,000
ⓘ Source: listings_history table (triggers on properties + properties_extension) + one-shot
backfill from property_details.listing_events for pre-trigger history.
Tax reassessment forecast CT · Partial reset (capped growth)
- Current annual tax
- $4,386 · $366/mo
- Projected year-2 tax
- $5,937 · $495/mo
- Expected delta
- +$1,551/yr (+$129/mo · 35.4%)
ⓘ Screening estimate from a state-policy table — verify with the county assessor before closing.
Nearby sold comps map
Loading sold comps map…
Walkable amenities ~0.75 mi
Loading nearby amenities…
Taxation est. · year 1
- Rental income
- $32,820
- − Mortgage interest
- −$19,600
- − Property taxes
- −$4,386
- − Insurance
- −$1,750
- − Repairs & maintenance
- −$2,626
- − Management
- −$2,626
- − Depreciation
- −$10,179
- Taxable loss
- −$8,346
- Est. tax savings @ 24.0%
- +$2,003
- After-tax cash flow
- $-224/yr
For passive investors: Depreciation is non-cash, so a rental often shows a tax loss while cash-flowing — sheltering income. Rental losses are passive: they offset passive income freely, and up to $25,000/yr can offset ordinary (W-2) income if you actively participate and your MAGI is under $100k (phasing out to $0 by $150k); unused losses carry forward. On sale, claimed depreciation is recaptured at up to 25%, and gains may owe capital-gains tax (a 1031 exchange can defer both). Figures are a year-1 estimate at your 24.0% rate — not tax advice; consult a CPA.
Schools (NCES district)
- District
- North Haven School District
- NCES district ID
- 0903030
- Math proficiency
- 49% ▼ -12.00%
- Reading proficiency
- 64% ▼ -8.00%
- Median HH income
- $85,727
- Composite
- 51.53/100
- National rank
- #1714
- State rank
- #55 of 153 in CT
Livability — North Haven
- Score
- 78/100
- State rank
- #39
- US rank
- #2723
Category grades
Schools grade is shown separately in the Schools card above.
Census & demographics
- Census place
- North Haven, CT
- City population
- 24,527
- Population (ZIP)
- 24,527
Population outlook (South Central Connecticut County) Hauer SSP2
- By 2040
- 608,362
Race, ethnicity, and origin ACS 2023
- Neighborhood character
- Predominantly White (79%)
- Race & ethnicity
- White 79% Hispanic / Latino 7% Asian 7% Two or more races 6% Black 4%
- Hispanic origin (detail)
- Mexican 1% Puerto Rican 4%
- Common ancestry
- Romanian 7% Lithuanian 2% Scotch-Irish 1%
- Foreign-born
- 11% · China, South Korea, Canada
- Languages at home
- 86% English-only · Other Indo-European 4% Spanish 3% Chinese 2%
Political lean MEDSL · South Central Connecticut
- 2024 margin
- Strong D (+20.1) · D 59.0% · R 38.9% · Other 2.1%
- All cycles
- 2024: D+20.1
Not yet ingested
- Civics
- —
Market trends
- HPI YoY
- ▼ -294.57%
- Current HPI
- 168.0717
- Rent YoY
- —
- Metro
- —
- State GDP YoY
- ▲ 1.06%
- F500 in state
- 38
Industry mix (Fortune 500 HQ in CT)
| Industry | F500 HQs | Revenue |
|---|---|---|
| Industrial Machinery | 4 | $38B |
|
||
| Insurance | 3 | $71B |
|
||
| Financial Services | 2 | $25B |
|
||
| Transportation / Logistics | 2 | $18B |
|
||
| Healthcare | 1 | $247B |
|
||
| Telecommunications | 1 | $55B |
|
||
Price history
+179.9% since first listed6 events — show timeline
- 2026-05-27 Pending — Smart MLS
- 2026-05-12 Listed $349,900 Smart MLS
- 2015-02-20 Sold (MLS) $115,000 Smart MLS
- 2015-01-16 Listing Removed — Smart MLS
- 2014-05-25 Listed $115,000 Smart MLS
- 1992-09-30 Sold (Public Records) $125,000 Public Records
Property tax history
-0.1%/yrLatest (2023): $4,386 · +6.3% YoY. Source: county tax records.
Cash-flow waterfall
monthlySold comps — $/sqft
last 12 mo · ≤1 miLoading sold comps…