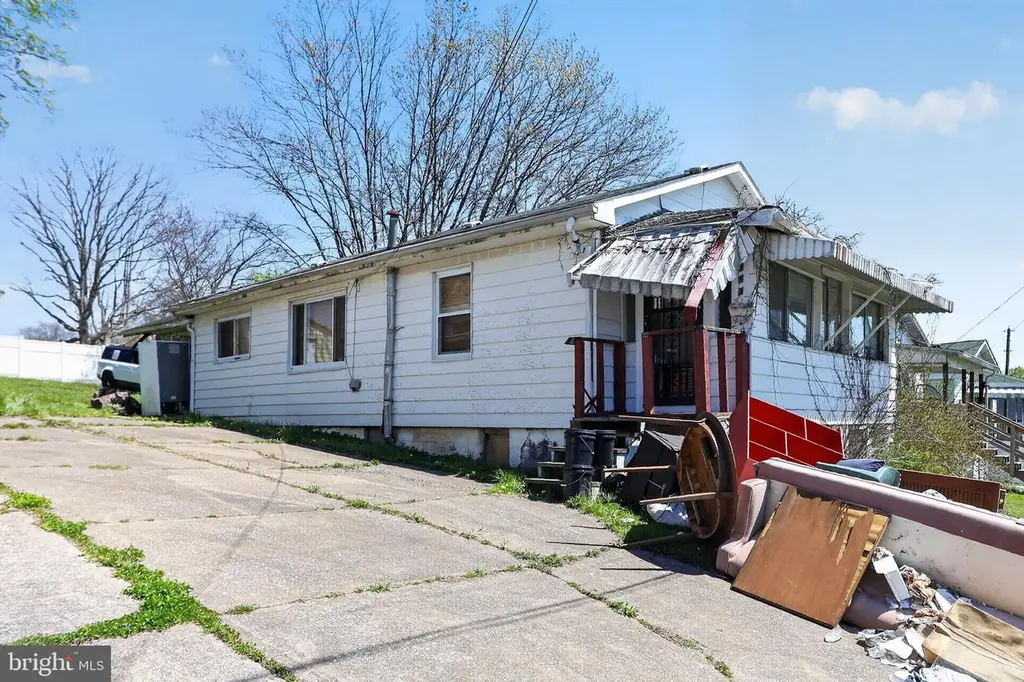
113 Cannaday St · Beckley, WV
Flood risk 1/10 · Minimal
- FEMA flood zone
- X (unshaded)
- Chance of flooding over 30 yrs
- 0.0%
- Est. flood insurance / yr
- $473 – $860
Fire risk 2/10 · Minimal
- Est. fire insurance / yr
- $787 – $1,461
Heat risk 3/10 · Minor
- Hot days now (above 91°F)
- 7 days/yr
- Hot days in 30 yrs
- 21 days/yr
Wind risk 1/10 · Minimal
- Chance of severe wind over 30 yrs
- —
Air-quality risk 1/10 · Minimal
- Unhealthy air days now
- 0 days/yr
- Unhealthy air days in 30 yrs
- 0 days/yr
Risk factors via First Street. Map © Google.
Why this score? — see what drove the D grade
The composite is a weighted blend of 9 inputs, each scored 0–100. Each bar is that input's sub-score; the figure is the points it added to the 100-point composite (weight × sub-score).
- Cash flow +15.0/30.0
- ARV discount +7.5/15.0
- 1% rule +5.0/10.0
- DSCR +5.0/10.0
- Rent growth +3.6/5.0
- Schools +3.0/10.0
- Livability +3.0/5.0
- Condition / age +2.5/5.0
- Appreciation +0.0/10.0
$29,000
🖨 Deal sheet (PDF) 📄 Offer letter ✓ Due diligence
Listing remarks
Opportunity knocks with this 3-bedroom, 1-bath home offering a solid footprint and strong upside potential for the right buyer. Situated on a sloped lot with off-street parking and a large yard, this property is ready for a full renovation and transformation. The home features a single-level layout with additional lower-level space, enclosed front porch, and a functional floor plan that could be reimagined for modern living. Interior spaces have already been taken down to a near-clean slate in areas, making it easier to begin your renovation vision. Exterior offers a driveway, yard space, and elevated positioning with neighborhood views. Conveniently located near downtown Beckley, shopping,
Key facts
- Lower-level space
- Driveway
- Large yard
Tags
Property features AI
Finance
- Other: Fee simple ownership; Year built estimated
Exterior
- Parking: Driveway; Off-street parking
- Utilities: Public water; Public sewer; Electric service
- Home design: Detached structure; Above-grade living space (estimated finished area)
- Construction: Aluminum siding; Block foundation; Above grade other structures
- Exterior features: No tidal water; Level entry with slope less than 1'; Two or more access exits
Interior
- Bedrooms: 3 bedrooms on main level
- Bathrooms: 1 full bathroom on main level; 1 full bathroom total
- Heating & cooling: Central heating (electric); Central air conditioning (electric); Electric hot water
- Interior features: Partial basement; Estimated living area
Neighborhood map
What this means for you Summary
Snapshot
- This is a 3-bed/1.0-bath single-family listed at $29k.
Deal economics
- At list price, monthly cash flow is $818 ($10k/yr) — positive.
- The deal already cash-flows at list — no discount required.
- Meets the 1% rule at list price ($1k rent vs $29k).
- Recommended offer: $28k (3.0% below list) — sets the bar for market timing.
- Cap rate 40.1% vs local median 7.0% in Beckley — top-decile yield for the area; either an underpriced asset or a hidden risk that comps aren't pricing in. Stress-test before assuming the spread holds.
Location & tenants
- Location reads 59/100 on livability (#235 in WV) — a working-class tenant base; expect higher turnover. Strengths: cost of living A+, housing A-; Watch: employment D, schools D-, crime F.
- Raleigh County Schools (rural): math 29% / reading 42% proficiency, ranked #14 of 55 in WV (top 26%) — families likely to look elsewhere, expect single-tenant / working-renter base with shorter leases.
- Market conditions: Rents rising fast (+4.2%/yr); 112 active listings in the ZIP; 41 units permitted in Raleigh County in 2024 (0 in 5+ unit buildings).
Forward outlook
- Local home prices are declining (-3.0%/yr); year-one equity from $200 of loan paydown is wiped out by about $870 of value loss. Plan a longer hold.
- Raleigh County population projected at -16% by 2050 — secular population decline; favor cash flow + early exit over multi-decade hold.
- At projected returns (-3.0% appreciation + 4.2% rent growth), your $8k cash investment doubles in ~1 year — after that, you're playing with house money.
Negotiation context
- It's been on market 49 days — a 3% lower offer ($28k) is reasonable based on typical stale-listing flexibility.
Risks & watch-outs
- Watch-outs: built in 1940 — expect roof / HVAC / electrical / plumbing capex.
Questions for the listing agent
- It's been on market 49 days. Have you received any prior offers? Is the seller open to a 3% concession, seller financing, or rate buy-down credit?
- Built in 1940 — when were the roof, HVAC, electrical panel, plumbing, and water heater last replaced?
- Is there a deadline driving the sale (1031 exchange, divorce, estate, relocation)? That informs how much negotiation room exists.
- Schools are D-rated, which usually means shorter tenancies and higher turnover. Who's the typical renter profile here, and what's been the actual vacancy rate?
- Crime grade is F in this area — have there been break-ins, vandalism, or insurance claims at this property in the last 3 years? What carrier currently insures it and at what premium?
- The area grade is low — what's the realistic commute time and amenity access for the typical tenant pool here? Any planned neighborhood developments (good or bad) we should know about?
- What's the average days-on-market for RENTAL listings here right now (not sales)? A rising rental-DOM trend means longer vacancies and softer asking-rent achievability than the comps imply.
- What's the recent tenant-quality profile in this submarket — average credit score on applications, eviction rate, late-payment / NSF rate, and stable-employment percentage? A property-management company in the area should have these aggregated.
- How much new for-sale + rental construction is in the pipeline within 1–3 miles? Heavy new supply typically softens prices + rents 12–24 months out; constrained supply supports both.
Investment metrics
- 1% rule
- 4.38% ✓
- Cap rate
- 40.12%
- Cash-on-cash
- 120.81%
- DSCR
- 6.38
- GRM
- 1.9
CMA / ARV
- ARV (on-the-fly)
- $107,640
- Comps found
- 12
Show comp detail 12 sales within ~0.75 mi
| Address | Dist | Beds/Ba | Sqft | Sold | Price | $/sf | Match |
|---|---|---|---|---|---|---|---|
| 716 F St | 0.23mi | 3/1.0 | 916 (-2%) | 14mo | $93,000 | $102 | 74 |
| 112 Cannaday St | 0.02mi | 3/1.0 | 1,025 (+10%) | 12mo | $15,000 | $15 | 73 |
| 112 Deegans St | 0.10mi | 3/1.5 | 1,000 (+7%) | 13mo | $114,999 | $115 | 71 |
| 212 Maplewood Ln | 0.31mi | 3/1.0 | 992 (+6%) | 17mo | $115,000 | $116 | 61 |
| 208 E St | 0.25mi | 2/1.0 (-1) | 819 (-12%) | 7mo | $50,000 | $61 | 57 |
| 203 Stanley St | 0.51mi | 2/1.0 (-1) | 892 (-5%) | 14mo | $79,500 | $89 | 52 |
| 219 South Vance St | 0.66mi | 2/1.0 (-1) | 910 (-3%) | 10mo | $124,900 | $137 | 51 |
| 222 Clyde St | 0.73mi | 3/1.0 | 882 (-6%) | 11mo | $56,000 | $63 | 47 |
| 207 E C St | 0.49mi | 2/1.0 (-1) | 1,074 (+15%) | 3mo | $118,000 | $110 | 45 |
| 110 Lancaster St | 0.47mi | 2/1.0 (-1) | 840 (-10%) | 15mo | $143,000 | $170 | 44 |
| 106 Hager St | 0.60mi | 2/1.0 (-1) | 816 (-13%) | 12mo | $99,000 | $121 | 36 |
| 205 Kentucky Ave | 0.66mi | 3/2.5 | 1,075 (+15%) | 5mo | $145,000 | $135 | 35 |
Match score weights: distance 35% · size 25% · config 20% · recency 20%. Top-matched comps best support the ARV.
Projected returns pro-forma
-3.0% appreciation · 4.25% rent growth · sell at horizon
- IRR
- —
- Equity multiple
- 7.03×
- Total profit
- $48,994
- Equity at exit
- $4,324
- IRR
- —
- Equity multiple
- 15.35×
- Total profit
- $116,552
- Equity at exit
- $2,507
Cash invested: $8,120 (down + closing). Projections, not guarantees.
Landlord ↔ Tenant lean methodology
- Overall (STATE)
- 83 Strongly Landlord-Friendly
- State West Virginia
- 83 Strongly Landlord-Friendly · R+22
- County
- — inherits STATE
- City
- — inherits STATE
ZIP-level market 25801
- Home prices YoY
- -17.8%
- Rents YoY
- 4.2%
- Active inventory
- 112
- Price-to-rent
- 1.9×
Monthly cashflow live
- Estimated rent
- $1,269 medium interval (Pro) →
- Mortgage (P&I)
- −$152
- Tax from tax record
- −$21 /mo · $254/yr
- Insurance
- −$12
- HOA
- −$0
- Vacancy / Maint / Mgmt
- −$267
- Net cashflow
- $818
Break-even live
Sensitivity live
| Price | -10% $834 | -5% $826 | +0% $818 | +5% $809 | +10% $801 |
|---|---|---|---|---|---|
| Rent | -10% $717 | -5% $767 | +0% $818 | +5% $868 | +10% $918 |
| Rate | -1.0pp $832 | -0.5pp $825 | base $818 | +0.5pp $810 | +1.0pp $802 |
UW: 25.0% down · 7.5% · 30yr · 1.5% tax · 5.0% vac · 8.0% maint · 8.0% mgmt
Financing live
Cash to close
- Down payment
- $7,250
- Closing costs
- $870
- Reserves months
- —
- Total cash needed
- —
Loan-product check · same deal, 3 products live
Conventional
25% down · 7.5% · 30yr
- Down + closing
- —
- Monthly P&I
- —
- Monthly cashflow
- —
- DSCR
- —
- Eligible?
- —
Personal DTI + credit; lowest rate.
DSCR
20% down · 8.5% · 30yr
- Down + closing
- —
- Monthly P&I
- —
- Monthly cashflow
- —
- DSCR
- —
- Eligible?
- —
No personal income docs; deal must DSCR.
Hard money
10% down · 12.0% · 12mo
- Down + closing
- —
- Monthly P&I
- —
- Monthly cashflow
- —
- DSCR
- —
- Eligible?
- —
Short-term bridge; refi at stabilization.
Listing history 17 events
-
2026-06-19days on market $29,000 Active 49 DOM
-
2026-06-18days on market $29,000 Active 48 DOM
-
2026-06-17price $29,000 Active 47 DOM
-
2026-06-17days on market $35,000 Active 47 DOM
-
2026-06-16days on market $35,000 Active 46 DOM
-
2026-06-15days on market $35,000 Active 45 DOM
-
2026-06-14days on market $35,000 Active 43 DOM
-
2026-06-12days on market $35,000 Active 42 DOM
-
2026-06-09days on market $35,000 Active 39 DOM
-
2026-06-08days on market $35,000 Active 38 DOM
-
2026-06-07pricedays on market $35,000 Active 37 DOM
-
2026-06-03days on market $50,000 Active 33 DOM
-
2026-06-02days on market $50,000 Active 32 DOM
-
2026-06-01days on market $50,000 Active 31 DOM
-
2026-05-31days on market $50,000 Active 30 DOM
-
2026-05-30days on market $50,000 Active 29 DOM
-
2026-05-01$50,000 Active
ⓘ Source: listings_history table (triggers on properties + properties_extension) + one-shot
backfill from property_details.listing_events for pre-trigger history.
Tax reassessment forecast WV · Resets to sale price
- Current annual tax
- $254 · $21/mo
- Projected year-2 tax
- $254 · $21/mo
- Expected delta
- $0/yr ($0/mo · -0.0%)
ⓘ Screening estimate from a state-policy table — verify with the county assessor before closing.
Climate risk First Street
- Flood 1/10 Low FEMA zone X (unshaded) · 0% chance over 30 yrs
- Wildfire 2/10 Low
- Heat 3/10 Moderate 7 d/yr ≥91°F today · 21 d/yr by 30 yrs out
- Wind 1/10 Low
- Air quality 1/10 Low 0 unhealthy d/yr today · 0 by 30 yrs out
Nearby sold comps map
Loading sold comps map…
Walkable amenities ~0.75 mi
Loading nearby amenities…
Taxation est. · year 1
- Rental income
- $15,233
- − Mortgage interest
- −$1,624
- − Property taxes
- −$254
- − Insurance
- −$145
- − Repairs & maintenance
- −$1,219
- − Management
- −$1,219
- − Depreciation
- −$844
- Taxable income
- $9,929
- Est. tax owed @ 24.0%
- −$2,383
- After-tax cash flow
- $7,427/yr
For passive investors: Depreciation is non-cash, so a rental often shows a tax loss while cash-flowing — sheltering income. Rental losses are passive: they offset passive income freely, and up to $25,000/yr can offset ordinary (W-2) income if you actively participate and your MAGI is under $100k (phasing out to $0 by $150k); unused losses carry forward. On sale, claimed depreciation is recaptured at up to 25%, and gains may owe capital-gains tax (a 1031 exchange can defer both). Figures are a year-1 estimate at your 24.0% rate — not tax advice; consult a CPA.
Schools (NCES district)
- District
- Raleigh County Schools
- NCES district ID
- 5401230
- Math proficiency
- 29% ▼ -8.00%
- Reading proficiency
- 42% ▼ -3.00%
- Median HH income
- $39,828
- Composite
- 29.74/100
- National rank
- #6445
- State rank
- #14 of 55 in WV
Livability — Beckley
- Score
- 59/100
- State rank
- #235
- US rank
- #20551
Category grades
Schools grade is shown separately in the Schools card above.
Census & demographics
- Census place
- Beckley, WV
- County
- Raleigh County · 31,128 people
- City population
- 31,128
- Metro
- Beckley, WV
- Population (ZIP)
- 31,128
- Household income
- $56,836
- Rent vs Own
- Severe rent burden
- 1384.0
Population outlook (Raleigh County) Hauer SSP2
- Today (2025)
- 73,505 people
- By 2030
- 70,954 · -3.5%
- By 2040
- 66,038 · -10.2%
- By 2050
- 61,919 · -15.8%
- By 2075
- 51,954 · -29.3%
- By 2100
- 39,724 · -46.0%
Race, ethnicity, and origin ACS 2023
- Neighborhood character
- Predominantly White (81%)
- Race & ethnicity
- White 81% Black 10% Two or more races 7% Hispanic / Latino 2% Asian 2%
- Common ancestry
- Slovak 2% Italian 1% Lithuanian 1%
- Foreign-born
- 2% · Canada
- Languages at home
- 96% English-only · Spanish 2% Other Indo-European 1%
Political lean MEDSL · Raleigh
- 2024 margin
- Solid R (+54.3) · D 22.0% · R 76.3% · Other 1.6%
- 2008→2024 swing
- -28.5pp toward R · 2008: -25.9pp · 2024: -54.3pp
- All cycles
- 2024: R+54.3 2020: R+50.4 2016: R+52.8 2012: R+44.6 2008: R+25.9
Not yet ingested
- Civics
- —
Market trends
- HPI YoY
- ▼ -45.60%
- Current HPI
- 210.0114
- Rent YoY
- ▲ 4.25%
- Metro
- Beckley, WV
- State GDP YoY
- —
- F500 in state
- 0
Price history
1 event — show timeline
- 2026-05-01 Listed $50,000 BRIGHT MLS
Property tax history
-0.7%/yrLatest (2025): $254 · +13.5% YoY. Source: county tax records.
Cash-flow waterfall
monthlySold comps — $/sqft
last 12 mo · ≤1 miLoading sold comps…