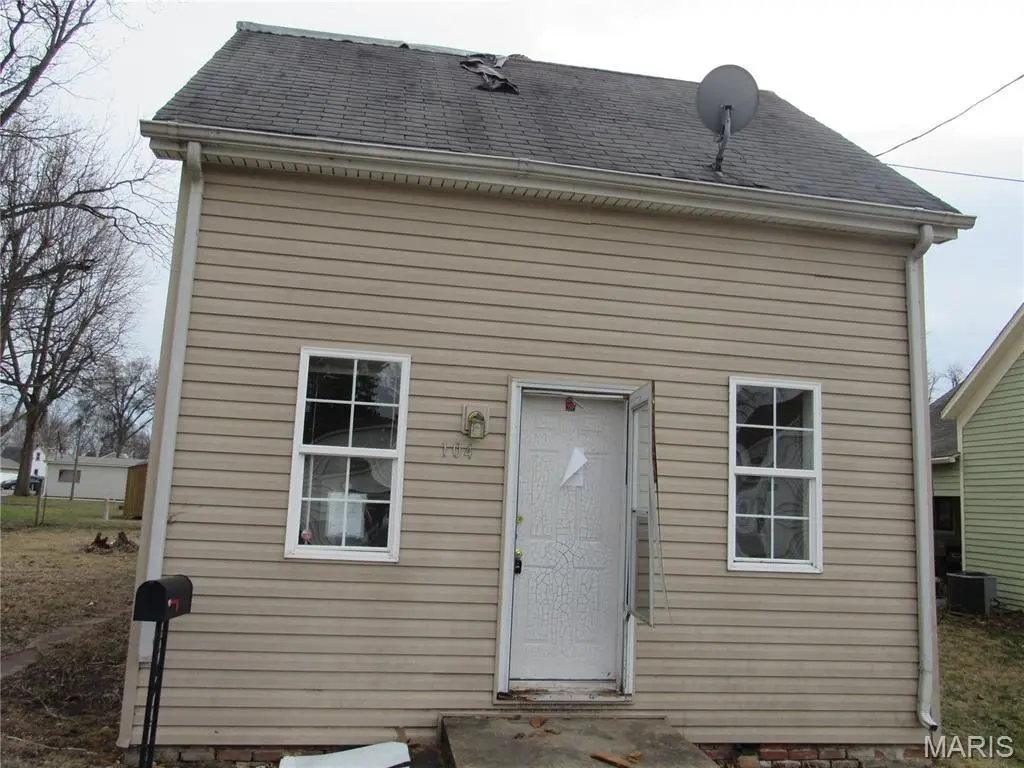
104 E South St · Mascoutah, IL
Flood risk 3/10 · Minor
- FEMA flood zone
- X
- Chance of flooding over 30 yrs
- 0.2%
- Est. flood insurance / yr
- $507 – $1,088
Fire risk 1/10 · Minimal
- Est. fire insurance / yr
- $804 – $1,492
Heat risk 5/10 · Moderate
- Hot days now (above 106°F)
- 7 days/yr
- Hot days in 30 yrs
- 21 days/yr
Wind risk 2/10 · Minimal
- Chance of severe wind over 30 yrs
- 1.0%
Air-quality risk 2/10 · Minimal
- Unhealthy air days now
- 0 days/yr
- Unhealthy air days in 30 yrs
- 1 days/yr
Risk factors via First Street. Map © Google.
Why this score? — see what drove the B- grade
The composite is a weighted blend of 9 inputs, each scored 0–100. Each bar is that input's sub-score; the figure is the points it added to the 100-point composite (weight × sub-score).
- Cash flow +30.0/30.0
- 1% rule +10.0/10.0
- DSCR +10.0/10.0
- ARV discount +7.5/15.0
- Schools +4.1/10.0
- Livability +3.4/5.0
- Rent growth +2.5/5.0
- Condition / age +2.5/5.0
- Appreciation +0.0/10.0
$49,700
🖨 Deal sheet (PDF) 📄 Offer letter ✓ Due diligence
Listing remarks MLS
1 bed, 1 bath home with plenty of potential. Perfect project for someone ready to renovate and make it their own. Would be a great investment property.
Key facts
- 5,227 sq ft lot
- 2 parking spots
- Built 1887
Neighborhood map
What this means for you Summary
Snapshot
- This is a 1-bed/2.0-bath single-family listed at $50k.
Deal economics
- At list price, monthly cash flow is $382 ($5k/yr) — positive.
- The deal already cash-flows at list — no discount required.
- Meets the 1% rule at list price ($1k rent vs $50k).
- Recommended offer: $45k (9.0% below list) — sets the bar for market timing.
- Cap rate 15.5% vs local median 3.0% in Mascoutah — top-decile yield for the area; either an underpriced asset or a hidden risk that comps aren't pricing in. Stress-test before assuming the spread holds.
Location & tenants
- Location reads 68/100 on livability (#471 in IL) — a middle-class / working-renter tenant base. Strengths: crime A+, cost of living A+, housing A+; Watch: amenities F, health & safety F.
- Mascoutah CUD 19 (town): math 42% / reading 48% proficiency, ranked #80 of 620 in IL (top 13%) — families likely to look elsewhere, expect single-tenant / working-renter base with shorter leases; only 16% free/reduced lunch — higher-income household profile.
- Market conditions: 58 active listings in the ZIP; solid renter incomes; 783 units permitted in St. Clair County in 2024 (378 in 5+ unit buildings).
- This rent is only 14% of the median local income ($95k/yr) — well below the 30% rent-burden line; pricing power to push rent on renewal without tenant pushback.
Forward outlook
- Local home prices are declining (-3.0%/yr); year-one equity from $344 of loan paydown is wiped out by about $1k of value loss. Plan a longer hold.
- St. Clair County population projected at -23% by 2050 — secular population decline; favor cash flow + early exit over multi-decade hold.
- At projected returns (-3.0% appreciation + 3.0% rent growth), your $14k cash investment doubles in ~4 years — after that, you're playing with house money.
Negotiation context
- It's been on market 98 days — a 9% lower offer ($45k) is reasonable based on typical stale-listing flexibility.
- 2 sale attempts; this cycle's ask has dropped $10k (17%) from the opening price — seller is motivated, your offer sets the floor, not the list.
Risks & watch-outs
- Watch-outs: property tax is 4.6% of price; built in 1887 — expect roof / HVAC / electrical / plumbing capex.
- Climate carrying-cost: extreme-heat days projected 7→21/yr by 2055 (HVAC capex compounding) — expect insurance premiums to compound above CPI over the hold.
Questions for the listing agent
- It's been on market 98 days. Have you received any prior offers? Is the seller open to a 9% concession, seller financing, or rate buy-down credit?
- Built in 1887 — when were the roof, HVAC, electrical panel, plumbing, and water heater last replaced?
- Property tax is high relative to price — has the assessment been appealed recently, and will the sale trigger a re-assessment?
- Why hasn't it sold? Are there any deal-killer items the seller is aware of (foundation, flood, title, zoning, code violations)?
- Is there a deadline driving the sale (1031 exchange, divorce, estate, relocation)? That informs how much negotiation room exists.
- What's the average days-on-market for RENTAL listings here right now (not sales)? A rising rental-DOM trend means longer vacancies and softer asking-rent achievability than the comps imply.
- What's the recent tenant-quality profile in this submarket — average credit score on applications, eviction rate, late-payment / NSF rate, and stable-employment percentage? A property-management company in the area should have these aggregated.
- How much new for-sale + rental construction is in the pipeline within 1–3 miles? Heavy new supply typically softens prices + rents 12–24 months out; constrained supply supports both.
Investment metrics
- 1% rule
- 2.18% ✓
- Cap rate
- 15.51%
- Cash-on-cash
- 32.91%
- DSCR
- 2.46
- GRM
- 3.8
CMA / ARV
- ARV (median comp)
- $110,703
- List price
- $49,700
- Delta
- -55.10%
- Verdict
- UNDERPRICED
- Comps
- 5 within 1.0 mi
Projected returns pro-forma
-3.0% appreciation · 3.0% rent growth · sell at horizon
- IRR
- 28.2%
- Equity multiple
- 2.17×
- Total profit
- $16,349
- Equity at exit
- $7,410
- IRR
- 35.7%
- Equity multiple
- 4.30×
- Total profit
- $45,924
- Equity at exit
- $4,297
Cash invested: $13,916 (down + closing). Projections, not guarantees.
Landlord ↔ Tenant lean methodology
- Overall (STATE)
- 43 Moderately Tenant-Leaning
- State Illinois
- 43 Moderately Tenant-Leaning · D+7
- County
- — inherits STATE
- City
- — inherits STATE
ZIP-level market 62258
- Home prices YoY
- -27.2%
- Active inventory
- 58
- Price-to-rent
- 3.8×
Monthly cashflow live
- Estimated rent
- $1,081 medium interval (Pro) →
- Mortgage (P&I)
- −$261
- Tax from tax record
- −$191 /mo · $2,294/yr
- Insurance
- −$21
- HOA
- −$0
- Vacancy / Maint / Mgmt
- −$227
- Net cashflow
- $382
Break-even live
Sensitivity live
| Price | -10% $545 | -5% $396 | +0% $382 | +5% $368 | +10% $354 |
|---|---|---|---|---|---|
| Rent | -10% $296 | -5% $339 | +0% $382 | +5% $424 | +10% $467 |
| Rate | -1.0pp $407 | -0.5pp $394 | base $382 | +0.5pp $369 | +1.0pp $356 |
UW: 25.0% down · 7.5% · 30yr · 1.5% tax · 5.0% vac · 8.0% maint · 8.0% mgmt
Financing live
Cash to close
- Down payment
- $12,425
- Closing costs
- $1,491
- Reserves months
- —
- Total cash needed
- —
Loan-product check · same deal, 3 products live
Conventional
25% down · 7.5% · 30yr
- Down + closing
- —
- Monthly P&I
- —
- Monthly cashflow
- —
- DSCR
- —
- Eligible?
- —
Personal DTI + credit; lowest rate.
DSCR
20% down · 8.5% · 30yr
- Down + closing
- —
- Monthly P&I
- —
- Monthly cashflow
- —
- DSCR
- —
- Eligible?
- —
No personal income docs; deal must DSCR.
Hard money
10% down · 12.0% · 12mo
- Down + closing
- —
- Monthly P&I
- —
- Monthly cashflow
- —
- DSCR
- —
- Eligible?
- —
Short-term bridge; refi at stabilization.
Listing history 18 events
-
2026-06-18days on market $49,700 Active 98 DOM
-
2026-06-17days on market $49,700 Active 97 DOM
-
2026-06-16days on market $49,700 Active 96 DOM
-
2026-06-15days on market $49,700 Active 95 DOM
-
2026-06-13days on market $49,700 Active 93 DOM
-
2026-06-09days on market $49,700 Active 89 DOM
-
2026-06-08days on market $49,700 Active 88 DOM
-
2026-06-07days on market $49,700 Active 87 DOM
-
2026-06-03days on market $49,700 Active 83 DOM
-
2026-06-02days on market $49,700 Active 82 DOM
-
2026-06-01days on market $49,700 Active 81 DOM
-
2026-05-31days on market $49,700 Active 80 DOM
-
2026-05-19price $49,700 151-char remark
Show marketing remark (151 chars)
1 bed, 1 bath home with plenty of potential. Perfect project for someone ready to renovate and make it their own. Would be a great investment property.
-
2026-04-26status Active 151-char remark
Show marketing remark (151 chars)
1 bed, 1 bath home with plenty of potential. Perfect project for someone ready to renovate and make it their own. Would be a great investment property.
-
2026-04-13status Pending 151-char remark
Show marketing remark (151 chars)
1 bed, 1 bath home with plenty of potential. Perfect project for someone ready to renovate and make it their own. Would be a great investment property.
-
2026-04-06price $54,700 151-char remark
Show marketing remark (151 chars)
1 bed, 1 bath home with plenty of potential. Perfect project for someone ready to renovate and make it their own. Would be a great investment property.
-
2026-02-27$59,700 Active 151-char remark
Show marketing remark (151 chars)
1 bed, 1 bath home with plenty of potential. Perfect project for someone ready to renovate and make it their own. Would be a great investment property.
-
2006-05-08soldstatus $50,000
ⓘ Source: listings_history table (triggers on properties + properties_extension) + one-shot
backfill from property_details.listing_events for pre-trigger history.
Tax reassessment forecast IL · Partial reset (capped growth)
- Current annual tax
- $2,294 · $191/mo
- Projected year-2 tax
- $2,294 · $191/mo
- Expected delta
- $0/yr ($0/mo · 0.0%)
ⓘ Screening estimate from a state-policy table — verify with the county assessor before closing.
Climate risk First Street
- Flood 3/10 Moderate FEMA zone X · 20% chance over 30 yrs
- Wildfire 1/10 Low
- Heat 5/10 Major 7 d/yr ≥106°F today · 21 d/yr by 30 yrs out
- Wind 2/10 Low 100% chance of damaging wind over 30 yrs
- Air quality 2/10 Low 0 unhealthy d/yr today · 1 by 30 yrs out
Nearby sold comps map
Loading sold comps map…
Walkable amenities ~0.75 mi
Loading nearby amenities…
Taxation est. · year 1
- Rental income
- $12,975
- − Mortgage interest
- −$2,784
- − Property taxes
- −$2,294
- − Insurance
- −$248
- − Repairs & maintenance
- −$1,038
- − Management
- −$1,038
- − Depreciation
- −$1,446
- Taxable income
- $4,126
- Est. tax owed @ 24.0%
- −$990
- After-tax cash flow
- $3,589/yr
For passive investors: Depreciation is non-cash, so a rental often shows a tax loss while cash-flowing — sheltering income. Rental losses are passive: they offset passive income freely, and up to $25,000/yr can offset ordinary (W-2) income if you actively participate and your MAGI is under $100k (phasing out to $0 by $150k); unused losses carry forward. On sale, claimed depreciation is recaptured at up to 25%, and gains may owe capital-gains tax (a 1031 exchange can defer both). Figures are a year-1 estimate at your 24.0% rate — not tax advice; consult a CPA.
Schools (NCES district)
- District
- Mascoutah CUD 19
- NCES district ID
- 1724940
- Math proficiency
- 42% ▼ -7.00%
- Reading proficiency
- 48% ▼ -11.00%
- Median HH income
- $69,922
- Composite
- 40.52/100
- National rank
- #3708
- State rank
- #80 of 620 in IL
Livability — Mascoutah
- Score
- 68/100
- State rank
- #471
- US rank
- #9746
Category grades
Schools grade is shown separately in the Schools card above.
Census & demographics
- Census place
- Mascoutah, IL
- County
- Saint Clair County · 169,691 people
- City population
- 10,437
- Metro
- St. Louis, MO-IL
- Population (ZIP)
- 10,437
- Household income
- $94,655
- Rent vs Own
- Severe rent burden
- 209.0
Population outlook (St. Clair County) Hauer SSP2
- Today (2025)
- 250,366 people
- By 2030
- 240,511 · -3.9%
- By 2040
- 217,391 · -13.2%
- By 2050
- 192,699 · -23.0%
- By 2075
- 140,637 · -43.8%
- By 2100
- 100,499 · -59.9%
Race, ethnicity, and origin ACS 2023
- Neighborhood character
- Predominantly White (81%)
- Race & ethnicity
- White 81% Two or more races 8% Hispanic / Latino 7% Black 3% Asian 2% Native American 1%
- Hispanic origin (detail)
- Mexican 2%
- Common ancestry
- Romanian 4% Slovak 2% Italian 2%
- Foreign-born
- 3% · Canada
- Languages at home
- 92% English-only · Spanish 4% Tagalog/Filipino 1% Other Asian/Pacific 1%
Political lean MEDSL · St. Clair
- 2024 margin
- Lean D (+7.9) · D 53.0% · R 45.1% · Other 1.8%
- 2008→2024 swing
- -14.6pp toward R · 2008: 22.4pp · 2024: 7.9pp
- All cycles
- 2024: D+7.9 2020: D+8.7 2016: D+5.6 2012: D+14.5 2008: D+22.4
Not yet ingested
- Civics
- —
Market trends
- HPI YoY
- ▼ -68.21%
- Current HPI
- 182.8448
- Rent YoY
- —
- Metro
- St. Louis, MO-IL
- State GDP YoY
- ▲ 1.59%
- F500 in state
- 60
Industry mix (Fortune 500 HQ in IL)
| Industry | F500 HQs | Revenue |
|---|---|---|
| Insurance | 4 | $201B |
|
||
| Consumer Goods | 4 | $87B |
|
||
| Industrial Machinery | 3 | $64B |
|
||
| Healthcare | 2 | $55B |
|
||
| Retail / Pharmacy | 1 | $148B |
|
||
| Agriculture / Food | 1 | $86B |
|
||
Price history
-0.6% since first listed6 events — show timeline
- 2026-05-19 Price Changed $49,700 MARIS as Distributed by MLS Grid
- 2026-04-26 Relisted — MARIS as Distributed by MLS Grid
- 2026-04-13 Pending — MARIS as Distributed by MLS Grid
- 2026-04-06 Price Changed $54,700 MARIS as Distributed by MLS Grid
- 2026-02-27 Listed $59,700 MARIS as Distributed by MLS Grid
- 2006-05-08 Sold (Public Records) $50,000 Public Records
Property tax history
+2.4%/yrLatest (2024): $2,294 · +4.7% YoY. Source: county tax records.
Cash-flow waterfall
monthlySold comps — $/sqft
last 12 mo · ≤1 miLoading sold comps…