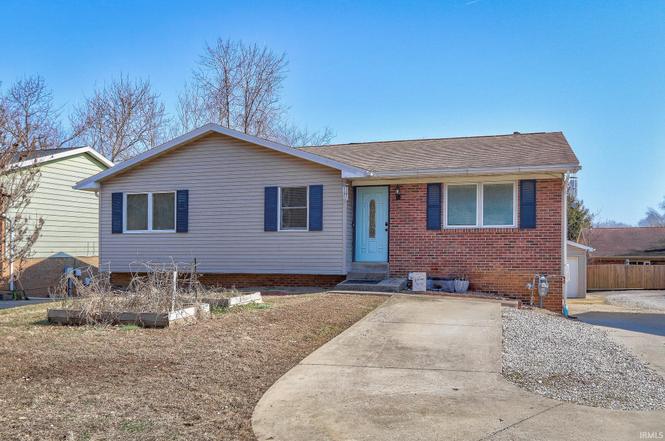
670 S Burkhardt Rd · Evansville, IN
Flood risk 1/10 · Minimal
- FEMA flood zone
- X (unshaded)
- Chance of flooding over 30 yrs
- 0.0%
- Est. flood insurance / yr
- $473 – $860
Fire risk 1/10 · Minimal
- Est. fire insurance / yr
- $717 – $1,331
Heat risk 5/10 · Moderate
- Hot days now (above 106°F)
- 7 days/yr
- Hot days in 30 yrs
- 18 days/yr
Wind risk 2/10 · Minimal
- Chance of severe wind over 30 yrs
- 3.0%
Air-quality risk 3/10 · Minor
- Unhealthy air days now
- 3 days/yr
- Unhealthy air days in 30 yrs
- 4 days/yr
Risk factors via First Street. Map © Google.
Why this score? — see what drove the D- grade
The composite is a weighted blend of 9 inputs, each scored 0–100. Each bar is that input's sub-score; the figure is the points it added to the 100-point composite (weight × sub-score).
- Cash flow +12.7/30.0
- ARV discount +9.3/15.0
- DSCR +3.8/10.0
- Schools +3.3/10.0
- Livability +3.2/5.0
- Rent growth +2.5/5.0
- Condition / age +2.5/5.0
- 1% rule +2.4/10.0
- Appreciation +0.0/10.0
$219,900
🖨 Deal sheet (PDF) 📄 Offer letter ✓ Due diligence
Listing remarks
Welcome to this spacious East Side Evansville home offering over 2,600 square feet of versatile living space! With 5 bedrooms and 2 full baths, there’s room for everyone — whether you need extra bedrooms, a home office, or guest space. Major updates are already taken care of, including an energy-efficient furnace and HVAC (2021), AC (2021), Tankless water heater (2021), and roof (2016). Durable vinyl and laminate flooring flow throughout the home for a clean, updated look. The partially finished walkout basement adds incredible flexibility with a full second kitchen — ideal for an in-law suite, extended stay guests, or separate entertaining space. Outside, enjoy a privacy-
Key facts
- Full second kitchen
- Privacy fenced yard
- Detached garage
Tags
Property features AI
Exterior
- Parking: Detached 2-car garage
- Utilities: Public water; Public sewer
- Home design: Single-family residence (site-built); One story
- Construction: Brick and vinyl siding exterior; Block foundation
- Exterior features: Patio; Porch
Interior
- Kitchen: Dishwasher; Microwave; Refrigerator; Electric cooktop; Electric oven
- Bedrooms: Total of 9 rooms (includes bedrooms and living spaces)
- Bathrooms: 2 full bathrooms; 1 main-level bathroom
- Heating & cooling: Forced air heating; Central air conditioning
- Interior features: Pantry; Eat-in kitchen; Full, partially finished basement
- Laundry & utility: Washer and dryer included; Laundry located in basement
Neighborhood map
What this means for you Summary
Snapshot
- This is a 4-bed/2.0-bath single-family listed at $220k.
Deal economics
- At list price, monthly cash flow is $-22 ($-269/yr) — negative.
- To cash-flow at today's rent, offer at most $216k (1.8% below list).
- To meet the 1% rule (rent ≥ 1% of price), the offer needs to be $164k (25.6% below list).
- Recommended offer: $164k (25.6% below list) — sets the bar for 1% rule.
- Cap rate 6.2% vs local median 4.6% in Evansville — top-decile yield for the area; either an underpriced asset or a hidden risk that comps aren't pricing in. Stress-test before assuming the spread holds.
Location & tenants
- Location reads 63/100 on livability (#416 in IN) — a middle-class / working-renter tenant base. Strengths: cost of living A+, housing A+, health & safety A+; Watch: crime F, commute F, employment D-.
- Evansville Vanderburgh School Corporation (urban): math 36% / reading 43% proficiency, ranked #153 of 301 in IN (top 51%) — families likely to look elsewhere, expect single-tenant / working-renter base with shorter leases.
- Zoned schools: Hebron Elementary School (math 37% / reading 35%, grade F, #577 of 994 statewide, top 59%, 758 students, 56% FRL); Plaza Park International Prep Acad (math 27% / reading 37%, grade F, #190 of 330 statewide, top 59%, 650 students, 65% FRL); William Henry Harrison High School (math 29% / reading 54%, grade F, #211 of 369 statewide, top 58%, 1,158 students, 61% FRL).
- Market conditions: 181 active listings in the ZIP; 10 comparable units currently listed for rent nearby; rentals at typical pace (median 23d on market — plan ~3-4 weeks tenant-placement turnaround); 508 units permitted in Vanderburgh County in 2024 (32 in 5+ unit buildings).
- This rent runs 32% of the median local income ($61k/yr) — at the standard rent-burdened threshold; future hikes will face affordability resistance.
Forward outlook
- Local home prices are declining (-3.0%/yr); year-one equity from $2k of loan paydown is wiped out by about $7k of value loss. Plan a longer hold.
Negotiation context
- It's been on market 106 days — a 9% lower offer ($200k) is reasonable based on typical stale-listing flexibility.
- 3 sale attempts; this cycle's ask has dropped $20k (8%) from the opening price — seller is motivated, your offer sets the floor, not the list.
Risks & watch-outs
- Climate carrying-cost: extreme-heat days projected 7→18/yr by 2055 (HVAC capex compounding) — expect insurance premiums to compound above CPI over the hold.
Questions for the listing agent
- What do current leases actually rent for vs. the listed asking? Can we see a recent rent roll and the last 12 months of T-12 income?
- It's been on market 106 days. Have you received any prior offers? Is the seller open to a 26% concession, seller financing, or rate buy-down credit?
- Built in 1979 — when were the roof, HVAC, electrical panel, plumbing, and water heater last replaced?
- Why hasn't it sold? Are there any deal-killer items the seller is aware of (foundation, flood, title, zoning, code violations)?
- Is there a deadline driving the sale (1031 exchange, divorce, estate, relocation)? That informs how much negotiation room exists.
- Schools are D-rated, which usually means shorter tenancies and higher turnover. Who's the typical renter profile here, and what's been the actual vacancy rate?
- Crime grade is F in this area — have there been break-ins, vandalism, or insurance claims at this property in the last 3 years? What carrier currently insures it and at what premium?
- The area grade is low — what's the realistic commute time and amenity access for the typical tenant pool here? Any planned neighborhood developments (good or bad) we should know about?
- What's the average days-on-market for RENTAL listings here right now (not sales)? A rising rental-DOM trend means longer vacancies and softer asking-rent achievability than the comps imply.
- What's the recent tenant-quality profile in this submarket — average credit score on applications, eviction rate, late-payment / NSF rate, and stable-employment percentage? A property-management company in the area should have these aggregated.
- How much new for-sale + rental construction is in the pipeline within 1–3 miles? Heavy new supply typically softens prices + rents 12–24 months out; constrained supply supports both.
Investment metrics
- 1% rule
- 0.74% ✗
- Cap rate
- 6.17%
- Cash-on-cash
- -0.44%
- DSCR
- 0.98
- GRM
- 11.2
CMA / ARV
- ARV (on-the-fly)
- $228,798
- Comps found
- 12
Show comp detail 12 sales within ~0.75 mi
| Address | Dist | Beds/Ba | Sqft | Sold | Price | $/sf | Match |
|---|---|---|---|---|---|---|---|
| 437 Hollybush Ln | 0.25mi | 3/2.0 (-1) | 1,318 (-2%) | 2mo | $235,000 | $178 | 79 |
| 720 Southfield Rd | 0.22mi | 3/2.0 (-1) | 1,371 (+2%) | 8mo | $245,000 | $179 | 74 |
| 6412 E Oak St | 0.21mi | 3/1.5 (-1) | 1,277 (-5%) | 6mo | $189,000 | $148 | 71 |
| 6015 E Walnut St | 0.42mi | 3/2.0 (-1) | 1,288 (-4%) | 1mo | $220,000 | $171 | 69 |
| 213 Thompson Ave | 0.47mi | 3/2.0 (-1) | 1,416 (+6%) | 1mo | $257,000 | $181 | 63 |
| 845 Park Plaza Dr | 0.47mi | 3/2.0 (-1) | 1,388 (+4%) | 5mo | $227,900 | $164 | 63 |
| 816 Southfield Rd | 0.28mi | 4/2.0 | 1,512 (+13%) | 7mo | $214,900 | $142 | 60 |
| 214 Shane Ct | 0.44mi | 3/2.0 (-1) | 1,450 (+8%) | 2mo | $250,000 | $172 | 59 |
| 7510 E Mulberry St | 0.71mi | 3/2.0 (-1) | 1,425 (+6%) | 0mo | $244,900 | $172 | 51 |
| 832 S Cullen Ave Ave | 0.72mi | 3/1.0 (-1) | 1,296 (-3%) | 2mo | $194,900 | $150 | 50 |
| 915 S Royal Ave | 0.59mi | 3/2.0 (-1) | 1,473 (+10%) | 5mo | $230,000 | $156 | 46 |
| 7419 Lincoln Ave | 0.69mi | 3/1.0 (-1) | 1,222 (-9%) | 2mo | $180,000 | $147 | 43 |
Match score weights: distance 35% · size 25% · config 20% · recency 20%. Top-matched comps best support the ARV.
Projected returns pro-forma
-3.0% appreciation · 3.0% rent growth · sell at horizon
- IRR
- -17.1%
- Equity multiple
- 0.40×
- Total profit
- $-37,162
- Equity at exit
- $32,788
- IRR
- -9.1%
- Equity multiple
- 0.44×
- Total profit
- $-34,609
- Equity at exit
- $19,013
Cash invested: $61,572 (down + closing). Projections, not guarantees.
Landlord ↔ Tenant lean methodology
- Overall (STATE)
- 90 Strongly Landlord-Friendly
- State Indiana
- 90 Strongly Landlord-Friendly · R+11
- County
- — inherits STATE
- City
- — inherits STATE
ZIP-level market 47715
- Active inventory
- 181
- Price-to-rent
- 11.2×
Monthly cashflow live
- Estimated rent
- $1,636 high interval (Pro) →
- Mortgage (P&I)
- −$1,153
- Tax from tax record
- −$70 /mo · $841/yr
- Insurance
- −$92
- HOA
- −$0
- Vacancy / Maint / Mgmt
- −$344
- Net cashflow
- $-22
Break-even live
Sensitivity live
| Price | -10% $102 | -5% $40 | +0% $-22 | +5% $-85 | +10% $-147 |
|---|---|---|---|---|---|
| Rent | -10% $-152 | -5% $-87 | +0% $-22 | +5% $42 | +10% $107 |
| Rate | -1.0pp $88 | -0.5pp $34 | base $-22 | +0.5pp $-79 | +1.0pp $-137 |
UW: 25.0% down · 7.5% · 30yr · 1.5% tax · 5.0% vac · 8.0% maint · 8.0% mgmt
Financing live
Cash to close
- Down payment
- $54,975
- Closing costs
- $6,597
- Reserves months
- —
- Total cash needed
- —
Loan-product check · same deal, 3 products live
Conventional
25% down · 7.5% · 30yr
- Down + closing
- —
- Monthly P&I
- —
- Monthly cashflow
- —
- DSCR
- —
- Eligible?
- —
Personal DTI + credit; lowest rate.
DSCR
20% down · 8.5% · 30yr
- Down + closing
- —
- Monthly P&I
- —
- Monthly cashflow
- —
- DSCR
- —
- Eligible?
- —
No personal income docs; deal must DSCR.
Hard money
10% down · 12.0% · 12mo
- Down + closing
- —
- Monthly P&I
- —
- Monthly cashflow
- —
- DSCR
- —
- Eligible?
- —
Short-term bridge; refi at stabilization.
Rent comps 10 comps
| Address | Beds | Baths | Sqft | Rent | $/sqft | DOM | Units | Dist |
|---|---|---|---|---|---|---|---|---|
| 100 Williamsburg Dr Evansville, IN | 1.0–3.0 | 1.0–1.5 | 960 | $1,475 | $1.54 | 15d | 10 | 0.53mi |
| 7501 E Powell Ave Evansville, IN | 3.0 | 1.0 | 1100 | $1,650 | $1.50 | 23d | 1 | 0.74mi |
| 200 Kimber Ln Evansville, IN | 1.0–3.0 | 1.0–1.5 | 1025 | $1,399 | $1.36 | 15d | 5 | 0.76mi |
| 1100 Erie Ave Evansville, IN | 1.0–3.0 | 1.0–2.0 | 962 | $1,500 | $1.56 | 23d | 2 | 0.92mi |
| 410 Fuquay Rd Evansville, IN | 1.0–3.0 | 1.0–2.0 | 955 | $1,576 | $1.65 | 15d | 11 | 0.96mi |
| 1701 Southfield Rd Evansville, IN | 3.0 | 2.5 | 1696 | $1,900 | $1.12 | 23d | 1 | 0.98mi |
| 728 Cross Pointe Blvd Evansville, IN | 3.0 | 1.0 | 1052 | $1,100 | $1.05 | 23d | 1 | 1.22mi |
| 7900 Circle Front Ct Evansville, IN | 1.0–3.0 | 1.0–2.0 | 953 | $1,569 | $1.65 | 15d | 6 | 1.33mi |
| 1900 Pueblo Pass Evansville, IN | 2.0–3.0 | 1.5 | 1081 | $1,379 | $1.28 | 15d | 5 | 1.36mi |
| 705 Beachfront Dr Evansville, IN | 3.0 | 2.0 | 1325 | $1,549 | $1.17 | 23d | 1 | 1.43mi |
Listing history 22 events
-
2026-06-22days on market $219,900 Active 106 DOM
-
2026-06-18days on market $219,900 Active 103 DOM
-
2026-06-17days on market $219,900 Active 102 DOM
-
2026-06-16days on market $219,900 Active 101 DOM
-
2026-06-15days on market $219,900 Active 100 DOM
-
2026-06-14days on market $219,900 Active 98 DOM
-
2026-06-13pricedays on market $219,900 Active 97 DOM
-
2026-06-10days on market $225,000 Active 95 DOM
-
2026-06-09days on market $225,000 Active 94 DOM
-
2026-06-08days on market $225,000 Active 93 DOM
-
2026-06-07days on market $225,000 Active 92 DOM
-
2026-06-02days on market $225,000 Active 87 DOM
-
2026-06-01days on market $225,000 Active 86 DOM
-
2026-05-31days on market $225,000 Active 85 DOM
-
2026-05-30days on market $225,000 Active 84 DOM
-
2026-05-22price $227,500
-
2026-05-07status Active
-
2026-05-07historical
-
2026-05-01status Active
-
2026-03-17price $229,900
-
2026-03-05price $234,900
-
2026-02-13$239,900 Active
ⓘ Source: listings_history table (triggers on properties + properties_extension) + one-shot
backfill from property_details.listing_events for pre-trigger history.
Tax reassessment forecast IN · Partial reset (capped growth)
- Current annual tax
- $841 · $70/mo
- Projected year-2 tax
- $1,355 · $113/mo
- Expected delta
- +$514/yr (+$43/mo · 61.1%)
ⓘ Screening estimate from a state-policy table — verify with the county assessor before closing.
Climate risk First Street
- Flood 1/10 Low FEMA zone X (unshaded) · 0% chance over 30 yrs
- Wildfire 1/10 Low
- Heat 5/10 Major 7 d/yr ≥106°F today · 18 d/yr by 30 yrs out
- Wind 2/10 Low 3% chance of damaging wind over 30 yrs
- Air quality 3/10 Moderate 3 unhealthy d/yr today · 4 by 30 yrs out
Nearby sold comps map
Loading sold comps map…
Walkable amenities ~0.75 mi
Loading nearby amenities…
Taxation est. · year 1
- Rental income
- $19,632
- − Mortgage interest
- −$12,318
- − Property taxes
- −$841
- − Insurance
- −$1,100
- − Repairs & maintenance
- −$1,571
- − Management
- −$1,571
- − Depreciation
- −$6,397
- Taxable loss
- −$4,164
- Est. tax savings @ 24.0%
- +$999
- After-tax cash flow
- $730/yr
For passive investors: Depreciation is non-cash, so a rental often shows a tax loss while cash-flowing — sheltering income. Rental losses are passive: they offset passive income freely, and up to $25,000/yr can offset ordinary (W-2) income if you actively participate and your MAGI is under $100k (phasing out to $0 by $150k); unused losses carry forward. On sale, claimed depreciation is recaptured at up to 25%, and gains may owe capital-gains tax (a 1031 exchange can defer both). Figures are a year-1 estimate at your 24.0% rate — not tax advice; consult a CPA.
Schools (NCES district)
- District
- Evansville Vanderburgh School Corporation
- NCES district ID
- 1803450
- Math proficiency
- 36% ▼ -7.00%
- Reading proficiency
- 43% ▼ -3.00%
- Median HH income
- $43,270
- Composite
- 33.41/100
- National rank
- #5471
- State rank
- #153 of 301 in IN
Livability — Evansville
- Score
- 63/100
- State rank
- #416
- US rank
- #15047
Category grades
Schools grade is shown separately in the Schools card above.
Census & demographics
- Census place
- Evansville, IN
- County
- Vanderburgh County · 146,793 people
- City population
- 146,793
- Metro
- Evansville, IN-KY
- Population (ZIP)
- 29,280
- Household income
- $60,897
- Rent vs Own
- Severe rent burden
- 1652.0
Population outlook (Vanderburgh County) Hauer SSP2
- Today (2025)
- 187,038 people
- By 2030
- 188,907 · +1.0%
- By 2040
- 190,272 · +1.7%
- By 2050
- 188,871 · +1.0%
- By 2075
- 180,751 · -3.4%
- By 2100
- 163,015 · -12.8%
Race, ethnicity, and origin ACS 2023
- Neighborhood character
- Predominantly White (74%)
- Race & ethnicity
- White 74% Black 13% Hispanic / Latino 6% Two or more races 4% Asian 2% Native American 1%
- Hispanic origin (detail)
- Mexican 5%
- Common ancestry
- Slovak 3% Romanian 2% Italian 2%
- Foreign-born
- 6% · Canada, China
- Languages at home
- 93% English-only · Spanish 4% Chinese 1%
Political lean MEDSL · Vanderburgh
- 2024 margin
- R (+12.7) · D 43.0% · R 55.6% · Other 1.4%
- 2008→2024 swing
- -15.1pp toward R · 2008: 2.5pp · 2024: -12.7pp
- All cycles
- 2024: R+12.7 2020: R+9.6 2016: R+16.9 2012: R+10.8 2008: D+2.5
Not yet ingested
- Civics
- —
Market trends
- HPI YoY
- ▼ -113.01%
- Current HPI
- 195.7299
- Rent YoY
- —
- Metro
- Evansville, IN-KY
- State GDP YoY
- ▲ 2.90%
- F500 in state
- 18
Industry mix (Fortune 500 HQ in IN)
| Industry | F500 HQs | Revenue |
|---|---|---|
| Industrial Machinery | 2 | $37B |
|
||
| Healthcare | 1 | $177B |
|
||
| Pharmaceuticals | 1 | $45B |
|
||
| Metals / Steel | 1 | $18B |
|
||
| Agriculture | 1 | $17B |
|
||
| Packaging | 1 | $12B |
|
||
Price history
-5.2% since first listed7 events — show timeline
- 2026-05-22 Price Changed $227,500 IRMLS
- 2026-05-07 Relisted — IRMLS
- 2026-05-07 Delisted — IRMLS
- 2026-05-01 Relisted — IRMLS
- 2026-03-17 Price Changed $229,900 IRMLS
- 2026-03-05 Price Changed $234,900 IRMLS
- 2026-02-13 Listed $239,900 IRMLS
Property tax history
-5.1%/yrLatest (2024): $841 · +2.0% YoY. Source: county tax records.
Cash-flow waterfall
monthlySold comps — $/sqft
last 12 mo · ≤1 miLoading sold comps…