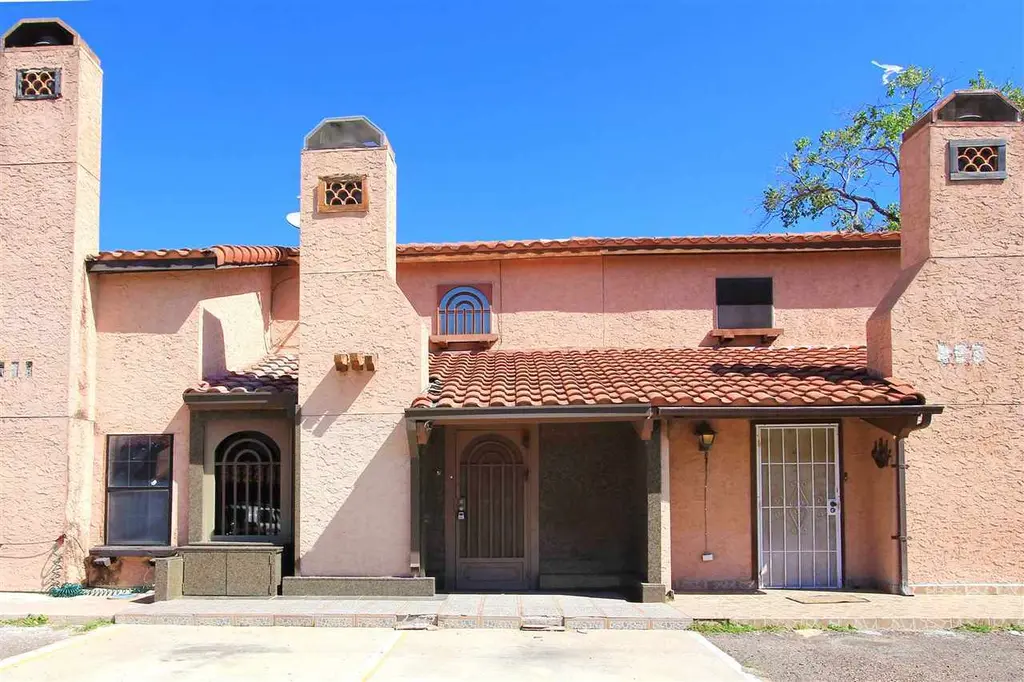
5500 Mcpherson Rd #29 · Laredo, TX
Flood risk No data
- FEMA flood zone
- —
- Chance of flooding over 30 yrs
- —
- Est. flood insurance / yr
- —
Fire risk No data
- Est. fire insurance / yr
- —
Heat risk No data
- Hot days now (above threshold)
- —
- Hot days in 30 yrs
- —
Wind risk No data
- Chance of severe wind over 30 yrs
- —
Air-quality risk No data
- Unhealthy air days now
- —
- Unhealthy air days in 30 yrs
- —
Risk factors via First Street. Map © Google.
Why this score? — see what drove the D grade
The composite is a weighted blend of 9 inputs, each scored 0–100. Each bar is that input's sub-score; the figure is the points it added to the 100-point composite (weight × sub-score).
- Cash flow +13.9/30.0
- ARV discount +7.5/15.0
- DSCR +4.2/10.0
- 1% rule +3.9/10.0
- Livability +3.7/5.0
- Schools +2.8/10.0
- Rent growth +2.5/5.0
- Condition / age +2.5/5.0
- Appreciation +0.0/10.0
$159,000
🖨 Deal sheet 📄 Offer letter ✓ Due diligence
Listing remarks MLS
Stylish 2-story condo in central Laredo featuring 2 bedrooms and 1 bath. Numerous upgrades throughout, including granite floors and custom wood details, make this home truly one of a kind. Enjoy the privacy of an enclosed back patio—a must see!
Key facts
- 2 story condo
- Granite floors
- Custom wood details
Tags
Neighborhood map
What this means for you Summary
Snapshot
- This is a 2-bed/1.5-bath single-family listed at $159k.
Deal economics
- At list price, monthly cash flow is $18 ($214/yr) — positive.
- The deal already cash-flows at list — no discount required.
- To meet the 1% rule (rent ≥ 1% of price), the offer needs to be $141k (11.1% below list).
- Recommended offer: $140k (12.0% below list) — sets the bar for market timing.
- Cap rate 6.4% vs local median 4.1% in Laredo — top-decile yield for the area; either an underpriced asset or a hidden risk that comps aren't pricing in. Stress-test before assuming the spread holds.
Location & tenants
- Location reads 73/100 on livability (#227 in TX) — a middle-class / working-renter tenant base. Strengths: cost of living A+, housing A+, health & safety A+; Watch: schools C-, crime C-, employment D+.
- United ISD (urban): math 27% / reading 38% proficiency, ranked #568 of 826 in TX (top 69%) — families likely to look elsewhere, expect single-tenant / working-renter base with shorter leases; 72% free/reduced lunch — lower-income household profile, screen leases tightly.
- Market conditions: 124 active listings in the ZIP; 12 comparable units currently listed for rent nearby; rentals lingering (median 44d on market — plan ~5-8 weeks vacancy on turnover, expect pricing pressure); 100% of comp listings sitting > 30 days — soft ceiling on asking rent; 1,448 units permitted in Webb County in 2024 (245 in 5+ unit buildings).
Forward outlook
- Local home prices are declining (-3.0%/yr); year-one equity from $1k of loan paydown is wiped out by about $5k of value loss. Plan a longer hold.
- Webb County population projected at +23% by 2050 — long-run rental-demand tailwind backs the buy-and-hold thesis.
Negotiation context
- It's been on market 268 days — a 12% lower offer ($140k) is reasonable based on typical stale-listing flexibility.
- 3 sale attempts; this cycle's ask is 12131% above the opening price — seller raised mid-cycle; expect resistance to lowballs.
Questions for the listing agent
- It's been on market 268 days. Have you received any prior offers? Is the seller open to a 12% concession, seller financing, or rate buy-down credit?
- Why hasn't it sold? Are there any deal-killer items the seller is aware of (foundation, flood, title, zoning, code violations)?
- Is there a deadline driving the sale (1031 exchange, divorce, estate, relocation)? That informs how much negotiation room exists.
- The area grade is low — what's the realistic commute time and amenity access for the typical tenant pool here? Any planned neighborhood developments (good or bad) we should know about?
- What's the average days-on-market for RENTAL listings here right now (not sales)? A rising rental-DOM trend means longer vacancies and softer asking-rent achievability than the comps imply.
- What's the recent tenant-quality profile in this submarket — average credit score on applications, eviction rate, late-payment / NSF rate, and stable-employment percentage? A property-management company in the area should have these aggregated.
- How much new for-sale + rental construction is in the pipeline within 1–3 miles? Heavy new supply typically softens prices + rents 12–24 months out; constrained supply supports both.
Investment metrics
- 1% rule
- 0.89% ✗
- Cap rate
- 6.43%
- Cash-on-cash
- 0.48%
- DSCR
- 1.02
- GRM
- 9.4
CMA / ARV
No comps found within radius.
Projected returns pro-forma
-3.0% appreciation · 3.0% rent growth · sell at horizon
- IRR
- -15.5%
- Equity multiple
- 0.45×
- Total profit
- $-24,608
- Equity at exit
- $23,707
- IRR
- -7.0%
- Equity multiple
- 0.55×
- Total profit
- $-19,878
- Equity at exit
- $13,747
Cash invested: $44,520 (down + closing). Projections, not guarantees.
Landlord ↔ Tenant lean methodology
- Overall (STATE)
- 87 Strongly Landlord-Friendly
- State Texas
- 87 Strongly Landlord-Friendly · R+5
- County
- — inherits STATE
- City
- — inherits STATE
ZIP-level market 78041
- Active inventory
- 124
- Price-to-rent
- 9.4×
Monthly cashflow live
- Estimated rent
- $1,413 high interval (Pro) →
- Mortgage (P&I)
- −$834
- Tax est. 1.5%
- −$199 /mo · $2,385/yr
- Insurance
- −$66
- HOA
- −$0
- Vacancy / Maint / Mgmt
- −$297
- Net cashflow
- $18
Break-even live
UW: 25.0% down · 7.5% · 30yr · 1.5% tax · 5.0% vac · 8.0% maint · 8.0% mgmt
Financing live
Cash to close
- Down payment
- $39,750
- Closing costs
- $4,770
- Reserves months
- —
- Total cash needed
- —
Loan-product check · same deal, 3 products live
Conventional
25% down · 7.5% · 30yr
- Down + closing
- —
- Monthly P&I
- —
- Monthly cashflow
- —
- DSCR
- —
- Eligible?
- —
Personal DTI + credit; lowest rate.
DSCR
20% down · 8.5% · 30yr
- Down + closing
- —
- Monthly P&I
- —
- Monthly cashflow
- —
- DSCR
- —
- Eligible?
- —
No personal income docs; deal must DSCR.
Hard money
10% down · 12.0% · 12mo
- Down + closing
- —
- Monthly P&I
- —
- Monthly cashflow
- —
- DSCR
- —
- Eligible?
- —
Short-term bridge; refi at stabilization.
Rent comps 12 comps
| Address | Beds | Baths | Sqft | Rent | $/sqft | DOM | Units | Dist |
|---|---|---|---|---|---|---|---|---|
| 1315 E Hillside Rd Laredo, TX | 2.0 | 1.5 | 920 | $1,000 | $1.09 | 44d | 1 | 0.29mi |
| 105 Indiana St Laredo, TX | 3.0 | 2.5 | 1843 | $2,000 | $1.09 | 44d | 1 | 0.44mi |
| 5816 Longoria Loop Laredo, TX | 3.0 | 2.0 | 1007 | $1,300 | $1.29 | 44d | 1 | 0.61mi |
| 5410 Marcella Ave Unit 13 Laredo, TX | 2.0 | 2.0 | 945 | $1,200 | $1.27 | 44d | 1 | 0.63mi |
| 5410 Marcella Ave #9 Laredo, TX | 2.0 | 2.0 | 945 | $1,300 | $1.38 | 44d | 1 | 0.63mi |
| 707 Saint James Dr #105 Laredo, TX | 3.0 | 3.5 | 1510 | $1,950 | $1.29 | 44d | 1 | 0.73mi |
| 4505 Springfield Ave Laredo, TX | 1.0–3.0 | 1.0–2.0 | 740 | $875 | $1.18 | 44d | 3 | 0.91mi |
| 1609 Suldana Ave Unit 323 Laredo, TX | 3.0 | 2.5 | 1638 | $1,800 | $1.10 | 44d | 1 | 1.09mi |
| 1609 Suldana Ave #327 Laredo, TX | 3.0 | 2.5 | 1638 | $1,850 | $1.13 | 44d | 1 | 1.09mi |
| 1601 Jacaman Rd Laredo, TX | 2.0 | 2.0 | 1005 | $1,349 | $1.34 | 44d | 1 | 1.21mi |
| 6718 Springfield Ave Laredo, TX | 1.0–3.0 | 1.0–2.5 | 967 | $1,370 | $1.42 | 44d | 13 | 1.39mi |
| 3509 Springfield Ave Laredo, TX | 3.0 | 2.0 | 1394 | $1,250 | $0.90 | 44d | 1 | 1.42mi |
Listing history 21 events
-
2026-06-19days on market $159,000 Active 268 DOM
-
2026-06-18days on market $159,000 Active 267 DOM
-
2026-06-17days on market $159,000 Active 266 DOM
-
2026-06-16days on market $159,000 Active 265 DOM
-
2026-06-15days on market $159,000 Active 264 DOM
-
2026-06-14days on market $159,000 Active 262 DOM
-
2026-06-13days on market $159,000 Active 261 DOM
-
2026-06-10days on market $159,000 Active 259 DOM
-
2026-06-09days on market $159,000 Active 258 DOM
-
2026-06-08days on market $159,000 Active 257 DOM
-
2026-06-07days on market $159,000 Active 256 DOM
-
2026-06-03days on market $159,000 Active 252 DOM
-
2026-06-02days on market $159,000 Active 251 DOM
-
2026-06-01days on market $159,000 Active 250 DOM
-
2026-05-31days on market $159,000 Active 249 DOM
-
2026-05-30days on market $159,000 Active 248 DOM
-
2026-03-04historical $1,300
-
2026-02-10$1,300
-
2025-10-27historical $1,300
-
2025-09-25$1,300
-
2025-09-24$159,000 Active 250-char remark
Show marketing remark (250 chars)
Stylish 2-story condo in central Laredo featuring 2 bedrooms and 1 bath. Numerous upgrades throughout, including granite floors and custom wood details, make this home truly one of a kind. Enjoy the privacy of an enclosed back patio—a must see!
ⓘ Source: listings_history table (triggers on properties + properties_extension) + one-shot
backfill from property_details.listing_events for pre-trigger history.
Nearby sold comps map
Loading sold comps map…
Walkable amenities ~0.75 mi
Loading nearby amenities…
Taxation est. · year 1
- Rental income
- $16,962
- − Mortgage interest
- −$8,906
- − Property taxes
- −$2,385
- − Insurance
- −$795
- − Repairs & maintenance
- −$1,357
- − Management
- −$1,357
- − Depreciation
- −$4,625
- Taxable loss
- −$2,464
- Est. tax savings @ 24.0%
- +$591
- After-tax cash flow
- $805/yr
For passive investors: Depreciation is non-cash, so a rental often shows a tax loss while cash-flowing — sheltering income. Rental losses are passive: they offset passive income freely, and up to $25,000/yr can offset ordinary (W-2) income if you actively participate and your MAGI is under $100k (phasing out to $0 by $150k); unused losses carry forward. On sale, claimed depreciation is recaptured at up to 25%, and gains may owe capital-gains tax (a 1031 exchange can defer both). Figures are a year-1 estimate at your 24.0% rate — not tax advice; consult a CPA.
Schools (NCES district)
- District
- United ISD
- NCES district ID
- 4843650
- Math proficiency
- 27% ▼ -36.00%
- Reading proficiency
- 38% ▼ -11.00%
- Median HH income
- $47,780
- Composite
- 28.02/100
- National rank
- #6848
- State rank
- #568 of 826 in TX
Livability — Laredo
- Score
- 73/100
- State rank
- #227
- US rank
- #5399
Category grades
Schools grade is shown separately in the Schools card above.
Census & demographics
- Census place
- Laredo, TX
- City population
- 67,333
- Population (ZIP)
- 47,089
Population outlook (Webb County) Hauer SSP2
- Today (2025)
- 301,387 people
- By 2030
- 316,307 · +5.0%
- By 2040
- 345,636 · +14.7%
- By 2050
- 370,647 · +23.0%
- By 2075
- 413,907 · +37.3%
- By 2100
- 416,458 · +38.2%
Race, ethnicity, and origin ACS 2023
- Neighborhood character
- Predominantly Hispanic (93%)
- Race & ethnicity
- Hispanic / Latino 93% Two or more races 52% White 5% Asian 1%
- Hispanic origin (detail)
- Mexican 87%
- Foreign-born
- 24% · Canada, South Korea
- Languages at home
- 14% English-only · Spanish 85%
Political lean MEDSL · Webb
- 2024 margin
- Toss-up / Even · D 48.5% · R 50.7%
- 2008→2024 swing
- -45.6pp toward R · 2008: 43.4pp · 2024: -2.2pp
- All cycles
- 2024: R+2.2 2020: D+23.3 2016: D+51.6 2012: D+54.0 2008: D+43.4
Not yet ingested
- Civics
- —
Market trends
- HPI YoY
- ▼ -188.15%
- Current HPI
- 162.152
- Rent YoY
- —
- Metro
- —
- State GDP YoY
- ▲ 3.95%
- F500 in state
- 110
Industry mix (Fortune 500 HQ in TX)
| Industry | F500 HQs | Revenue |
|---|---|---|
| Energy | 16 | $1,198B |
|
||
| Technology | 5 | $198B |
|
||
| Engineering / Construction | 4 | $72B |
|
||
| Energy Services | 3 | $60B |
|
||
| Utilities | 3 | $41B |
|
||
| Healthcare | 2 | $330B |
|
||
Price history
-99.2% since first listed5 events — show timeline
- 2026-03-04 Rental Removed $1,300 LAOR
- 2026-02-10 Listed for Rent $1,300 LAOR
- 2025-10-27 Rental Removed $1,300 LAOR
- 2025-09-25 Listed for Rent $1,300 LAOR
- 2025-09-24 Listed $159,000 LAOR
Cash-flow waterfall
monthlySold comps — $/sqft
last 12 mo · ≤1 miLoading sold comps…