14828 Bluewater Rd · North Fort Myers, FL
Flood risk No data
- FEMA flood zone
- —
- Chance of flooding over 30 yrs
- —
- Est. flood insurance / yr
- —
Fire risk No data
- Est. fire insurance / yr
- —
Heat risk No data
- Hot days now (above threshold)
- —
- Hot days in 30 yrs
- —
Wind risk No data
- Chance of severe wind over 30 yrs
- —
Air-quality risk No data
- Unhealthy air days now
- —
- Unhealthy air days in 30 yrs
- —
Risk factors via First Street. Map © Google.
Why this score? — see what drove the D- grade
The composite is a weighted blend of 9 inputs, each scored 0–100. Each bar is that input's sub-score; the figure is the points it added to the 100-point composite (weight × sub-score).
- Cash flow +14.5/30.0
- Schools +4.6/10.0
- DSCR +4.4/10.0
- 1% rule +4.0/10.0
- Livability +3.7/5.0
- Rent growth +3.5/5.0
- Condition / age +2.5/5.0
- Appreciation +2.4/10.0
- ARV discount +0.0/15.0
$297,698
🖨 Deal sheet (PDF) 📄 Offer letter ✓ Due diligence
Listing remarks
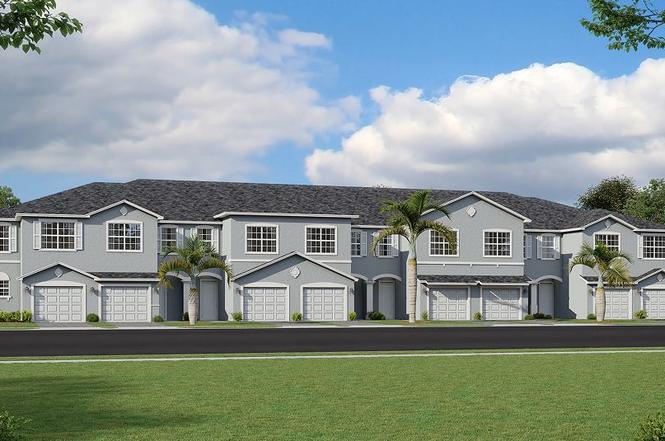
This modern two-story home features an open design that flows the kitchen, dining room and family room together, culminating in a screened lanai for outdoor entertaining. The second level showcases a luxe owner's suite and two additional bedrooms for comfortable living.
Key facts
- Luxe owner's suite
- Screened lanai
- Garage
Tags
Property features AI
Finance
- Financial info: List price $297,698
Exterior
- Parking: 1-car garage (1 total parking space)
- Home design: Spec new-construction home — Berkly plan
- Exterior features: Property located at 14828 Bluewater Rd, Punta Gorda, FL 33982
Interior
- Bedrooms: 3 bedrooms
- Bathrooms: 2 full bathrooms and 1 half bathroom
- Interior features: Open living area (1,879 total living area)
Neighborhood map
What this means for you Summary
Snapshot
- This is a 3-bed/2.5-bath townhouse listed at $298k.
Deal economics
- At list price, monthly cash flow is $67 ($799/yr) — positive.
- The deal already cash-flows at list — no discount required.
- To meet the 1% rule (rent ≥ 1% of price), the offer needs to be $269k (9.7% below list).
- Recommended offer: $269k (9.7% below list) — sets the bar for 1% rule.
- Cap rate 6.6% vs local median 3.6% in North Fort Myers — top-decile yield for the area; either an underpriced asset or a hidden risk that comps aren't pricing in. Stress-test before assuming the spread holds.
Location & tenants
- Location reads 74/100 on livability (#269 in FL, #4,409 nationally) — a middle-class / working-renter tenant base. Strengths: cost of living A+, housing A+, health & safety A+; Watch: employment C-, amenities F, commute F.
- Charlotte (suburban): math 54% / reading 54% proficiency, ranked #22 of 73 in FL (top 30%) — acceptable for families but not a draw, mixed tenant base, ~2y average lease.
- Market conditions: Rents rising fast (+4.1%/yr); 1037 active listings in the ZIP; 38 comparable units currently listed for rent nearby; rentals at typical pace (median 23d on market — plan ~3-4 weeks tenant-placement turnaround); 4,585 units permitted in Charlotte County in 2024 (703 in 5+ unit buildings).
- This rent runs 45% of the median local income ($72k/yr) — at the standard rent-burdened threshold; future hikes will face affordability resistance.
Forward outlook
- Local home prices are declining (-3.0%/yr); year-one equity from $2k of loan paydown is wiped out by about $9k of value loss. Plan a longer hold.
- Charlotte County population projected at +24% by 2050 — long-run rental-demand tailwind backs the buy-and-hold thesis.
Negotiation context
- Only 1 days on market — expect competitive offers; lowballing is unlikely to land.
Questions for the listing agent
- Is there a deadline driving the sale (1031 exchange, divorce, estate, relocation)? That informs how much negotiation room exists.
- The area grade is low — what's the realistic commute time and amenity access for the typical tenant pool here? Any planned neighborhood developments (good or bad) we should know about?
- What's the average days-on-market for RENTAL listings here right now (not sales)? A rising rental-DOM trend means longer vacancies and softer asking-rent achievability than the comps imply.
- What's the recent tenant-quality profile in this submarket — average credit score on applications, eviction rate, late-payment / NSF rate, and stable-employment percentage? A property-management company in the area should have these aggregated.
- How much new for-sale + rental construction is in the pipeline within 1–3 miles? Heavy new supply typically softens prices + rents 12–24 months out; constrained supply supports both.
Investment metrics
- 1% rule
- 0.90% ✗
- Cap rate
- 6.56%
- Cash-on-cash
- 0.96%
- DSCR
- 1.04
- GRM
- 9.2
CMA / ARV
- ARV (on-the-fly)
- $231,117
- Comps found
- 5
Show comp detail 5 sales within ~0.75 mi
| Address | Dist | Beds/Ba | Sqft | Sold | Price | $/sf | Match |
|---|---|---|---|---|---|---|---|
| 14863 White Pearl Rd | 0.04mi | 3/2.5 | 1,879 (0%) | 4mo | $249,000 | $133 | 95 |
| 15027 White Pearl Rd | 0.22mi | 3/2.5 | 1,879 (0%) | 7mo | $230,000 | $122 | 84 |
| 15019 White Pearl Rd | 0.21mi | 3/2.5 | 1,879 (0%) | 11mo | $255,000 | $136 | 81 |
| 15003 White Pearl Rd | 0.19mi | 3/2.5 | 1,871 (-0%) | 13mo | $229,999 | $123 | 80 |
| 15031 White Pearl Rd | 0.22mi | 3/3.0 | 1,905 (+1%) | 13mo | $232,998 | $122 | 75 |
Match score weights: distance 35% · size 25% · config 20% · recency 20%. Top-matched comps best support the ARV.
Projected returns pro-forma
-3.0% appreciation · 4.13% rent growth · sell at horizon
- IRR
- -13.5%
- Equity multiple
- 0.51×
- Total profit
- $-40,868
- Equity at exit
- $44,388
- IRR
- -2.9%
- Equity multiple
- 0.80×
- Total profit
- $-16,982
- Equity at exit
- $25,739
Cash invested: $83,355 (down + closing). Projections, not guarantees.
Landlord ↔ Tenant lean methodology
- Overall (STATE)
- 87 Strongly Landlord-Friendly
- State Florida
- 87 Strongly Landlord-Friendly · R+3
- County
- — inherits STATE
- City
- — inherits STATE
ZIP-level market 33982
- Home prices YoY
- -1.2%
- Rents YoY
- 4.1%
- Active inventory
- 1037
- Price-to-rent
- 9.2×
Monthly cashflow live
- Estimated rent
- $2,688 medium interval (Pro) →
- Mortgage (P&I)
- −$1,561
- Tax est. 1.5%
- −$372 /mo · $4,465/yr
- Insurance
- −$124
- HOA
- −$0
- Vacancy / Maint / Mgmt
- −$565
- Net cashflow
- $67
Break-even live
Sensitivity live
| Price | -10% $272 | -5% $169 | +0% $67 | +5% $-36 | +10% $-139 |
|---|---|---|---|---|---|
| Rent | -10% $-146 | -5% $-40 | +0% $67 | +5% $173 | +10% $279 |
| Rate | -1.0pp $217 | -0.5pp $142 | base $67 | +0.5pp $-11 | +1.0pp $-89 |
UW: 25.0% down · 7.5% · 30yr · 1.5% tax · 5.0% vac · 8.0% maint · 8.0% mgmt
Financing live
Cash to close
- Down payment
- $74,424
- Closing costs
- $8,931
- Reserves months
- —
- Total cash needed
- —
Loan-product check · same deal, 3 products live
Conventional
25% down · 7.5% · 30yr
- Down + closing
- —
- Monthly P&I
- —
- Monthly cashflow
- —
- DSCR
- —
- Eligible?
- —
Personal DTI + credit; lowest rate.
DSCR
20% down · 8.5% · 30yr
- Down + closing
- —
- Monthly P&I
- —
- Monthly cashflow
- —
- DSCR
- —
- Eligible?
- —
No personal income docs; deal must DSCR.
Hard money
10% down · 12.0% · 12mo
- Down + closing
- —
- Monthly P&I
- —
- Monthly cashflow
- —
- DSCR
- —
- Eligible?
- —
Short-term bridge; refi at stabilization.
Rent comps 38 comps
| Address | Beds | Baths | Sqft | Rent | $/sqft | DOM | Units | Dist |
|---|---|---|---|---|---|---|---|---|
| 44304 Caraton Ter Punta Gorda, FL | 3.0 | 2.5 | 1879 | $2,000 | $1.06 | 22d | 1 | 0.07mi |
| 14923 Anchorage Rd Punta Gorda, FL | 3.0 | 2.0 | 1417 | $2,200 | $1.55 | 22d | 1 | 0.13mi |
| 44076 Bellamy Pl Punta Gorda, FL | 3.0 | 2.5 | 1879 | $2,500 | $1.33 | 22d | 1 | 0.28mi |
| 44481 Mesquite Ln Punta Gorda, FL | 3.0 | 2.0 | 2246 | $6,000 | $2.67 | 22d | 1 | 0.36mi |
| 15048 Pinehurst Ln Punta Gorda, FL | 3.0 | 3.0 | 2247 | $10,000 | $4.45 | 22d | 1 | 0.43mi |
| 15265 Green Acres Ave Unit 228 Punta Gorda, FL | 2.0 | 2.0 | 1569 | $5,500 | $3.51 | 14d | 1 | 0.55mi |
| 15265 Green Acres Ave Unit 228 Punta Gorda, FL | 2.0 | 2.0 | 1569 | $5,000 | $3.19 | 22d | 1 | 0.55mi |
| 15170 Bluffton Ln Unit 1821 Punta Gorda, FL | 3.0 | 2.0 | 2110 | $6,500 | $3.08 | 14d | 1 | 0.56mi |
| 15158 Bluffton Ln #2022 Punta Gorda, FL | 3.0 | 2.0 | 2200 | $7,000 | $3.18 | 22d | 1 | 0.56mi |
| 15194 Bluffton Ln #1422 Punta Gorda, FL | 3.0 | 2.0 | 2110 | $6,300 | $2.99 | 14d | 1 | 0.57mi |
| 15175 Bluffton Ln Unit 724 Punta Gorda, FL | 2.0 | 2.0 | 1366 | $3,000 | $2.20 | 22d | 1 | 0.59mi |
| 15275 Green Acres Ave #338 Punta Gorda, FL | 3.0 | 2.0 | 1301 | $4,795 | $3.69 | 22d | 1 | 0.59mi |
| 15195 Pinehurst Ln Unit 925 Punta Gorda, FL | 2.0 | 2.0 | 1366 | $6,000 | $4.39 | 22d | 1 | 0.60mi |
| 15195 Pinehurst Ln Unit 917 Punta Gorda, FL | 2.0 | 2.0 | 1355 | $5,500 | $4.06 | 22d | 1 | 0.60mi |
| 15175 Pinehurst Ln Unit 724 Punta Gorda, FL | 2.0 | 2.0 | 1366 | $5,000 | $3.66 | 22d | 1 | 0.60mi |
| 15222 Jadestone Dr Punta Gorda, FL | 3.0 | 3.0 | 2444 | $3,400 | $1.39 | 22d | 1 | 0.61mi |
| 15375 Green Acres Ave #2211 Punta Gorda, FL | 3.0 | 2.0 | 1301 | $2,295 | $1.76 | 22d | 1 | 0.68mi |
| 15345 Green Acres Ave #2111 Punta Gorda, FL | 3.0 | 2.0 | 1301 | $4,795 | $3.69 | 22d | 1 | 0.69mi |
| 15405 Green Acres Ave #2331 Punta Gorda, FL | 3.0 | 2.0 | 1301 | $5,500 | $4.23 | 22d | 1 | 0.82mi |
| 43330 Water Bird Way #6911 Punta Gorda, FL | 3.0 | 2.0 | 1741 | $8,800 | $5.05 | 22d | 1 | 1.14mi |
| 15907 Sugar Hill Dr Unit 15907 Punta Gorda, FL | 3.0 | 3.0 | 2247 | $9,500 | $4.23 | 22d | 1 | 1.16mi |
| 15903 Grassland Ln #4411 Punta Gorda, FL | 3.0 | 2.0 | 1741 | $7,500 | $4.31 | 22d | 1 | 1.21mi |
| 43270 Boardwalk Loop Punta Gorda, FL | 3.0 | 3.0 | 2247 | $10,000 | $4.45 | 22d | 1 | 1.22mi |
| 15919 Grassland Ln #4211 Punta Gorda, FL | 3.0 | 2.0 | 1741 | $8,800 | $5.05 | 22d | 1 | 1.22mi |
| 15940 Grassland Ln #2526 Punta Gorda, FL | 2.0 | 2.0 | 1569 | $3,000 | $1.91 | 22d | 1 | 1.25mi |
| 15943 Grassland Ln #3912 Punta Gorda, FL | 3.0 | 2.0 | 1741 | $8,800 | $5.05 | 22d | 1 | 1.25mi |
| 15930 Grassland Ln #2412 Punta Gorda, FL | 2.0 | 2.0 | 1355 | $6,600 | $4.87 | 22d | 1 | 1.26mi |
| 15951 Grassland Ln #3821 Punta Gorda, FL | 2.0 | 2.0 | 2110 | $8,800 | $4.17 | 22d | 1 | 1.26mi |
| 43253 Water Bird Way #5811 Punta Gorda, FL | 3.0 | 2.0 | 1741 | $5,500 | $3.16 | 22d | 1 | 1.26mi |
| 15960 Grassland Ln #2713 Punta Gorda, FL | 2.0 | 2.0 | 1569 | $7,500 | $4.78 | 22d | 1 | 1.28mi |
| 15960 Grassland Ln #2727 Punta Gorda, FL | 2.0 | 2.0 | 1422 | $6,000 | $4.22 | 22d | 1 | 1.28mi |
| 15960 Grassland Ln #2721 Punta Gorda, FL | 2.0 | 2.0 | 1569 | $5,500 | $3.51 | 22d | 1 | 1.28mi |
| 15960 Grassland Ln #2714 Punta Gorda, FL | 2.0 | 2.0 | 1366 | $2,800 | $2.05 | 22d | 1 | 1.28mi |
| 16000 Grassland Ln #3127 Punta Gorda, FL | 2.0 | 2.0 | 1355 | $6,000 | $4.43 | 22d | 1 | 1.40mi |
| 43985 Boardwalk Loop #2138 Punta Gorda, FL | 3.0 | 2.0 | 1301 | $1,975 | $1.52 | 22d | 1 | 1.40mi |
| 43984 Boardwalk Loop #1717 Punta Gorda, FL | 2.0 | 2.0 | 1355 | $7,500 | $5.54 | 22d | 1 | 1.43mi |
| 43989 Boardwalk Loop #2028 Punta Gorda, FL | 3.0 | 2.0 | 1301 | $5,500 | $4.23 | 22d | 1 | 1.44mi |
| 43080 Boardwalk Loop Punta Gorda, FL | 2.0 | 2.5 | 1850 | $11,000 | $5.95 | 22d | 1 | 1.45mi |
Listing history 2 events
-
2026-06-16remarks 270-char remark
-
2026-06-16$297,698 Active 1 DOM
ⓘ Source: listings_history table (triggers on properties + properties_extension) + one-shot
backfill from property_details.listing_events for pre-trigger history.
Nearby sold comps map
Loading sold comps map…
Walkable amenities ~0.75 mi
Loading nearby amenities…
Taxation est. · year 1
- Rental income
- $32,262
- − Mortgage interest
- −$16,676
- − Property taxes
- −$4,465
- − Insurance
- −$1,488
- − Repairs & maintenance
- −$2,581
- − Management
- −$2,581
- − Depreciation
- −$8,660
- Taxable loss
- −$4,190
- Est. tax savings @ 24.0%
- +$1,006
- After-tax cash flow
- $1,805/yr
For passive investors: Depreciation is non-cash, so a rental often shows a tax loss while cash-flowing — sheltering income. Rental losses are passive: they offset passive income freely, and up to $25,000/yr can offset ordinary (W-2) income if you actively participate and your MAGI is under $100k (phasing out to $0 by $150k); unused losses carry forward. On sale, claimed depreciation is recaptured at up to 25%, and gains may owe capital-gains tax (a 1031 exchange can defer both). Figures are a year-1 estimate at your 24.0% rate — not tax advice; consult a CPA.
Schools (NCES district)
- District
- Charlotte
- NCES district ID
- 1200240
- Math proficiency
- 54% ▼ -6.00%
- Reading proficiency
- 54% ▼ -1.00%
- Median HH income
- $44,864
- Composite
- 45.62/100
- National rank
- #2586
- State rank
- #22 of 73 in FL
Livability — North Fort Myers
- Score
- 74/100
- State rank
- #269
- US rank
- #4409
Category grades
Schools grade is shown separately in the Schools card above.
Census & demographics
- County
- Charlotte County · 196,994 people
- City population
- 57,035
- Metro
- Punta Gorda, FL
- Population (ZIP)
- 13,006
- Household income
- $72,443
- Rent vs Own
- Severe rent burden
- 43.0
Population outlook (Charlotte County) Hauer SSP2
- Today (2025)
- 198,646 people
- By 2030
- 210,507 · +6.0%
- By 2040
- 230,857 · +16.2%
- By 2050
- 247,148 · +24.4%
- By 2075
- 281,777 · +41.8%
- By 2100
- 293,609 · +47.8%
Race, ethnicity, and origin ACS 2023
- Neighborhood character
- Predominantly White (81%)
- Race & ethnicity
- White 81% Two or more races 8% Hispanic / Latino 7% Black 7%
- Hispanic origin (detail)
- Puerto Rican 2% Cuban 3%
- Common ancestry
- Lithuanian 3% Iranian 3% Slovak 3%
- Foreign-born
- 6% · Canada, Jamaica
- Languages at home
- 93% English-only · Spanish 5% German/W. Germanic 1% Arabic 1%
Political lean MEDSL · Charlotte
- 2024 margin
- Solid R (+34.0) · D 32.7% · R 66.7%
- 2008→2024 swing
- -26.7pp toward R · 2008: -7.2pp · 2024: -34.0pp
- All cycles
- 2024: R+34.0 2020: R+26.6 2016: R+27.8 2012: R+14.3 2008: R+7.2
Not yet ingested
- Civics
- —
Market trends
- HPI YoY
- ▼ -5.25%
- Current HPI
- 448.5895
- Rent YoY
- ▲ 4.13%
- Metro
- Punta Gorda, FL
- State GDP YoY
- ▲ 3.28%
- F500 in state
- 36
Industry mix (Fortune 500 HQ in FL)
| Industry | F500 HQs | Revenue |
|---|---|---|
| Industrial Technology | 2 | $29B |
|
||
| Insurance | 2 | $17B |
|
||
| Retail | 1 | $60B |
|
||
| Technology Distribution | 1 | $58B |
|
||
| Homebuilding | 1 | $35B |
|
||
| Technology Manufacturing | 1 | $35B |
|
||
Cash-flow waterfall
monthlySold comps — $/sqft
last 12 mo · ≤1 miLoading sold comps…