312 Feldspar Ln · Marble Falls, TX
Flood risk No data
- FEMA flood zone
- —
- Chance of flooding over 30 yrs
- —
- Est. flood insurance / yr
- —
Fire risk No data
- Est. fire insurance / yr
- —
Heat risk No data
- Hot days now (above threshold)
- —
- Hot days in 30 yrs
- —
Wind risk No data
- Chance of severe wind over 30 yrs
- —
Air-quality risk No data
- Unhealthy air days now
- —
- Unhealthy air days in 30 yrs
- —
Risk factors via First Street. Map © Google.
Why this score? — see what drove the D- grade
The composite is a weighted blend of 9 inputs, each scored 0–100. Each bar is that input's sub-score; the figure is the points it added to the 100-point composite (weight × sub-score).
- Cash flow +12.1/30.0
- Condition / age +4.8/5.0
- ARV discount +4.4/15.0
- 1% rule +3.6/10.0
- DSCR +3.6/10.0
- Livability +3.5/5.0
- Schools +3.0/10.0
- Rent growth +2.3/5.0
- Appreciation +0.0/10.0
$272,990
🖨 Deal sheet 📄 Offer letter ✓ Due diligence
Listing remarks
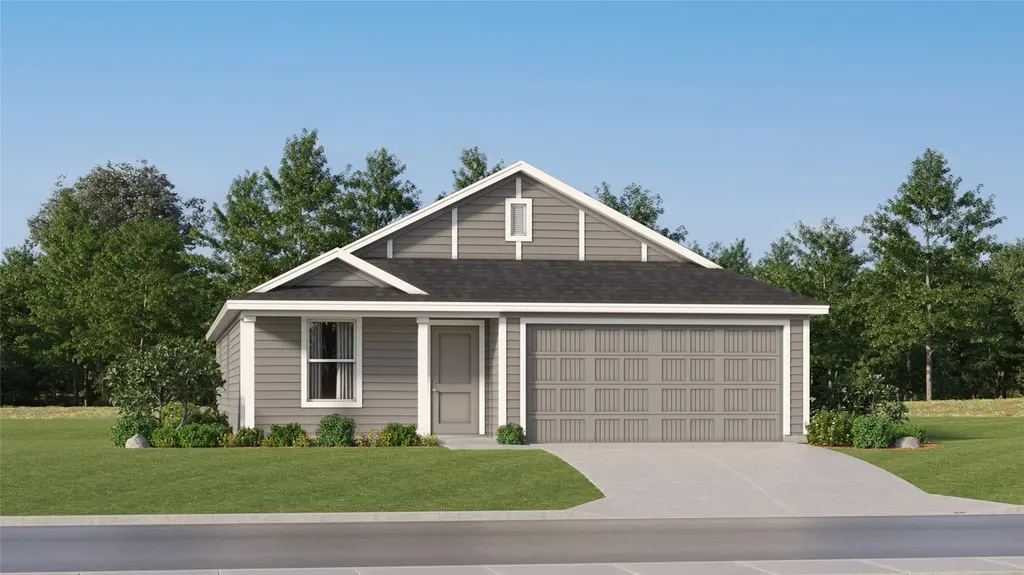
The Oxford - This single-level home features a modern layout perfect for a variety of lifestyles. Three secondary bedrooms are located off the entry, leading to an open-concept floorplan combining the kitchen with the living and dining areas. The luxurious owner’s suite is tucked into a private back corner, offering access to a spa-inspired bathroom and roomy walk-in closet. Photos are for illustrative purposes only. Estimated Completion September 2026. The completion date, prices and features may vary and are subject to change. Please verify with Lennar directly.
Key facts
- 7,405 sq ft lot
- 2 garage spots
- Built 2026
Property features AI
Finance
- HOA & community: Homeowners association (Thunder Rock HOA) with a $25 monthly fee; Association fee covers common area maintenance; Community trails/paths
Exterior
- Parking: Attached 2-car garage; Two covered parking spaces
- Utilities: Electricity available; Public water; Public sewer (connected)
- Home design: Single-story home; Faces southwest; Under construction
- Construction: Built by Lennar; Brick, cement siding and stone exterior; Composition roof; Slab foundation
- Exterior features: Private yard; No exterior steps; Front porch; Back yard with privacy fencing; Front yard; Interior lot
Interior
- Kitchen: Dishwasher; Range
- Bedrooms: Four main-level bedrooms
- Flooring: Carpet; Vinyl
- Bathrooms: Two full bathrooms
- Heating & cooling: Central heating; Central air conditioning
- Interior features: Entrance foyer; Open floor plan; Walk-in closet(s); Main level primary
- Laundry & utility: Main-level laundry room
Neighborhood map
What this means for you Summary
Snapshot
- This is a 4-bed/2.0-bath single-family listed at $273k. Condition is rated excellent.
Deal economics
- At list price, monthly cash flow is $-58 ($-700/yr) — negative.
- To cash-flow at today's rent, offer at most $265k (3.1% below list).
- To meet the 1% rule (rent ≥ 1% of price), the offer needs to be $235k (14.1% below list).
- Recommended offer: $235k (14.1% below list) — sets the bar for 1% rule.
- Cap rate 6.0% vs local median 2.7% in Marble Falls — top-decile yield for the area; either an underpriced asset or a hidden risk that comps aren't pricing in. Stress-test before assuming the spread holds.
Location & tenants
- Location reads 70/100 on livability (#367 in TX) — a middle-class / working-renter tenant base. Strengths: cost of living A+, health & safety A+, housing A; Watch: crime C-, schools D, employment D.
- Marble Falls ISD (town): math 32% / reading 38% proficiency, ranked #511 of 826 in TX (top 62%) — families likely to look elsewhere, expect single-tenant / working-renter base with shorter leases.
- Market conditions: Rents soft (-0.6%/yr); 752 active listings in the ZIP; 2 comparable units currently listed for rent nearby; 891 units permitted in Burnet County in 2024 (76 in 5+ unit buildings).
- This rent runs 38% of the median local income ($74k/yr) — at the standard rent-burdened threshold; future hikes will face affordability resistance.
Forward outlook
- Local home prices are declining (-3.0%/yr); year-one equity from $2k of loan paydown is wiped out by about $8k of value loss. Plan a longer hold.
- Burnet County population projected at +22% by 2050 — long-run rental-demand tailwind backs the buy-and-hold thesis.
Negotiation context
- Only 7 days on market — expect competitive offers; lowballing is unlikely to land.
Questions for the listing agent
- What do current leases actually rent for vs. the listed asking? Can we see a recent rent roll and the last 12 months of T-12 income?
- What does the HOA fee cover, when was the last increase, and are there any pending special assessments or reserve-fund shortfalls?
- Is there a deadline driving the sale (1031 exchange, divorce, estate, relocation)? That informs how much negotiation room exists.
- Schools are D-rated, which usually means shorter tenancies and higher turnover. Who's the typical renter profile here, and what's been the actual vacancy rate?
- The area grade is low — what's the realistic commute time and amenity access for the typical tenant pool here? Any planned neighborhood developments (good or bad) we should know about?
- What's the average days-on-market for RENTAL listings here right now (not sales)? A rising rental-DOM trend means longer vacancies and softer asking-rent achievability than the comps imply.
- What's the recent tenant-quality profile in this submarket — average credit score on applications, eviction rate, late-payment / NSF rate, and stable-employment percentage? A property-management company in the area should have these aggregated.
- How much new for-sale + rental construction is in the pipeline within 1–3 miles? Heavy new supply typically softens prices + rents 12–24 months out; constrained supply supports both.
Investment metrics
- 1% rule
- 0.86% ✗
- Cap rate
- 6.04%
- Cash-on-cash
- -0.92%
- DSCR
- 0.96
- GRM
- 9.7
CMA / ARV
- ARV (on-the-fly)
- $255,200
- Comps found
- 12
Show comp detail 12 sales within ~0.75 mi
| Address | Dist | Beds/Ba | Sqft | Sold | Price | $/sf | Match |
|---|---|---|---|---|---|---|---|
| 117 Cascade Falls Ln | 0.27mi | 4/2.0 | 1,760 (0%) | 2mo | $250,990 | $143 | 86 |
| 268 Rock Springs Dr | 0.30mi | 4/2.0 | 1,720 (-2%) | 4mo | $245,990 | $143 | 79 |
| 121 Southridge Trl | 0.21mi | 3/2.0 (-1) | 1,635 (-7%) | 3mo | $325,990 | $199 | 71 |
| 300 Rock Springs Dr | 0.33mi | 4/2.0 | 1,900 (+8%) | 3mo | $275,999 | $145 | 69 |
| 244 Rock Springs Dr | 0.25mi | 4/2.5 | 1,968 (+12%) | 3mo | $263,990 | $134 | 64 |
| 105 Southridge Trl | 0.26mi | 3/2.0 (-1) | 1,949 (+11%) | 2mo | $292,999 | $150 | 64 |
| 104 Southridge Trl | 0.26mi | 3/2.0 (-1) | 1,949 (+11%) | 2mo | $311,999 | $160 | 63 |
| 248 Rock Springs Dr | 0.26mi | 3/2.0 (-1) | 1,949 (+11%) | 2mo | $284,999 | $146 | 63 |
| 109 Cascade Falls Ln | 0.29mi | 3/2.0 (-1) | 1,949 (+11%) | 1mo | $281,999 | $145 | 63 |
| 260 Rock Springs Dr | 0.29mi | 4/2.5 | 1,968 (+12%) | 4mo | $258,990 | $132 | 62 |
| 272 Rock Springs Dr | 0.31mi | 3/2.0 (-1) | 1,949 (+11%) | 3mo | $279,999 | $144 | 61 |
| 304 Rock Springs Dr | 0.34mi | 4/2.5 | 1,968 (+12%) | 3mo | $256,990 | $131 | 60 |
Match score weights: distance 35% · size 25% · config 20% · recency 20%. Top-matched comps best support the ARV.
Projected returns pro-forma
-3.0% appreciation · 0.0% rent growth · sell at horizon
- IRR
- -21.3%
- Equity multiple
- 0.28×
- Total profit
- $-54,774
- Equity at exit
- $40,704
- IRR
- -24.1%
- Equity multiple
- -0.03×
- Total profit
- $-78,840
- Equity at exit
- $23,603
Cash invested: $76,437 (down + closing). Projections, not guarantees.
Landlord ↔ Tenant lean methodology
- Overall (STATE)
- 87 Strongly Landlord-Friendly
- State Texas
- 87 Strongly Landlord-Friendly · R+5
- County
- — inherits STATE
- City
- — inherits STATE
ZIP-level market 78654
- Home prices YoY
- -31.8%
- Rents YoY
- -0.6%
- Active inventory
- 752
- Price-to-rent
- 9.7×
Monthly cashflow live
- Estimated rent
- $2,346 medium interval (Pro) →
- Mortgage (P&I)
- −$1,432
- Tax est. 1.5%
- −$341 /mo · $4,095/yr
- Insurance
- −$114
- HOA
- −$25
- Vacancy / Maint / Mgmt
- −$493
- Net cashflow
- $-58
Break-even live
UW: 25.0% down · 7.5% · 30yr · 1.5% tax · 5.0% vac · 8.0% maint · 8.0% mgmt
Financing live
Cash to close
- Down payment
- $68,248
- Closing costs
- $8,190
- Reserves months
- —
- Total cash needed
- —
Loan-product check · same deal, 3 products live
Conventional
25% down · 7.5% · 30yr
- Down + closing
- —
- Monthly P&I
- —
- Monthly cashflow
- —
- DSCR
- —
- Eligible?
- —
Personal DTI + credit; lowest rate.
DSCR
20% down · 8.5% · 30yr
- Down + closing
- —
- Monthly P&I
- —
- Monthly cashflow
- —
- DSCR
- —
- Eligible?
- —
No personal income docs; deal must DSCR.
Hard money
10% down · 12.0% · 12mo
- Down + closing
- —
- Monthly P&I
- —
- Monthly cashflow
- —
- DSCR
- —
- Eligible?
- —
Short-term bridge; refi at stabilization.
Rent comps 2 comps
| Address | Beds | Baths | Sqft | Rent | $/sqft | DOM | Units | Dist |
|---|---|---|---|---|---|---|---|---|
| 252 Rock Springs Dr Marble Falls, TX | 4.0 | 2.0 | 1666 | $2,300 | $1.38 | 43d | 1 | 0.28mi |
| 169 Standing Rock Ln Marble Falls, TX | 4.0 | 3.0 | 2525 | $2,750 | $1.09 | 4d | 1 | 0.51mi |
HOA detail
- Monthly dues
- $25 · $300/yr
Listing history 7 events
-
2026-06-18days on market $272,990 Active 7 DOM
-
2026-06-17days on market $272,990 Active 6 DOM
-
2026-06-16days on market $272,990 Active 5 DOM
-
2026-06-15days on market $272,990 Active 4 DOM
-
2026-06-13days on market $272,990 Active 2 DOM
-
2026-06-13remarks 570-char remark
-
2026-06-13$272,990 Active 1 DOM
ⓘ Source: listings_history table (triggers on properties + properties_extension) + one-shot
backfill from property_details.listing_events for pre-trigger history.
Nearby sold comps map
Loading sold comps map…
Walkable amenities ~0.75 mi
Loading nearby amenities…
Taxation est. · year 1
- Rental income
- $28,151
- − Mortgage interest
- −$15,292
- − Property taxes
- −$4,095
- − Insurance
- −$1,365
- − Repairs & maintenance
- −$2,252
- − Management
- −$2,252
- − HOA
- −$300
- − Depreciation
- −$7,942
- Taxable loss
- −$5,346
- Est. tax savings @ 24.0%
- +$1,283
- After-tax cash flow
- $583/yr
For passive investors: Depreciation is non-cash, so a rental often shows a tax loss while cash-flowing — sheltering income. Rental losses are passive: they offset passive income freely, and up to $25,000/yr can offset ordinary (W-2) income if you actively participate and your MAGI is under $100k (phasing out to $0 by $150k); unused losses carry forward. On sale, claimed depreciation is recaptured at up to 25%, and gains may owe capital-gains tax (a 1031 exchange can defer both). Figures are a year-1 estimate at your 24.0% rate — not tax advice; consult a CPA.
Condition & rehab AI · 12 photos
This single-level home is in excellent condition with modern finishes and a well-maintained exterior. It offers a good return on investment with updates that can further enhance its resale and rental value.
Value-add opportunities
- Both Painting the exterior and interior walls — Fresh paint can enhance curb appeal and interior aesthetics.
- Both Updating the flooring in the kitchen and bathrooms — Modern flooring can improve the overall look and feel of the home.
- Both Upgrading the kitchen appliances — New appliances can increase the home's appeal and functionality.
- Both Adding smart home features — Smart home technology can increase convenience and add value to the home.
- Both Landscaping improvements — Enhanced landscaping can improve curb appeal and add value to the home.
Renovation cost estimate screening
Value-add ROI direction
- Both Painting the exterior and interior walls — Fresh paint can enhance curb appeal and interior aesthetics. ↑
- Both Updating the flooring in the kitchen and bathrooms — Modern flooring can improve the overall look and feel of the home. ↑
- Both Upgrading the kitchen appliances — New appliances can increase the home's appeal and functionality. ↑
- Both Adding smart home features — Smart home technology can increase convenience and add value to the home. ↑
- Both Landscaping improvements — Enhanced landscaping can improve curb appeal and add value to the home. ↑
ⓘ Cost ranges are severity-bucket heuristics (US national rule-of-thumb). Get contractor quotes + a written scope before underwriting a rehab budget.
Schools (NCES district)
- District
- Marble Falls ISD
- NCES district ID
- 4829010
- Math proficiency
- 32% ▼ -8.00%
- Reading proficiency
- 38% ▼ -4.00%
- Median HH income
- $49,663
- Composite
- 30.3/100
- National rank
- #6278
- State rank
- #511 of 826 in TX
Livability — Marble Falls
- Score
- 70/100
- State rank
- #367
- US rank
- #7802
Category grades
Schools grade is shown separately in the Schools card above.
Census & demographics
- Census place
- Marble Falls, TX
- County
- Burnet County · 35,210 people
- City population
- 20,650
- Metro
- Austin-Round Rock-Georgetown, TX
- Population (ZIP)
- 20,650
- Household income
- $74,130
- Rent vs Own
- Severe rent burden
- 354.0
Population outlook (Burnet County) Hauer SSP2
- Today (2025)
- 50,492 people
- By 2030
- 52,995 · +5.0%
- By 2040
- 57,528 · +13.9%
- By 2050
- 61,444 · +21.7%
- By 2075
- 71,098 · +40.8%
- By 2100
- 74,634 · +47.8%
Race, ethnicity, and origin ACS 2023
- Neighborhood character
- Predominantly White (68%)
- Race & ethnicity
- White 68% Hispanic / Latino 28% Two or more races 8%
- Hispanic origin (detail)
- Mexican 24%
- Common ancestry
- Serbian 2% Italian 2% Slovak 2%
- Foreign-born
- 8% · Canada
- Languages at home
- 81% English-only · Spanish 18% Other Indo-European 1%
Political lean MEDSL · Burnet
- 2024 margin
- Solid R (+55.7) · D 21.7% · R 77.4%
- 2008→2024 swing
- -11.6pp toward R · 2008: -44.1pp · 2024: -55.7pp
- All cycles
- 2024: R+55.7 2020: R+53.1 2016: R+56.8 2012: R+54.6 2008: R+44.1
Not yet ingested
- Civics
- —
Market trends
- HPI YoY
- ▼ -118.02%
- Current HPI
- 252.9861
- Rent YoY
- ▼ -0.62%
- Metro
- Austin-Round Rock-Georgetown, TX
- State GDP YoY
- ▲ 3.95%
- F500 in state
- 110
Industry mix (Fortune 500 HQ in TX)
| Industry | F500 HQs | Revenue |
|---|---|---|
| Energy | 16 | $1,198B |
|
||
| Technology | 5 | $198B |
|
||
| Engineering / Construction | 4 | $72B |
|
||
| Energy Services | 3 | $60B |
|
||
| Utilities | 3 | $41B |
|
||
| Healthcare | 2 | $330B |
|
||
Price history
1 event — show timeline
- 2026-06-11 Listed $272,990 Unlock MLS
Cash-flow waterfall
monthlySold comps — $/sqft
last 12 mo · ≤1 miLoading sold comps…