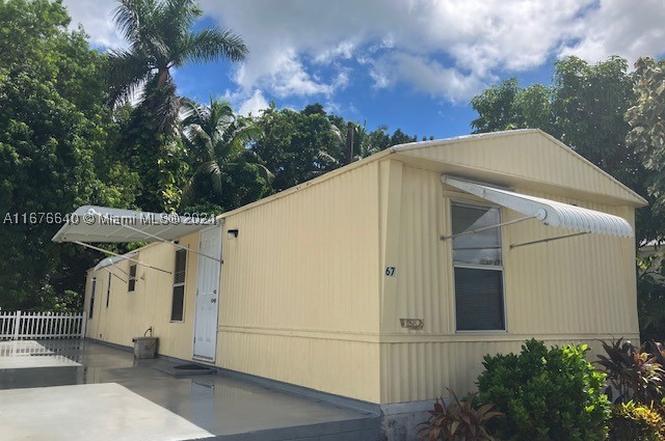
35250 SW 177th Ct 67 · Florida City, FL
Flood risk 6/10 · Moderate
- FEMA flood zone
- AH
- Chance of flooding over 30 yrs
- 0.54%
- Est. flood insurance / yr
- $1,142 – $2,507
Fire risk 2/10 · Minimal
- Est. fire insurance / yr
- $947 – $1,759
Heat risk 10/10 · Severe
- Hot days now (above 108°F)
- 8 days/yr
- Hot days in 30 yrs
- 35 days/yr
Wind risk 10/10 · Severe
- Chance of severe wind over 30 yrs
- 99.0%
Air-quality risk 2/10 · Minimal
- Unhealthy air days now
- 1 days/yr
- Unhealthy air days in 30 yrs
- 1 days/yr
Risk factors via First Street. Map © Google.
Why this score? — see what drove the B- grade
The composite is a weighted blend of 9 inputs, each scored 0–100. Each bar is that input's sub-score; the figure is the points it added to the 100-point composite (weight × sub-score).
- Cash flow +30.0/30.0
- DSCR +10.0/10.0
- 1% rule +9.6/10.0
- ARV discount +7.5/15.0
- Schools +4.2/10.0
- Livability +3.2/5.0
- Condition / age +2.5/5.0
- Rent growth +1.8/5.0
- Appreciation +0.0/10.0
$144,000
🖨 Deal sheet (PDF) 📄 Offer letter ✓ Due diligence
Listing remarks
Priced to sell! Home is neat, clean, and move-in ready. It features a cozy split floor plan with a large outdoor patio and has been well-maintained. There are 2 parking spaces along with a spacious yard. You will own the land, have a low HOA fee, and there are financing options currently available. Do not miss out on this opportunity to own your own home. Please call the agent!
Key facts
- Large patio
- Well maintained
- 4,500 sq ft lot
Tags
Property features AI
Finance
- Other: Lot is less than a quarter acre
- Financial info: Annual tax amount listed
- HOA & community: Monthly association fee of $174 covering common area maintenance, insurance, and recreation facilities; Community clubhouse
Exterior
- Parking: Driveway; Detached garage
- Security: Storm/security shutters
- Utilities: Public water; Public sewer; Electric water heater
- Home design: Manufactured home; Faces west
- Construction: Aluminum roof; Manufactured construction; Manufacturer: Weston (model: Weston); Year built: unknown
- Exterior features: Awning(s); Patio; Storm/security shutters; Community pool
Interior
- Kitchen: Electric range; Refrigerator
- Bedrooms: Bedroom on main level
- Flooring: Hardwood; Wood
- Bathrooms: 2 full bathrooms
- Heating & cooling: Central heating; Electric cooling; Ceiling fans
- Interior features: First-floor entry; Living/dining room; Tub with shower
- Laundry & utility: Laundry room; Utility room; Dryer; Electric water heater
Neighborhood map
What this means for you Summary
Snapshot
- This is a 2-bed/2.0-bath condo listed at $144k.
Deal economics
- At list price, monthly cash flow is $477 ($6k/yr) — positive.
- The deal already cash-flows at list — no discount required.
- Meets the 1% rule at list price ($2k rent vs $144k).
- Recommended offer: $127k (12.0% below list) — sets the bar for market timing.
- Cap rate 11.5% vs local median 4.2% in Florida City — top-decile yield for the area; either an underpriced asset or a hidden risk that comps aren't pricing in. Stress-test before assuming the spread holds.
Location & tenants
- Location reads 65/100 on livability (#654 in FL) — a middle-class / working-renter tenant base. Strengths: commute A+, cost of living A+, housing A+; Watch: schools F, crime F, amenities F.
- Miami-Dade (suburban): math 45% / reading 54% proficiency, ranked #40 of 73 in FL (top 55%) — families likely to look elsewhere, expect single-tenant / working-renter base with shorter leases; 64% free/reduced lunch — lower-income household profile, screen leases tightly.
- Market conditions: Rents soft (-2.9%/yr); 615 active listings in the ZIP; 4 comparable units currently listed for rent nearby; rentals at typical pace (median 19d on market — plan ~3-4 weeks tenant-placement turnaround); 10,051 units permitted in Miami-Dade County in 2024 (7,758 in 5+ unit buildings).
- At $2,098/mo this rent would consume 53% of the median local household income ($47k/yr) (locally 1516% of renters already pay >50% of income on rent) — very limited rent-growth headroom before tenants either downsize or default.
Forward outlook
- Local home prices are declining (-3.0%/yr); year-one equity from $996 of loan paydown is wiped out by about $4k of value loss. Plan a longer hold.
- Miami-Dade County population projected at +28% by 2050 — long-run rental-demand tailwind backs the buy-and-hold thesis.
Negotiation context
- It's been on market 611 days — a 12% lower offer ($127k) is reasonable based on typical stale-listing flexibility.
- 4 sale attempts since 15y ago; this cycle's ask has dropped $45k (24%) from the opening price — seller is motivated, your offer sets the floor, not the list.
- Current owner paid $18k; list at $144k implies a 700% gain — meaningful room to come down on a strong offer.
Risks & watch-outs
- Watch-outs: flood insurance adds $152/mo.
- Climate carrying-cost: in FEMA flood zone AH (mandatory federal flood insurance); severe wind risk, 99% chance of damaging wind over 30y; extreme-heat days projected 8→35/yr by 2055 (HVAC capex compounding) — expect insurance premiums to compound above CPI over the hold.
Questions for the listing agent
- It's been on market 611 days. Have you received any prior offers? Is the seller open to a 12% concession, seller financing, or rate buy-down credit?
- What's the actual annual flood-insurance premium (NFIP or private), and is the property in a SFHA with mandatory coverage?
- What does the HOA fee cover, when was the last increase, and are there any pending special assessments or reserve-fund shortfalls?
- Any open or pending special assessments — roof, HVAC, plumbing, elevator, façade? What's the per-unit balance and payoff schedule, and is the seller paying it off at close or rolling it to the buyer?
- Why hasn't it sold? Are there any deal-killer items the seller is aware of (foundation, flood, title, zoning, code violations)?
- Is there a deadline driving the sale (1031 exchange, divorce, estate, relocation)? That informs how much negotiation room exists.
- Schools are F-rated, which usually means shorter tenancies and higher turnover. Who's the typical renter profile here, and what's been the actual vacancy rate?
- Crime grade is F in this area — have there been break-ins, vandalism, or insurance claims at this property in the last 3 years? What carrier currently insures it and at what premium?
- What's the average days-on-market for RENTAL listings here right now (not sales)? A rising rental-DOM trend means longer vacancies and softer asking-rent achievability than the comps imply.
- What's the recent tenant-quality profile in this submarket — average credit score on applications, eviction rate, late-payment / NSF rate, and stable-employment percentage? A property-management company in the area should have these aggregated.
- How much new apartment / multifamily construction is in the pipeline within 1–3 miles? Heavy new supply (>2% of stock underway) typically softens rents 12–24 months out; light construction supports rent growth.
Investment metrics
- 1% rule
- 1.46% ✓
- Cap rate
- 11.53%
- Cash-on-cash
- 18.71%
- DSCR
- 1.83
- GRM
- 5.7
CMA / ARV
No comps found within radius.
Projected returns pro-forma
-3.0% appreciation · 0.0% rent growth · sell at horizon
- IRR
- 0.7%
- Equity multiple
- 1.03×
- Total profit
- $1,021
- Equity at exit
- $21,471
- IRR
- 6.6%
- Equity multiple
- 1.42×
- Total profit
- $16,810
- Equity at exit
- $12,450
Cash invested: $40,320 (down + closing). Projections, not guarantees.
Landlord ↔ Tenant lean methodology
- Overall (STATE)
- 87 Strongly Landlord-Friendly
- State Florida
- 87 Strongly Landlord-Friendly · R+3
- County
- — inherits STATE
- City
- — inherits STATE
ZIP-level market 33034
- Home prices YoY
- -5.9%
- Rents YoY
- -2.9%
- Active inventory
- 615
- Price-to-rent
- 5.7×
Monthly cashflow live
- Estimated rent
- $2,098 medium interval (Pro) →
- Mortgage (P&I)
- −$755
- Tax from tax record
- −$40 /mo · $475/yr
- Insurance
- −$60
- Flood insurance flood zone
- −$152 /mo · $1,824/yr
- HOA
- −$174
- Vacancy / Maint / Mgmt
- −$441
- Net cashflow
- $477
Break-even live
Sensitivity live
| Price | -10% $558 | -5% $517 | +0% $477 | +5% $436 | +10% $395 |
|---|---|---|---|---|---|
| Rent | -10% $311 | -5% $394 | +0% $477 | +5% $560 | +10% $642 |
| Rate | -1.0pp $549 | -0.5pp $513 | base $477 | +0.5pp $439 | +1.0pp $401 |
UW: 25.0% down · 7.5% · 30yr · 1.5% tax · 5.0% vac · 8.0% maint · 8.0% mgmt
Financing live
Cash to close
- Down payment
- $36,000
- Closing costs
- $4,320
- Reserves months
- —
- Total cash needed
- —
Loan-product check · same deal, 3 products live
Conventional
25% down · 7.5% · 30yr
- Down + closing
- —
- Monthly P&I
- —
- Monthly cashflow
- —
- DSCR
- —
- Eligible?
- —
Personal DTI + credit; lowest rate.
DSCR
20% down · 8.5% · 30yr
- Down + closing
- —
- Monthly P&I
- —
- Monthly cashflow
- —
- DSCR
- —
- Eligible?
- —
No personal income docs; deal must DSCR.
Hard money
10% down · 12.0% · 12mo
- Down + closing
- —
- Monthly P&I
- —
- Monthly cashflow
- —
- DSCR
- —
- Eligible?
- —
Short-term bridge; refi at stabilization.
Rent comps 4 comps
| Address | Beds | Baths | Sqft | Rent | $/sqft | DOM | Units | Dist |
|---|---|---|---|---|---|---|---|---|
| 35250 SW 177th Ct Florida City, FL | 2.0–3.0 | 1.5–2.0 | 780 | $2,000 | $2.56 | 15d | 2 | 0.22mi |
| 343 NW 12th Ave Unit B Florida City, FL | 1.0 | 1.0 | 700 | $800 | $1.14 | 25d | 1 | 1.36mi |
| 877 NW 10th St Florida City, FL | 2.0 | 1.0 | 650 | $1,900 | $2.92 | 19d | 1 | 1.45mi |
| 877 NW 10th St Florida City, FL | 2.0 | 1.0 | 650 | $1,900 | $2.92 | 18d | 1 | 1.45mi |
HOA detail condo
- Monthly dues
- $174 · $2,088/yr
- Assessments
- None detected in remarks — confirm with the listing agent.
Listing history 29 events
-
2026-06-18days on market $144,000 Active 611 DOM
-
2026-06-17days on market $144,000 Active 610 DOM
-
2026-06-16days on market $144,000 Active 609 DOM
-
2026-06-15days on market $144,000 Active 608 DOM
-
2026-06-13pricedays on market $144,000 Active 606 DOM
-
2026-06-09days on market $149,000 Active 602 DOM
-
2026-06-08days on market $149,000 Active 601 DOM
-
2026-06-08days on market $149,000 Active 600 DOM
-
2026-06-04days on market $149,000 Active 597 DOM
-
2026-06-03days on market $149,000 Active 596 DOM
-
2026-06-02days on market $149,000 Active 595 DOM
-
2026-06-01days on market $149,000 Active 594 DOM
-
2026-05-31days on market $149,000 Active 593 DOM
-
2026-04-22price $149,000
-
2026-03-24price $159,000
-
2026-03-03price $165,000
-
2025-11-23price $169,000
-
2025-10-07price $179,000
-
2025-07-25price $186,000
-
2025-02-15status Active
-
2025-01-12historical Active Under Contract
-
2024-10-14$189,000 Active
-
2014-02-17status Pending
-
2014-01-31price $32,800
-
2013-12-19price $34,900
-
2013-11-25$39,900 Active
-
2011-12-09$34,000
-
1983-03-01soldstatus $18,000
-
1978-03-01soldstatus $20,200
ⓘ Source: listings_history table (triggers on properties + properties_extension) + one-shot
backfill from property_details.listing_events for pre-trigger history.
Tax reassessment forecast FL · Resets to sale price
- Current annual tax
- $475 · $40/mo
- Projected year-2 tax
- $1,195 · $100/mo
- Expected delta
- +$720/yr (+$60/mo · 151.5%)
ⓘ Screening estimate from a state-policy table — verify with the county assessor before closing.
Climate risk First Street
- Flood 6/10 Major FEMA zone AH · 54% chance over 30 yrs
- Wildfire 2/10 Low
- Heat 10/10 Extreme 8 d/yr ≥108°F today · 35 d/yr by 30 yrs out
- Wind 10/10 Extreme 99% chance of damaging wind over 30 yrs
- Air quality 2/10 Low 1 unhealthy d/yr today · 1 by 30 yrs out
Nearby sold comps map
Loading sold comps map…
Walkable amenities ~0.75 mi
Loading nearby amenities…
Taxation est. · year 1
- Rental income
- $25,176
- − Mortgage interest
- −$8,066
- − Property taxes
- −$475
- − Insurance
- −$2,544
- − Repairs & maintenance
- −$2,014
- − Management
- −$2,014
- − HOA
- −$2,088
- − Depreciation
- −$4,189
- Taxable income
- $3,785
- Est. tax owed @ 24.0%
- −$908
- After-tax cash flow
- $4,811/yr
For passive investors: Depreciation is non-cash, so a rental often shows a tax loss while cash-flowing — sheltering income. Rental losses are passive: they offset passive income freely, and up to $25,000/yr can offset ordinary (W-2) income if you actively participate and your MAGI is under $100k (phasing out to $0 by $150k); unused losses carry forward. On sale, claimed depreciation is recaptured at up to 25%, and gains may owe capital-gains tax (a 1031 exchange can defer both). Figures are a year-1 estimate at your 24.0% rate — not tax advice; consult a CPA.
Schools (NCES district)
- District
- Miami-Dade
- NCES district ID
- 1200390
- Math proficiency
- 45% ▼ -16.00%
- Reading proficiency
- 54% ▼ -5.00%
- Median HH income
- $43,928
- Composite
- 41.76/100
- National rank
- #3397
- State rank
- #40 of 73 in FL
Livability — Florida City
- Score
- 65/100
- State rank
- #654
- US rank
- #13036
Category grades
Schools grade is shown separately in the Schools card above.
Census & demographics
- County
- Miami-Dade County · 2,697,751 people
- City population
- 23,823
- Metro
- Miami-Fort Lauderdale-Pompano Beach, FL
- Population (ZIP)
- 23,823
- Household income
- $47,170
- Rent vs Own
- Severe rent burden
- 1516.0
Population outlook (Miami-Dade County) Hauer SSP2
- Today (2025)
- 3,126,439 people
- By 2030
- 3,325,765 · +6.4%
- By 2040
- 3,697,561 · +18.3%
- By 2050
- 4,012,134 · +28.3%
- By 2075
- 4,605,612 · +47.3%
- By 2100
- 4,866,598 · +55.7%
Race, ethnicity, and origin ACS 2023
- Neighborhood character
- Majority Hispanic (62%)
- Race & ethnicity
- Hispanic / Latino 62% Black 28% Two or more races 24% White 8%
- Hispanic origin (detail)
- Mexican 20% Puerto Rican 5% Cuban 13% Dominican 2%
- Common ancestry
- Hispanic 4%
- Foreign-born
- 34% · Canada, Dominican Republic, Guatemala
- Languages at home
- 38% English-only · Spanish 56% French/Haitian/Cajun 5%
Political lean MEDSL · Miami-Dade
- 2024 margin
- R (+11.4) · D 43.9% · R 55.4%
- 2008→2024 swing
- -27.6pp toward R · 2008: 16.1pp · 2024: -11.4pp
- All cycles
- 2024: R+11.4 2020: D+7.3 2016: D+29.6 2012: D+23.7 2008: D+16.1
Not yet ingested
- Civics
- —
Market trends
- HPI YoY
- ▼ -32.64%
- Current HPI
- 521.6856
- Rent YoY
- ▼ -2.85%
- Metro
- Miami-Fort Lauderdale-Pompano Beach, FL
- State GDP YoY
- ▲ 3.28%
- F500 in state
- 36
Industry mix (Fortune 500 HQ in FL)
| Industry | F500 HQs | Revenue |
|---|---|---|
| Industrial Technology | 2 | $29B |
|
||
| Insurance | 2 | $17B |
|
||
| Retail | 1 | $60B |
|
||
| Technology Distribution | 1 | $58B |
|
||
| Homebuilding | 1 | $35B |
|
||
| Technology Manufacturing | 1 | $35B |
|
||
Price history
+637.6% since first listed16 events — show timeline
- 2026-04-22 Price Changed $149,000 MARMLS
- 2026-03-24 Price Changed $159,000 MARMLS
- 2026-03-03 Price Changed $165,000 MARMLS
- 2025-11-23 Price Changed $169,000 MARMLS
- 2025-10-07 Price Changed $179,000 MARMLS
- 2025-07-25 Price Changed $186,000 MARMLS
- 2025-02-15 Relisted — MARMLS
- 2025-01-12 Contingent — MARMLS
- 2024-10-14 Listed $189,000 MARMLS
- 2014-02-17 Pending — MARMLS
- 2014-01-31 Price Changed $32,800 MARMLS
- 2013-12-19 Price Changed $34,900 MARMLS
- 2013-11-25 Listed $39,900 MARMLS
- 2011-12-09 Listed $34,000 MARMLS
- 1983-03-01 Sold (Public Records) $18,000 Public Records
- 1978-03-01 Sold (Public Records) $20,200 Public Records
Property tax history
+21.8%/yrLatest (2025): $475 · +2.3% YoY. Source: county tax records.
Cash-flow waterfall
monthlySold comps — $/sqft
last 12 mo · ≤1 miLoading sold comps…