 🏗️ New Construction
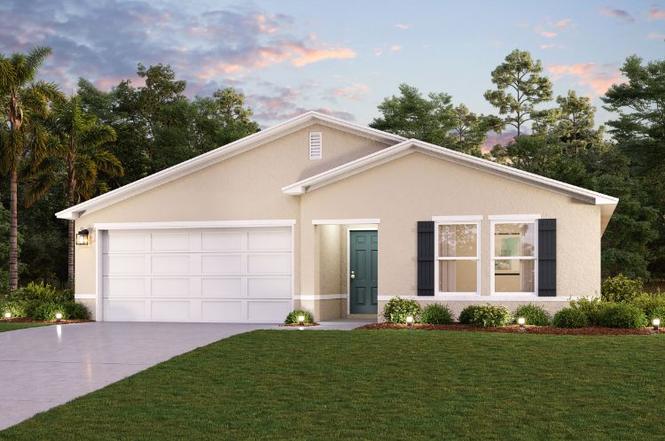
BRASELTON Plan · Palm Bay, FL
Flood risk 4/10 · Minor
- FEMA flood zone
- X (unshaded)
- Chance of flooding over 30 yrs
- 0.2%
- Est. flood insurance / yr
- $507 – $1,088
Fire risk 1/10 · Minimal
- Est. fire insurance / yr
- $947 – $1,759
Heat risk 9/10 · Severe
- Hot days now (above 106°F)
- 7 days/yr
- Hot days in 30 yrs
- 22 days/yr
Wind risk 10/10 · Severe
- Chance of severe wind over 30 yrs
- 99.0%
Air-quality risk 1/10 · Minimal
- Unhealthy air days now
- 0 days/yr
- Unhealthy air days in 30 yrs
- 0 days/yr
Risk factors via First Street. Map © Google.
Why this score? — see what drove the D grade
The composite is a weighted blend of 9 inputs, each scored 0–100. Each bar is that input's sub-score; the figure is the points it added to the 100-point composite (weight × sub-score).
- Appreciation +10.0/10.0
- ARV discount +7.5/15.0
- Cash flow +6.7/30.0
- Schools +4.7/10.0
- Livability +3.6/5.0
- Rent growth +3.4/5.0
- Condition / age +2.5/5.0
- 1% rule +1.7/10.0
- DSCR +1.0/10.0
$329,990
🖨 Deal sheet 📄 Offer letter ✓ Due diligence
Listing remarks
3 bed | 2 bath | 2-bay | 1811 sqft
Key facts
- 2 garage spots
- Listed 111 days
Property features AI
Finance
- Financial info: List price $328,990
Exterior
- Parking: 2 garage spaces; 2 total parking spaces
- Home design: Single-family home (Plan: BRASELTON)
- Exterior features: Living area approximately 1811; Address: 2410 San Filippo Dr, Palm Bay FL 32909
Interior
- Bedrooms: 3 bedrooms
- Bathrooms: 2 full bathrooms
- Interior features: Plan-based new construction (BRASELTON)
Neighborhood map
What this means for you Summary
Snapshot
- This is a 3-bed/2.0-bath single-family listed at $330k.
Deal economics
- At list price, monthly cash flow is $-523 ($-6k/yr) — negative.
- To cash-flow at today's rent, offer at most $254k (22.9% below list).
- To meet the 1% rule (rent ≥ 1% of price), the offer needs to be $223k (32.6% below list).
- Recommended offer: $223k (32.6% below list) — sets the bar for 1% rule.
Location & tenants
- Location reads 72/100 on livability (#366 in FL) — a middle-class / working-renter tenant base. Strengths: cost of living A+, housing A+; Watch: schools C-, employment D+, amenities F.
- Brevard (suburban): math 53% / reading 57% proficiency, ranked #19 of 73 in FL (top 26%) — acceptable for families but not a draw, mixed tenant base, ~2y average lease.
- Market conditions: Rents rising (+3.7%/yr); 1111 active listings in the ZIP; 30 comparable units currently listed for rent nearby; rentals at typical pace (median 24d on market — plan ~3-4 weeks tenant-placement turnaround); solid renter incomes; 4,602 units permitted in Brevard County in 2024 (702 in 5+ unit buildings).
- This rent runs 33% of the median local income ($80k/yr) — at the standard rent-burdened threshold; future hikes will face affordability resistance.
Forward outlook
- In year one you build about $35k of equity ($2k loan paydown + $33k appreciation (10.0% local appreciation)).
- Brevard County population projected at +15% by 2050 — modest demand growth; plan on rents tracking national, not racing it.
- By year 2, paydown + projected appreciation supports a ~$57k cash-out refi (75% LTV) — recoverable capital for the next deal without selling this one.
Negotiation context
- It's been on market 112 days — a 9% lower offer ($300k) is reasonable based on typical stale-listing flexibility.
Risks & watch-outs
- Climate carrying-cost: severe wind risk, 99% chance of damaging wind over 30y; extreme-heat days projected 7→22/yr by 2055 (HVAC capex compounding) — expect insurance premiums to compound above CPI over the hold.
Questions for the listing agent
- What do current leases actually rent for vs. the listed asking? Can we see a recent rent roll and the last 12 months of T-12 income?
- It's been on market 112 days. Have you received any prior offers? Is the seller open to a 33% concession, seller financing, or rate buy-down credit?
- Why hasn't it sold? Are there any deal-killer items the seller is aware of (foundation, flood, title, zoning, code violations)?
- Is there a deadline driving the sale (1031 exchange, divorce, estate, relocation)? That informs how much negotiation room exists.
- The area grade is low — what's the realistic commute time and amenity access for the typical tenant pool here? Any planned neighborhood developments (good or bad) we should know about?
- What's the average days-on-market for RENTAL listings here right now (not sales)? A rising rental-DOM trend means longer vacancies and softer asking-rent achievability than the comps imply.
- What's the recent tenant-quality profile in this submarket — average credit score on applications, eviction rate, late-payment / NSF rate, and stable-employment percentage? A property-management company in the area should have these aggregated.
- How much new for-sale + rental construction is in the pipeline within 1–3 miles? Heavy new supply typically softens prices + rents 12–24 months out; constrained supply supports both.
Investment metrics
- 1% rule
- 0.67% ✗
- Cap rate
- 4.39%
- Cash-on-cash
- -6.79%
- DSCR
- 0.70
- GRM
- 12.4
CMA / ARV
No comps found within radius.
Projected returns pro-forma
10.0% appreciation · 3.67% rent growth · sell at horizon
- IRR
- 19.7%
- Equity multiple
- 2.60×
- Total profit
- $147,973
- Equity at exit
- $297,281
- IRR
- 18.2%
- Equity multiple
- 6.03×
- Total profit
- $465,152
- Equity at exit
- $641,098
Cash invested: $92,397 (down + closing). Projections, not guarantees.
Landlord ↔ Tenant lean methodology
- Overall (STATE)
- 87 Strongly Landlord-Friendly
- State Florida
- 87 Strongly Landlord-Friendly · R+3
- County
- — inherits STATE
- City
- — inherits STATE
ZIP-level market 32909
- Home prices YoY
- 6.0%
- Rents YoY
- 3.7%
- Active inventory
- 1111
- Price-to-rent
- 12.4×
Monthly cashflow live
- Estimated rent
- $2,225 high interval (Pro) →
- Mortgage (P&I)
- −$1,731
- Tax est. 1.5%
- −$412 /mo · $4,950/yr
- Insurance
- −$137
- HOA
- −$0
- Vacancy / Maint / Mgmt
- −$467
- Net cashflow
- $-523
Break-even live
UW: 25.0% down · 7.5% · 30yr · 1.5% tax · 5.0% vac · 8.0% maint · 8.0% mgmt
Financing live
Cash to close
- Down payment
- $82,498
- Closing costs
- $9,900
- Reserves months
- —
- Total cash needed
- —
Loan-product check · same deal, 3 products live
Conventional
25% down · 7.5% · 30yr
- Down + closing
- —
- Monthly P&I
- —
- Monthly cashflow
- —
- DSCR
- —
- Eligible?
- —
Personal DTI + credit; lowest rate.
DSCR
20% down · 8.5% · 30yr
- Down + closing
- —
- Monthly P&I
- —
- Monthly cashflow
- —
- DSCR
- —
- Eligible?
- —
No personal income docs; deal must DSCR.
Hard money
10% down · 12.0% · 12mo
- Down + closing
- —
- Monthly P&I
- —
- Monthly cashflow
- —
- DSCR
- —
- Eligible?
- —
Short-term bridge; refi at stabilization.
Rent comps 30 comps
| Address | Beds | Baths | Sqft | Rent | $/sqft | DOM | Units | Dist |
|---|---|---|---|---|---|---|---|---|
| 2691 Tepee Ave SE Palm Bay, FL | 4.0 | 2.0 | 1833 | $2,040 | $1.11 | 21d | 1 | 0.42mi |
| 830 Painesville St SE Palm Bay, FL | 3.0 | 2.0 | 2029 | $2,220 | $1.09 | 14d | 1 | 0.44mi |
| 1198 Venus St SE Palm Bay, FL | 3.0 | 2.0 | 1535 | $1,961 | $1.28 | 21d | 1 | 0.44mi |
| 555 Gagnon St SE Palm Bay, FL | 4.0 | 3.0 | 2373 | $2,400 | $1.01 | 23d | 1 | 0.67mi |
| 1224 Dillard Dr SE Palm Bay, FL | 3.0 | 2.0 | 1770 | $2,336 | $1.32 | 14d | 1 | 0.67mi |
| 543 Reading St SE Palm Bay, FL | 4.0 | 2.0 | 1833 | $2,010 | $1.10 | 21d | 1 | 0.68mi |
| 590 Trymore Dr SE Palm Bay, FL | 4.0 | 2.0 | 1873 | $2,250 | $1.20 | 14d | 1 | 0.73mi |
| 1165 Rabbit St SE Palm Bay, FL | 3.0 | 2.0 | 1994 | $1,895 | $0.95 | 19d | 1 | 0.73mi |
| 2877 Palisades Dr SE Palm Bay, FL | 3.0 | 2.0 | 1974 | $2,150 | $1.09 | 19d | 1 | 0.77mi |
| 820 Tedder Rd SE Palm Bay, FL | 3.0 | 2.0 | 1808 | $2,000 | $1.11 | 23d | 1 | 0.82mi |
| 486 Dadeville St SE Palm Bay, FL | 4.0 | 2.0 | 1833 | $1,995 | $1.09 | 14d | 1 | 0.90mi |
| 1213 Waterford St SE Palm Bay, FL | 4.0 | 2.0 | 1695 | $2,000 | $1.18 | 23d | 1 | 0.90mi |
| 3004 Suntan Ct SE Palm Bay, FL | 4.0 | 2.0 | 2388 | $2,900 | $1.21 | 23d | 1 | 1.00mi |
| 2749 Freehold Ave SE Palm Bay, FL | 3.0 | 2.0 | 1386 | $1,800 | $1.30 | 23d | 1 | 1.00mi |
| 978 Remington Green Dr SE Palm Bay, FL | 4.0 | 2.0 | 1830 | $2,200 | $1.20 | 23d | 1 | 1.04mi |
| 2785 Gabboys Ave SE Palm Bay, FL | 3.0 | 2.0 | 1475 | $1,849 | $1.25 | 23d | 1 | 1.05mi |
| 1406 Martinez St SE Palm Bay, FL | 4.0 | 2.0 | 2083 | $2,100 | $1.01 | 23d | 1 | 1.09mi |
| 1416 Martinez St SE Palm Bay, FL | 3.0 | 2.0 | 1747 | $2,000 | $1.14 | 14d | 1 | 1.11mi |
| 496 Vanguard St SE Palm Bay, FL | 3.0 | 2.0 | 1666 | $2,150 | $1.29 | 23d | 1 | 1.13mi |
| 1454 Graves St SE Palm Bay, FL | 3.0 | 2.0 | 1621 | $2,100 | $1.30 | 14d | 1 | 1.14mi |
| 2250 Chinaberry Cir SE Palm Bay, FL | 3.0 | 2.0 | 1669 | $1,995 | $1.20 | 23d | 1 | 1.18mi |
| 1063 Grantham Ln SE Palm Bay, FL | 3.0 | 2.0 | 1515 | $2,000 | $1.32 | 23d | 1 | 1.29mi |
| 1046 Grantham Ln SE Palm Bay, FL | 4.0 | 2.5 | 2405 | $3,100 | $1.29 | 23d | 1 | 1.31mi |
| 1453 Santa Anna St SE Palm Bay, FL | 3.0 | 2.0 | 1994 | $2,500 | $1.25 | 14d | 1 | 1.37mi |
| 3247 Halblum Ave SE Palm Bay, FL | 4.0 | 3.0 | 1820 | $2,516 | $1.38 | 13d | 1 | 1.39mi |
| 1496 Dittmer Cir SE Palm Bay, FL | 4.0 | 2.0 | 2187 | $2,440 | $1.12 | 14d | 1 | 1.43mi |
| 2036 Walsh Ave SE Palm Bay, FL | 3.0 | 2.0 | 1331 | $1,930 | $1.45 | 23d | 1 | 1.44mi |
| 291 Foley St SE Palm Bay, FL | 4.0 | 2.0 | 1833 | $2,025 | $1.10 | 13d | 1 | 1.45mi |
| 402 Breckenridge Cir SE Palm Bay, FL | 3.0 | 2.0 | 1960 | $2,200 | $1.12 | 23d | 1 | 1.45mi |
| 160 Dailey St SE Palm Bay, FL | 4.0 | 2.0 | 1795 | $2,275 | $1.27 | 23d | 1 | 1.47mi |
Listing history 13 events
-
2026-06-18days on market $329,990 Active 112 DOM
-
2026-06-17days on market $329,990 Active 111 DOM
-
2026-06-16days on market $329,990 Active 110 DOM
-
2026-06-15days on market $329,990 Active 109 DOM
-
2026-06-14days on market $329,990 Active 107 DOM
-
2026-06-10days on market $329,990 Active 104 DOM
-
2026-06-08days on market $329,990 Active 102 DOM
-
2026-06-07days on market $329,990 Active 101 DOM
-
2026-06-05days on market $329,990 Active 98 DOM
-
2026-06-03days on market $329,990 Active 97 DOM
-
2026-06-02days on market $329,990 Active 96 DOM
-
2026-06-01days on market $329,990 Active 95 DOM
-
2026-05-31days on market $329,990 Active 94 DOM
ⓘ Source: listings_history table (triggers on properties + properties_extension) + one-shot
backfill from property_details.listing_events for pre-trigger history.
Climate risk First Street
- Flood 4/10 Moderate FEMA zone X (unshaded) · 20% chance over 30 yrs
- Wildfire 1/10 Low
- Heat 9/10 Extreme 7 d/yr ≥106°F today · 22 d/yr by 30 yrs out
- Wind 10/10 Extreme 99% chance of damaging wind over 30 yrs
- Air quality 1/10 Low 0 unhealthy d/yr today · 0 by 30 yrs out
Nearby sold comps map
Loading sold comps map…
Walkable amenities ~0.75 mi
Loading nearby amenities…
Taxation est. · year 1
- Rental income
- $26,700
- − Mortgage interest
- −$18,485
- − Property taxes
- −$4,950
- − Insurance
- −$1,650
- − Repairs & maintenance
- −$2,136
- − Management
- −$2,136
- − Depreciation
- −$9,600
- Taxable loss
- −$12,256
- Est. tax savings @ 24.0%
- +$2,941
- After-tax cash flow
- $-3,331/yr
For passive investors: Depreciation is non-cash, so a rental often shows a tax loss while cash-flowing — sheltering income. Rental losses are passive: they offset passive income freely, and up to $25,000/yr can offset ordinary (W-2) income if you actively participate and your MAGI is under $100k (phasing out to $0 by $150k); unused losses carry forward. On sale, claimed depreciation is recaptured at up to 25%, and gains may owe capital-gains tax (a 1031 exchange can defer both). Figures are a year-1 estimate at your 24.0% rate — not tax advice; consult a CPA.
Schools (NCES district)
- District
- Brevard
- NCES district ID
- 1200150
- Math proficiency
- 53% ▼ -9.00%
- Reading proficiency
- 57% ▼ -4.00%
- Median HH income
- $49,426
- Composite
- 46.86/100
- National rank
- #2370
- State rank
- #19 of 73 in FL
Livability — Palm Bay
- Score
- 72/100
- State rank
- #366
- US rank
- #6458
Category grades
Schools grade is shown separately in the Schools card above.
Census & demographics
- Census place
- Palm Bay, FL
- County
- Brevard County · 602,871 people
- City population
- 132,211
- Metro
- Palm Bay-Melbourne-Titusville, FL
- Population (ZIP)
- 41,804
- Household income
- $79,977
- Rent vs Own
- Severe rent burden
- 697.0
Population outlook (Brevard County) Hauer SSP2
- Today (2025)
- 623,254 people
- By 2030
- 648,420 · +4.0%
- By 2040
- 690,009 · +10.7%
- By 2050
- 715,669 · +14.8%
- By 2075
- 775,744 · +24.5%
- By 2100
- 776,687 · +24.6%
Race, ethnicity, and origin ACS 2023
- Neighborhood character
- Diverse neighborhood (Simpson 0.70)
- Race & ethnicity
- White 46% Black 21% Hispanic / Latino 20% Two or more races 16% Asian 4%
- Hispanic origin (detail)
- Mexican 2% Puerto Rican 8% Cuban 5%
- Common ancestry
- Hispanic 3% Slovak 2% Lithuanian 2%
- Foreign-born
- 17% · Canada, China, Jamaica
- Languages at home
- 84% English-only · Spanish 9% French/Haitian/Cajun 4% Chinese 1%
Political lean MEDSL · Brevard
- 2024 margin
- Strong R (+20.8) · D 39.1% · R 59.9% · Other 1.0%
- 2008→2024 swing
- -10.4pp toward R · 2008: -10.4pp · 2024: -20.8pp
- All cycles
- 2024: R+20.8 2020: R+16.4 2016: R+19.8 2012: R+12.7 2008: R+10.4
Not yet ingested
- Civics
- —
Market trends
- HPI YoY
- ▲ 18.81%
- Current HPI
- 330.8595
- Rent YoY
- ▲ 3.67%
- Metro
- Palm Bay-Melbourne-Titusville, FL
- State GDP YoY
- ▲ 3.28%
- F500 in state
- 36
Industry mix (Fortune 500 HQ in FL)
| Industry | F500 HQs | Revenue |
|---|---|---|
| Industrial Technology | 2 | $29B |
|
||
| Insurance | 2 | $17B |
|
||
| Retail | 1 | $60B |
|
||
| Technology Distribution | 1 | $58B |
|
||
| Homebuilding | 1 | $35B |
|
||
| Technology Manufacturing | 1 | $35B |
|
||
Cash-flow waterfall
monthlySold comps — $/sqft
last 12 mo · ≤1 miLoading sold comps…