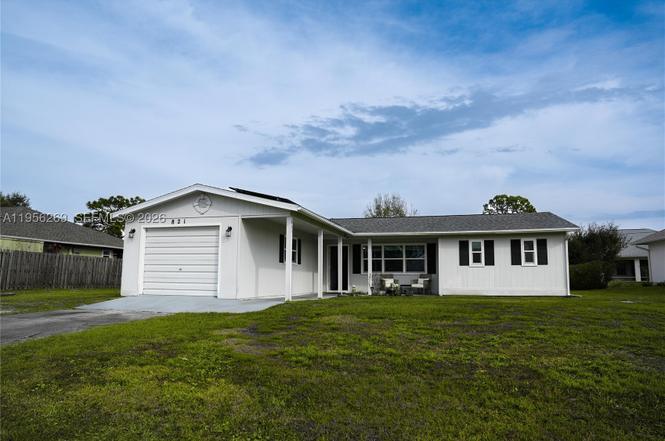
821 Barber St · Sebastian, FL
Flood risk 1/10 · Minimal
- FEMA flood zone
- X (unshaded)
- Chance of flooding over 30 yrs
- 0.0%
- Est. flood insurance / yr
- $507 – $1,088
Fire risk 2/10 · Minimal
- Est. fire insurance / yr
- $947 – $1,759
Heat risk 10/10 · Severe
- Hot days now (above 106°F)
- 7 days/yr
- Hot days in 30 yrs
- 23 days/yr
Wind risk 10/10 · Severe
- Chance of severe wind over 30 yrs
- 99.0%
Air-quality risk 1/10 · Minimal
- Unhealthy air days now
- 0 days/yr
- Unhealthy air days in 30 yrs
- 0 days/yr
Risk factors via First Street. Map © Google.
Why this score? — see what drove the C grade
The composite is a weighted blend of 9 inputs, each scored 0–100. Each bar is that input's sub-score; the figure is the points it added to the 100-point composite (weight × sub-score).
- Cash flow +17.3/30.0
- ARV discount +15.0/15.0
- DSCR +5.4/10.0
- 1% rule +4.6/10.0
- Schools +4.2/10.0
- Rent growth +4.1/5.0
- Livability +4.0/5.0
- Condition / age +2.5/5.0
- Appreciation +0.0/10.0
$280,000
🖨 Deal sheet 📄 Offer letter ✓ Due diligence
Listing remarks MLS
Buyer Incentive! Buyers may receive $2,000 toward closing costs when financing is obtained through our preferred lender. Beautiful Single-Family Home located in a quiet and well-established neighborhood in Sebastian, Florida. This property features 3 spacious bedrooms and 2 full bathrooms, offering a functional and comfortable layout ideal for everyday living. With 1,741 square feet of living space, the home provides well-distributed areas perfect for families or anyone seeking comfort and space. A major highlight of this property is the solar panel system, which helps reduce energy costs and increases overall efficiency, making it both eco-friendly and cost-effective. Home is approximately 4–5 miles from the beach, just a 15-minute drive to the Atlantic Ocean, including popular destinations such as Sebastian Inlet and nearby coastal beaches. This property offers an excellent combination of comfort, energy efficiency, and location, with easy access to shopping, schools, dining, and outdoor recreation. An excellent opportunity to own or invest on Florida’s Treasure Coast.
Key facts
- Solar panel system
- Quiet neighborhood
- 0.23 acre lot
Tags
Property features AI
Exterior
- Parking: 1-car garage; Driveway
- Security: Smoke detectors
- Utilities: Public water; Septic tank
- Home design: Single-story home; Faces north; Slab foundation; Shingle roof; Effective year built
- Construction: Shingle roof; Slab foundation
- Exterior features: Fenced yard; Less than quarter-acre lot
Interior
- Kitchen: Electric range; Microwave; Refrigerator; Water softener (owned)
- Bedrooms: Primary bedroom on main level
- Flooring: Tile
- Bathrooms: 2 full bathrooms
- Heating & cooling: Central heating; Central air conditioning; Has heating and cooling
- Interior features: Eat-in kitchen; First floor entry; Fireplace; Main-level primary bedroom; Den; Laundry room; Utility room
- Laundry & utility: Washer; Dryer; Laundry room; Utility room
Neighborhood map
What this means for you Summary
Snapshot
- This is a 3-bed/2.0-bath single-family listed at $280k.
Deal economics
- At list price, monthly cash flow is $205 ($2k/yr) — positive.
- The deal already cash-flows at list — no discount required.
- To meet the 1% rule (rent ≥ 1% of price), the offer needs to be $270k (3.6% below list).
- Recommended offer: $246k (12.0% below list) — sets the bar for market timing.
- Cap rate 7.2% vs local median 4.4% in Sebastian — top-decile yield for the area; either an underpriced asset or a hidden risk that comps aren't pricing in. Stress-test before assuming the spread holds.
Location & tenants
- Location reads 81/100 on livability (#89 in FL, #1,421 nationally) — a professional / high-income tenant draw. Strengths: housing A+, crime A, health & safety A; Watch: schools D+, amenities D-.
- Indian River (other): math 48% / reading 52% proficiency, ranked #35 of 73 in FL (top 48%) — acceptable for families but not a draw, mixed tenant base, ~2y average lease.
- Market conditions: Rents rising fast (+6.2%/yr); 412 active listings in the ZIP; 19 comparable units currently listed for rent nearby; rentals at typical pace (median 21d on market — plan ~3-4 weeks tenant-placement turnaround); 564 units permitted in Indian River County in 2024 (281 in 5+ unit buildings).
- At $2,700/mo this rent would consume 48% of the median local household income ($67k/yr) (locally 646% of renters already pay >50% of income on rent) — very limited rent-growth headroom before tenants either downsize or default.
Forward outlook
- Local home prices are declining (-3.0%/yr); year-one equity from $2k of loan paydown is wiped out by about $8k of value loss. Plan a longer hold.
- Indian River County population projected at +18% by 2050 — long-run rental-demand tailwind backs the buy-and-hold thesis.
Negotiation context
- It's been on market 140 days — a 12% lower offer ($246k) is reasonable based on typical stale-listing flexibility.
- 7 sale attempts since 6y ago with the ask held roughly flat each time — persistent listings suggest the price (not the market) is what's stuck; bring a comps-based counter.
Risks & watch-outs
- Climate carrying-cost: severe wind risk, 99% chance of damaging wind over 30y; extreme-heat days projected 7→23/yr by 2055 (HVAC capex compounding) — expect insurance premiums to compound above CPI over the hold.
Questions for the listing agent
- It's been on market 140 days. Have you received any prior offers? Is the seller open to a 12% concession, seller financing, or rate buy-down credit?
- Built in 1979 — when were the roof, HVAC, electrical panel, plumbing, and water heater last replaced?
- Why hasn't it sold? Are there any deal-killer items the seller is aware of (foundation, flood, title, zoning, code violations)?
- Is there a deadline driving the sale (1031 exchange, divorce, estate, relocation)? That informs how much negotiation room exists.
- Schools are D-rated, which usually means shorter tenancies and higher turnover. Who's the typical renter profile here, and what's been the actual vacancy rate?
- What's the average days-on-market for RENTAL listings here right now (not sales)? A rising rental-DOM trend means longer vacancies and softer asking-rent achievability than the comps imply.
- What's the recent tenant-quality profile in this submarket — average credit score on applications, eviction rate, late-payment / NSF rate, and stable-employment percentage? A property-management company in the area should have these aggregated.
- How much new for-sale + rental construction is in the pipeline within 1–3 miles? Heavy new supply typically softens prices + rents 12–24 months out; constrained supply supports both.
Investment metrics
- 1% rule
- 0.96% ✗
- Cap rate
- 7.17%
- Cash-on-cash
- 3.14%
- DSCR
- 1.14
- GRM
- 8.6
CMA / ARV
- ARV (on-the-fly)
- $356,905
- Comps found
- 12
Show comp detail 12 sales within ~0.75 mi
| Address | Dist | Beds/Ba | Sqft | Sold | Price | $/sf | Match |
|---|---|---|---|---|---|---|---|
| 830 Cain St | 0.08mi | 3/2.0 | 1,800 (+3%) | 2mo | $320,000 | $178 | 89 |
| 802 Lorca Ave | 0.20mi | 4/2.0 (+1) | 1,828 (+5%) | 3mo | $379,000 | $207 | 75 |
| 1043 Landsdowne Dr | 0.40mi | 4/2.0 (+1) | 1,821 (+5%) | 1mo | $366,000 | $201 | 68 |
| 493 Quarry Ln | 0.65mi | 3/2.0 | 1,658 (-5%) | 0mo | $305,000 | $184 | 62 |
| 938 Riviera Ave | 0.51mi | 4/2.0 (+1) | 1,828 (+5%) | 2mo | $375,000 | $205 | 62 |
| 669 Vocelle Ave | 0.45mi | 3/2.0 | 1,570 (-10%) | 3mo | $335,000 | $213 | 60 |
| 608 Lawson St | 0.54mi | 4/2.0 (+1) | 1,828 (+5%) | 2mo | $380,950 | $208 | 60 |
| 1121 Clearmont St | 0.55mi | 3/2.0 | 1,600 (-8%) | 4mo | $323,000 | $202 | 57 |
| 597 Durant St | 0.62mi | 3/2.0 | 1,858 (+7%) | 4mo | $291,000 | $157 | 57 |
| 626 Braddock St | 0.47mi | 3/2.0 | 1,936 (+11%) | 3mo | $250,910 | $130 | 57 |
| 1062 Laconia St | 0.69mi | 3/2.0 | 1,552 (-11%) | 1mo | $339,990 | $219 | 49 |
| 750 Wilson Ter | 0.58mi | 3/2.0 | 1,516 (-13%) | 4mo | $350,000 | $231 | 48 |
Match score weights: distance 35% · size 25% · config 20% · recency 20%. Top-matched comps best support the ARV.
Projected returns pro-forma
-3.0% appreciation · 6.22% rent growth · sell at horizon
- IRR
- -7.8%
- Equity multiple
- 0.70×
- Total profit
- $-23,252
- Equity at exit
- $41,749
- IRR
- 5.5%
- Equity multiple
- 1.46×
- Total profit
- $36,297
- Equity at exit
- $24,209
Cash invested: $78,400 (down + closing). Projections, not guarantees.
Landlord ↔ Tenant lean methodology
- Overall (STATE)
- 87 Strongly Landlord-Friendly
- State Florida
- 87 Strongly Landlord-Friendly · R+3
- County
- — inherits STATE
- City
- — inherits STATE
ZIP-level market 32958
- Home prices YoY
- -13.1%
- Rents YoY
- 6.2%
- Active inventory
- 412
- Price-to-rent
- 8.6×
Monthly cashflow live
- Estimated rent
- $2,700 high interval (Pro) →
- Mortgage (P&I)
- −$1,468
- Tax from tax record
- −$343 /mo · $4,114/yr
- Insurance
- −$117
- HOA
- −$0
- Vacancy / Maint / Mgmt
- −$567
- Net cashflow
- $205
Break-even live
UW: 25.0% down · 7.5% · 30yr · 1.5% tax · 5.0% vac · 8.0% maint · 8.0% mgmt
Financing live
Cash to close
- Down payment
- $70,000
- Closing costs
- $8,400
- Reserves months
- —
- Total cash needed
- —
Loan-product check · same deal, 3 products live
Conventional
25% down · 7.5% · 30yr
- Down + closing
- —
- Monthly P&I
- —
- Monthly cashflow
- —
- DSCR
- —
- Eligible?
- —
Personal DTI + credit; lowest rate.
DSCR
20% down · 8.5% · 30yr
- Down + closing
- —
- Monthly P&I
- —
- Monthly cashflow
- —
- DSCR
- —
- Eligible?
- —
No personal income docs; deal must DSCR.
Hard money
10% down · 12.0% · 12mo
- Down + closing
- —
- Monthly P&I
- —
- Monthly cashflow
- —
- DSCR
- —
- Eligible?
- —
Short-term bridge; refi at stabilization.
Rent comps 19 comps
| Address | Beds | Baths | Sqft | Rent | $/sqft | DOM | Units | Dist |
|---|---|---|---|---|---|---|---|---|
| 865 Beard Ave Sebastian, FL | 4.0 | 2.0 | 1934 | $3,600 | $1.86 | 21d | 1 | 0.20mi |
| 810 Jamaica Ave Sebastian, FL | 4.0 | 2.0 | 1851 | $3,000 | $1.62 | 13d | 1 | 0.30mi |
| 882 Foster Ave Sebastian, FL | 3.0 | 2.0 | 1080 | $2,450 | $2.27 | 21d | 1 | 0.33mi |
| 486 Biscayne Ln Sebastian, FL | 4.0 | 2.0 | 1769 | $2,250 | $1.27 | 13d | 1 | 0.64mi |
| 832 Carnation Dr Sebastian, FL | 3.0 | 2.0 | 1400 | $2,800 | $2.00 | 13d | 1 | 0.83mi |
| 393 S Wimbrow Dr Apt A Sebastian, FL | 2.0 | 2.0 | 1700 | $1,900 | $1.12 | 21d | 1 | 0.84mi |
| 1343 Shoreline Cir Sebastian, FL | 3.0 | 2.0 | 2222 | $4,000 | $1.80 | 21d | 1 | 0.85mi |
| 1110 Barber St Sebastian, FL | 3.0 | 2.0 | 1324 | $2,200 | $1.66 | 13d | 1 | 0.89mi |
| 426 Tulip Dr Sebastian, FL | 2.0 | 2.0 | 1161 | $2,100 | $1.81 | 21d | 1 | 0.90mi |
| 462 Lloyd St Sebastian, FL | 3.0 | 2.0 | 1564 | $2,400 | $1.53 | 21d | 1 | 1.00mi |
| 11171 Airport Dr Sebastian, FL | 2.0 | 2.0 | 1191 | $1,900 | $1.60 | 21d | 1 | 1.00mi |
| 243 Harp Ter Unit A Sebastian, FL | 2.0 | 2.0 | 1150 | $1,885 | $1.64 | 21d | 1 | 1.07mi |
| 351 Del Monte Rd Unit B Sebastian, FL | 3.0 | 2.0 | 1416 | $1,900 | $1.34 | 13d | 1 | 1.10mi |
| 351 Del Monte Rd Unit B Sebastian, FL | 3.0 | 2.0 | 1416 | $1,900 | $1.34 | 21d | 1 | 1.10mi |
| 1192 Croquet Ln Sebastian, FL | 4.0 | 2.0 | 2012 | $2,640 | $1.31 | 13d | 1 | 1.16mi |
| 632 Bayfront Ter Sebastian, FL | 3.0 | 2.0 | 1885 | $2,350 | $1.25 | 13d | 1 | 1.19mi |
| 246 S Wimbrow Dr Sebastian, FL | 3.0 | 2.0 | 1364 | $3,000 | $2.20 | 13d | 1 | 1.22mi |
| 742 Capon Ter Sebastian, FL | 2.0 | 2.0 | 1080 | $2,000 | $1.85 | 21d | 1 | 1.23mi |
| 406 Easy St Sebastian, FL | 4.0 | 2.0 | 1874 | $2,100 | $1.12 | 21d | 1 | 1.37mi |
Listing history 39 events
-
2026-06-19days on market $280,000 Active 140 DOM
-
2026-06-18days on market $280,000 Active 139 DOM
-
2026-06-17days on market $280,000 Active 138 DOM
-
2026-06-16days on market $280,000 Active 137 DOM
-
2026-06-15days on market $280,000 Active 136 DOM
-
2026-06-14days on market $280,000 Active 134 DOM
-
2026-06-13days on market $280,000 Active 133 DOM
-
2026-06-10days on market $280,000 Active 131 DOM
-
2026-06-09days on market $280,000 Active 130 DOM
-
2026-06-08days on market $280,000 Active 129 DOM
-
2026-06-07days on market $280,000 Active 128 DOM
-
2026-06-05days on market $280,000 Active 125 DOM
-
2026-06-02days on market $280,000 Active 123 DOM
-
2026-06-01days on market $280,000 Active 122 DOM
-
2026-05-31days on market $280,000 Active 121 DOM
-
2026-05-30days on market $280,000 Active 120 DOM
-
2026-01-30$280,000 Active
Show marketing remark (1099 chars)
Buyer Incentive! Buyers may receive $2,000 toward closing costs when financing is obtained through our preferred lender. Beautiful Single-Family Home located in a quiet and well-established neighborhood in Sebastian, Florida. This property features 3 spacious bedrooms and 2 full bathrooms, offering a functional and comfortable layout ideal for everyday living. With 1,741 square feet of living space, the home provides well-distributed areas perfect for families or anyone seeking comfort and space. A major highlight of this property is the solar panel system, which helps reduce energy costs and increases overall efficiency, making it both eco-friendly and cost-effective. Home is approximately 4–5 miles from the beach, just a 15-minute drive to the Atlantic Ocean, including popular destinations such as Sebastian Inlet and nearby coastal beaches. This property offers an excellent combination of comfort, energy efficiency, and location, with easy access to shopping, schools, dining, and outdoor recreation. An excellent opportunity to own or invest on Florida’s Treasure Coast.
-
2026-01-30$280,000 Active 1099-char remark
Show marketing remark (1099 chars)
Buyer Incentive! Buyers may receive $2,000 toward closing costs when financing is obtained through our preferred lender. Beautiful Single-Family Home located in a quiet and well-established neighborhood in Sebastian, Florida. This property features 3 spacious bedrooms and 2 full bathrooms, offering a functional and comfortable layout ideal for everyday living. With 1,741 square feet of living space, the home provides well-distributed areas perfect for families or anyone seeking comfort and space. A major highlight of this property is the solar panel system, which helps reduce energy costs and increases overall efficiency, making it both eco-friendly and cost-effective. Home is approximately 4–5 miles from the beach, just a 15-minute drive to the Atlantic Ocean, including popular destinations such as Sebastian Inlet and nearby coastal beaches. This property offers an excellent combination of comfort, energy efficiency, and location, with easy access to shopping, schools, dining, and outdoor recreation. An excellent opportunity to own or invest on Florida’s Treasure Coast.
-
2025-12-20historical
-
2025-12-14historical
-
2025-02-17$350,000 Active
-
2025-02-17$350,000 Active
-
2022-02-04soldstatus $260,900 Closed
-
2022-02-04soldstatus $260,900 Closed
-
2022-01-04historical Active Under Contract
-
2022-01-04historical Contingent
-
2022-01-03$249,900 Active
-
2022-01-03$249,900 Active
-
2021-12-31historical $249,900
-
2020-08-24soldstatus $179,900
-
2020-08-20soldstatus $179,900 Closed
-
2020-08-17status Pending
-
2020-07-24status Pending
-
2020-07-20$179,900 Active
-
2020-02-05soldstatus $110,000
-
2015-01-30soldstatus $70,000
-
2000-12-21soldstatus $45,000
-
1992-12-01soldstatus $45,000
-
1986-09-01soldstatus $61,000
ⓘ Source: listings_history table (triggers on properties + properties_extension) + one-shot
backfill from property_details.listing_events for pre-trigger history.
Tax reassessment forecast FL · Resets to sale price
- Current annual tax
- $4,114 · $343/mo
- Projected year-2 tax
- $4,114 · $343/mo
- Expected delta
- $0/yr ($0/mo · 0.0%)
ⓘ Screening estimate from a state-policy table — verify with the county assessor before closing.
Climate risk First Street
- Flood 1/10 Low FEMA zone X (unshaded) · 0% chance over 30 yrs
- Wildfire 2/10 Low
- Heat 10/10 Extreme 7 d/yr ≥106°F today · 23 d/yr by 30 yrs out
- Wind 10/10 Extreme 99% chance of damaging wind over 30 yrs
- Air quality 1/10 Low 0 unhealthy d/yr today · 0 by 30 yrs out
Nearby sold comps map
Loading sold comps map…
Walkable amenities ~0.75 mi
Loading nearby amenities…
Taxation est. · year 1
- Rental income
- $32,397
- − Mortgage interest
- −$15,684
- − Property taxes
- −$4,114
- − Insurance
- −$1,400
- − Repairs & maintenance
- −$2,592
- − Management
- −$2,592
- − Depreciation
- −$8,145
- Taxable loss
- −$2,130
- Est. tax savings @ 24.0%
- +$511
- After-tax cash flow
- $2,971/yr
For passive investors: Depreciation is non-cash, so a rental often shows a tax loss while cash-flowing — sheltering income. Rental losses are passive: they offset passive income freely, and up to $25,000/yr can offset ordinary (W-2) income if you actively participate and your MAGI is under $100k (phasing out to $0 by $150k); unused losses carry forward. On sale, claimed depreciation is recaptured at up to 25%, and gains may owe capital-gains tax (a 1031 exchange can defer both). Figures are a year-1 estimate at your 24.0% rate — not tax advice; consult a CPA.
Schools (NCES district)
- District
- Indian River
- NCES district ID
- 1200930
- Math proficiency
- 48% ▼ -9.00%
- Reading proficiency
- 52% ▼ -3.00%
- Median HH income
- $46,597
- Composite
- 42.45/100
- National rank
- #3218
- State rank
- #35 of 73 in FL
Livability — Sebastian
- Score
- 81/100
- State rank
- #89
- US rank
- #1421
Category grades
Schools grade is shown separately in the Schools card above.
Census & demographics
- Census place
- Sebastian, FL
- County
- Indian River County · 143,738 people
- City population
- 30,023
- Metro
- Sebastian-Vero Beach, FL
- Population (ZIP)
- 30,023
- Household income
- $66,840
- Rent vs Own
- Severe rent burden
- 646.0
Population outlook (Indian River County) Hauer SSP2
- Today (2025)
- 165,104 people
- By 2030
- 172,869 · +4.7%
- By 2040
- 185,640 · +12.4%
- By 2050
- 194,465 · +17.8%
- By 2075
- 211,115 · +27.9%
- By 2100
- 211,781 · +28.3%
Race, ethnicity, and origin ACS 2023
- Neighborhood character
- Predominantly White (86%)
- Race & ethnicity
- White 86% Hispanic / Latino 9% Two or more races 7% Black 2% Asian 1%
- Hispanic origin (detail)
- Mexican 1% Puerto Rican 2% Cuban 3%
- Common ancestry
- Lithuanian 4% Slovak 4% Romanian 3%
- Foreign-born
- 7% · Canada, Jamaica
- Languages at home
- 91% English-only · Spanish 6% Other Indo-European 1% Russian/Polish/Slavic 1%
Political lean MEDSL · Indian River
- 2024 margin
- Strong R (+27.4) · D 36.0% · R 63.4%
- 2008→2024 swing
- -12.5pp toward R · 2008: -14.8pp · 2024: -27.4pp
- All cycles
- 2024: R+27.4 2020: R+21.6 2016: R+24.5 2012: R+22.3 2008: R+14.8
Not yet ingested
- Civics
- —
Market trends
- HPI YoY
- ▼ -49.85%
- Current HPI
- 330.1691
- Rent YoY
- ▲ 6.22%
- Metro
- Sebastian-Vero Beach, FL
- State GDP YoY
- ▲ 3.28%
- F500 in state
- 36
Industry mix (Fortune 500 HQ in FL)
| Industry | F500 HQs | Revenue |
|---|---|---|
| Industrial Technology | 2 | $29B |
|
||
| Insurance | 2 | $17B |
|
||
| Retail | 1 | $60B |
|
||
| Technology Distribution | 1 | $58B |
|
||
| Homebuilding | 1 | $35B |
|
||
| Technology Manufacturing | 1 | $35B |
|
||
Price history
+359.0% since first listed23 events — show timeline
- 2026-01-30 Listed $280,000 Stellar MLS as Distributed by MLS Grid
- 2026-01-30 Listed $280,000 MARMLS
- 2025-12-20 Listing Removed — Beaches MLS
- 2025-12-14 Listing Removed — SCMLS
- 2025-02-17 Listed $350,000 SCMLS
- 2025-02-17 Listed $350,000 Beaches MLS
- 2022-02-04 Sold (MLS) $260,900 RAIRCMLS
- 2022-02-04 Sold (MLS) $260,900 SCMLS
- 2022-01-04 Contingent — RAIRCMLS
- 2022-01-04 Contingent — SCMLS
- 2022-01-03 Listed $249,900 RAIRCMLS
- 2022-01-03 Listed $249,900 SCMLS
- 2021-12-31 Coming Soon $249,900 RAIRCMLS
- 2020-08-24 Sold (Public Records) $179,900 Public Records
- 2020-08-20 Sold (MLS) $179,900 RAIRCMLS
- 2020-08-17 Pending — RAIRCMLS
- 2020-07-24 Pending — RAIRCMLS
- 2020-07-20 Listed $179,900 RAIRCMLS
- 2020-02-05 Sold (Public Records) $110,000 Public Records
- 2015-01-30 Sold (Public Records) $70,000 Public Records
- 2000-12-21 Sold (Public Records) $45,000 Public Records
- 1992-12-01 Sold (Public Records) $45,000 Public Records
- 1986-09-01 Sold (Public Records) $61,000 Public Records
Property tax history
+18.5%/yrLatest (2025): $4,114 · +0.6% YoY. Source: county tax records.
Cash-flow waterfall
monthlySold comps — $/sqft
last 12 mo · ≤1 miLoading sold comps…