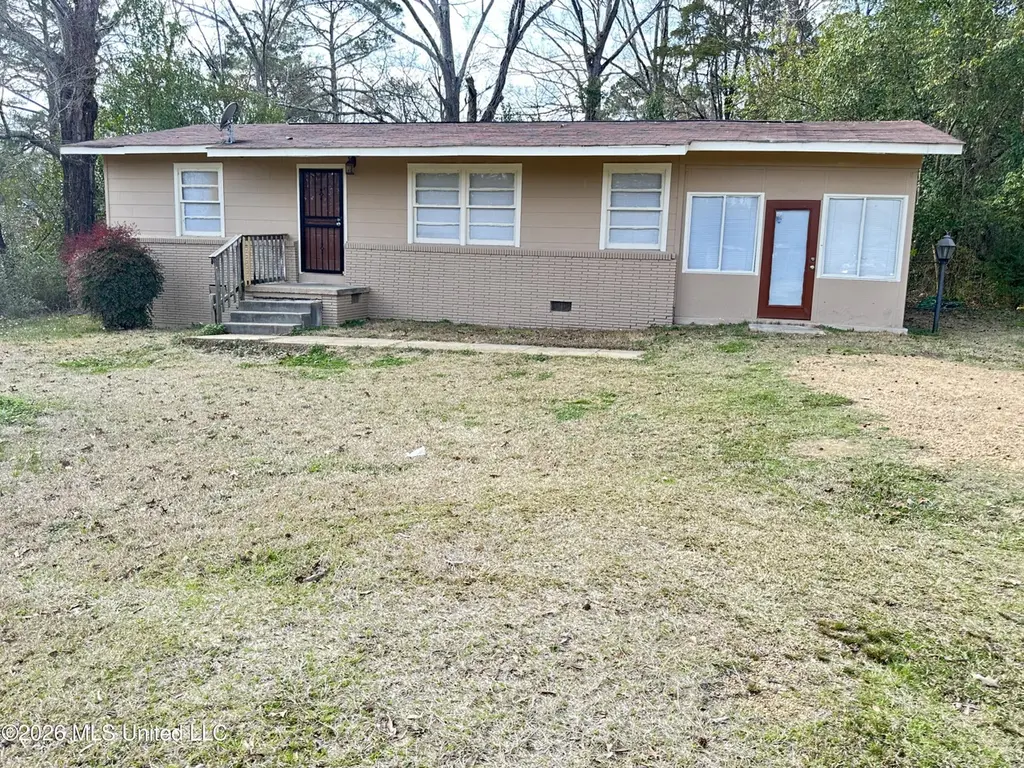
3679 Southland Dr · Jackson, MS
Flood risk 1/10 · Minimal
- FEMA flood zone
- X (unshaded)
- Chance of flooding over 30 yrs
- 0.0%
- Est. flood insurance / yr
- $507 – $1,088
Fire risk 1/10 · Minimal
- Est. fire insurance / yr
- $1,241 – $2,305
Heat risk 7/10 · Major
- Hot days now (above 108°F)
- 7 days/yr
- Hot days in 30 yrs
- 20 days/yr
Wind risk 8/10 · Major
- Chance of severe wind over 30 yrs
- 80.0%
Air-quality risk 1/10 · Minimal
- Unhealthy air days now
- 0 days/yr
- Unhealthy air days in 30 yrs
- 0 days/yr
Risk factors via First Street. Map © Google.
Why this score? — see what drove the C+ grade
The composite is a weighted blend of 9 inputs, each scored 0–100. Each bar is that input's sub-score; the figure is the points it added to the 100-point composite (weight × sub-score).
- Cash flow +30.0/30.0
- 1% rule +10.0/10.0
- DSCR +10.0/10.0
- Rent growth +3.6/5.0
- Livability +3.4/5.0
- Condition / age +2.5/5.0
- Schools +1.1/10.0
- ARV discount +0.0/15.0
- Appreciation +0.0/10.0
$61,900
🖨 Deal sheet 📄 Offer letter ✓ Due diligence
Listing remarks MLS
Super Opportunity and very affordable! Fully renovated and move in ready!! Refurbished hardwood floors throughout. Updated kitchen with new refrigerator, stove, microwave and ceramic tile counter tops, spacious bedrooms, updated bathroom, new lighting and fans, central heat and air, fully repainted inside and out, bonus room off the kitchen, large yard fenced in the back.
Key facts
- Central heat and air
- Bonus room
- Updated kitchen
Tags
Neighborhood map
What this means for you Summary
Snapshot
- This is a 2-bed/1.0-bath single-family listed at $62k.
Deal economics
- At list price, monthly cash flow is $489 ($6k/yr) — positive.
- The deal already cash-flows at list — no discount required.
- Meets the 1% rule at list price ($1k rent vs $62k).
- Recommended offer: $56k (9.0% below list) — sets the bar for market timing.
- Cap rate 15.8% vs local median 9.9% in Jackson — top-decile yield for the area; either an underpriced asset or a hidden risk that comps aren't pricing in. Stress-test before assuming the spread holds.
Location & tenants
- Location reads 68/100 on livability (#66 in MS) — a middle-class / working-renter tenant base. Strengths: commute A+, cost of living A+, housing A+; Watch: schools F, amenities F, employment F.
- Jackson Public School District (urban): math 9% / reading 18% proficiency, ranked #112 of 130 in MS (top 86%) — low school quality limits family demand, transient renter base, plan for 1-2y turnover; 88% free/reduced lunch — lower-income household profile, screen leases tightly.
- Market conditions: Rents rising fast (+4.2%/yr); 302 active listings in the ZIP; 22 comparable units currently listed for rent nearby; rentals at typical pace (median 24d on market — plan ~3-4 weeks tenant-placement turnaround); 167 units permitted in Hinds County in 2024 (0 in 5+ unit buildings).
Forward outlook
- Local home prices are declining (-3.0%/yr); year-one equity from $428 of loan paydown is wiped out by about $2k of value loss. Plan a longer hold.
- Hinds County population projected to shrink 6% by 2050 — rents likely to lag national; underwrite the cash flow, not the appreciation.
- At projected returns (-3.0% appreciation + 4.2% rent growth), your $17k cash investment doubles in ~4 years — after that, you're playing with house money.
Negotiation context
- It's been on market 105 days — a 9% lower offer ($56k) is reasonable based on typical stale-listing flexibility.
- 7 sale attempts since 22y ago; this cycle's ask is 6121% above the opening price — seller raised mid-cycle; expect resistance to lowballs.
Risks & watch-outs
- Watch-outs: built in 1954 — expect roof / HVAC / electrical / plumbing capex.
- Climate carrying-cost: severe wind risk, 80% chance of damaging wind over 30y; extreme-heat days projected 7→20/yr by 2055 (HVAC capex compounding) — expect insurance premiums to compound above CPI over the hold.
Questions for the listing agent
- It's been on market 105 days. Have you received any prior offers? Is the seller open to a 9% concession, seller financing, or rate buy-down credit?
- Built in 1954 — when were the roof, HVAC, electrical panel, plumbing, and water heater last replaced?
- Why hasn't it sold? Are there any deal-killer items the seller is aware of (foundation, flood, title, zoning, code violations)?
- Is there a deadline driving the sale (1031 exchange, divorce, estate, relocation)? That informs how much negotiation room exists.
- Schools are F-rated, which usually means shorter tenancies and higher turnover. Who's the typical renter profile here, and what's been the actual vacancy rate?
- What's the average days-on-market for RENTAL listings here right now (not sales)? A rising rental-DOM trend means longer vacancies and softer asking-rent achievability than the comps imply.
- What's the recent tenant-quality profile in this submarket — average credit score on applications, eviction rate, late-payment / NSF rate, and stable-employment percentage? A property-management company in the area should have these aggregated.
- How much new for-sale + rental construction is in the pipeline within 1–3 miles? Heavy new supply typically softens prices + rents 12–24 months out; constrained supply supports both.
Investment metrics
- 1% rule
- 1.79% ✓
- Cap rate
- 15.77%
- Cash-on-cash
- 33.86%
- DSCR
- 2.51
- GRM
- 4.7
CMA / ARV
- ARV (median comp)
- $43,493
- List price
- $61,900
- Delta
- 42.32%
- Verdict
- OVERPRICED
- Comps
- 20 within 1.0 mi
Show comp detail 10 sales within ~0.75 mi
| Address | Dist | Beds/Ba | Sqft | Sold | Price | $/sf | Match |
|---|---|---|---|---|---|---|---|
| 3408 N Southland Dr | 0.32mi | 3/1.0 (+1) | 1,313 (+5%) | 9mo | $25,000 | $19 | 64 |
| 362 E Leavell Woods Dr | 0.12mi | 3/1.0 (+1) | 1,080 (-14%) | 4mo | $30,000 | $28 | 63 |
| 3646 Southland Dr | 0.05mi | 3/1.5 (+1) | 1,147 (-8%) | 21mo | $60,000 | $52 | 60 |
| 3513 Hines St | 0.35mi | 3/2.0 (+1) | 1,132 (-9%) | 1mo | $45,000 | $40 | 58 |
| 136 N Sunset Ter | 0.69mi | 2/1.0 | 1,233 (-1%) | 12mo | $60,000 | $49 | 56 |
| 423 Savanna St | 0.48mi | 3/1.5 (+1) | 1,281 (+3%) | 19mo | $19,900 | $16 | 50 |
| 170 Cooper Rd | 0.71mi | 3/1.0 (+1) | 1,370 (+10%) | 2mo | $18,500 | $14 | 44 |
| 144 Neatherwood Dr | 0.73mi | 3/1.0 (+1) | 1,205 (-3%) | 14mo | $89,000 | $74 | 44 |
| 402 Savanna St | 0.44mi | 3/2.0 (+1) | 1,071 (-14%) | 6mo | $65,000 | $61 | 42 |
| 124 S Sunset Ter | 0.72mi | 3/1.0 (+1) | 1,172 (-6%) | 12mo | $49,875 | $43 | 41 |
Match score weights: distance 35% · size 25% · config 20% · recency 20%. Top-matched comps best support the ARV.
Projected returns pro-forma
-3.0% appreciation · 4.23% rent growth · sell at horizon
- IRR
- 30.5%
- Equity multiple
- 2.30×
- Total profit
- $22,488
- Equity at exit
- $9,229
- IRR
- 38.4%
- Equity multiple
- 4.78×
- Total profit
- $65,474
- Equity at exit
- $5,352
Cash invested: $17,332 (down + closing). Projections, not guarantees.
Landlord ↔ Tenant lean methodology
- Overall (STATE)
- 90 Strongly Landlord-Friendly
- State Mississippi
- 90 Strongly Landlord-Friendly · R+11
- County
- — inherits STATE
- City
- — inherits STATE
ZIP-level market 39212
- Home prices YoY
- -11.7%
- Rents YoY
- 4.2%
- Active inventory
- 302
- Price-to-rent
- 4.7×
Monthly cashflow live
- Estimated rent
- $1,106 high interval (Pro) →
- Mortgage (P&I)
- −$325
- Tax from tax record
- −$34 /mo · $411/yr
- Insurance
- −$26
- HOA
- −$0
- Vacancy / Maint / Mgmt
- −$232
- Net cashflow
- $489
Break-even live
UW: 25.0% down · 7.5% · 30yr · 1.5% tax · 5.0% vac · 8.0% maint · 8.0% mgmt
Financing live
Cash to close
- Down payment
- $15,475
- Closing costs
- $1,857
- Reserves months
- —
- Total cash needed
- —
Loan-product check · same deal, 3 products live
Conventional
25% down · 7.5% · 30yr
- Down + closing
- —
- Monthly P&I
- —
- Monthly cashflow
- —
- DSCR
- —
- Eligible?
- —
Personal DTI + credit; lowest rate.
DSCR
20% down · 8.5% · 30yr
- Down + closing
- —
- Monthly P&I
- —
- Monthly cashflow
- —
- DSCR
- —
- Eligible?
- —
No personal income docs; deal must DSCR.
Hard money
10% down · 12.0% · 12mo
- Down + closing
- —
- Monthly P&I
- —
- Monthly cashflow
- —
- DSCR
- —
- Eligible?
- —
Short-term bridge; refi at stabilization.
Rent comps 22 comps
| Address | Beds | Baths | Sqft | Rent | $/sqft | DOM | Units | Dist |
|---|---|---|---|---|---|---|---|---|
| 346 Mason Blvd Jackson, MS | 3.0 | 1.0 | 1048 | $1,050 | $1.00 | 23d | 1 | 0.16mi |
| 346 Mason Blvd Jackson, MS | 3.0 | 1.0 | 1048 | $1,050 | $1.00 | 13d | 1 | 0.16mi |
| 3645 Lee Dr Jackson, MS | 3.0 | 1.0 | 1105 | $895 | $0.81 | 23d | 1 | 0.31mi |
| 3875 Interstate 55 Jackson, MS | 1.0–2.0 | 1.5 | 800 | $1,100 | $1.38 | 13d | 1 | 0.31mi |
| 3901 Walker Ave Jackson, MS | 3.0 | 2.0 | 1300 | $1,100 | $0.85 | 21d | 1 | 0.57mi |
| 230 Savanna St Jackson, MS | 2.0 | 1.0 | 782 | $795 | $1.02 | 43d | 1 | 0.67mi |
| 140 Neatherwood Dr Jackson, MS | 3.0 | 2.0 | 1450 | $1,297 | $0.89 | 13d | 1 | 0.72mi |
| 267 Woody Dr Jackson, MS | 3.0 | 1.5 | 1165 | $1,100 | $0.94 | 43d | 1 | 0.88mi |
| 201 W Santa Clair St Jackson, MS | 2.0 | 1.0 | 1182 | $950 | $0.80 | 23d | 1 | 0.93mi |
| 201 W Santa Clair St Jackson, MS | 2.0 | 1.0 | 1182 | $950 | $0.80 | 13d | 1 | 0.93mi |
| 316 Woody Dr Jackson, MS | 3.0 | 1.0 | 1185 | $1,250 | $1.05 | 13d | 1 | 0.96mi |
| 316 Woody Dr Jackson, MS | 3.0 | 1.0 | 1185 | $1,250 | $1.05 | 43d | 1 | 0.96mi |
| 270 Wildwood Ct Jackson, MS | 3.0 | 1.0 | 1200 | $1,200 | $1.00 | 21d | 1 | 0.99mi |
| 156 McCluer Rd Apt A Jackson, MS | 3.0 | 2.0 | 1125 | $1,300 | $1.16 | 21d | 1 | 1.05mi |
| 422 Cooper Rd Jackson, MS | 3.0 | 1.0 | 1049 | $1,426 | $1.36 | 23d | 1 | 1.06mi |
| 3511 Sykes Park Dr Jackson, MS | 3.0 | 2.0 | 1225 | $1,426 | $1.16 | 13d | 1 | 1.25mi |
| 103 Sykes Park Cir Jackson, MS | 3.0 | 2.0 | 1500 | $1,250 | $0.83 | 43d | 1 | 1.31mi |
| 3152 Bilgray Dr Jackson, MS | 3.0 | 1.5 | 1200 | $1,100 | $0.92 | 13d | 1 | 1.35mi |
| 225 W McDowell Rd Jackson, MS | 1.0–3.0 | 1.0–2.0 | 900 | $975 | $1.08 | 43d | 18 | 1.37mi |
| 225 W McDowell Rd Apt L2 Jackson, MS | 1.0 | 1.0 | 896 | $750 | $0.84 | 21d | 1 | 1.37mi |
| 2786 Brookwood Dr Jackson, MS | 3.0 | 1.0 | 1003 | $1,100 | $1.10 | 43d | 1 | 1.46mi |
| 2858 Fairhill Dr Jackson, MS | 2.0 | 1.0 | 900 | $825 | $0.92 | 43d | 1 | 1.48mi |
Listing history 33 events
-
2026-06-18days on market $61,900 Active 105 DOM
-
2026-06-17days on market $61,900 Active 104 DOM
-
2026-06-16days on market $61,900 Active 103 DOM
-
2026-06-15days on market $61,900 Active 102 DOM
-
2026-06-14days on market $61,900 Active 100 DOM
-
2026-06-13days on market $61,900 Active 99 DOM
-
2026-06-10days on market $61,900 Active 97 DOM
-
2026-06-09days on market $61,900 Active 96 DOM
-
2026-06-08days on market $61,900 Active 95 DOM
-
2026-06-07days on market $61,900 Active 94 DOM
-
2026-06-05days on market $61,900 Active 91 DOM
-
2026-06-03days on market $61,900 Active 90 DOM
-
2026-06-02days on market $61,900 Active 89 DOM
-
2026-06-01days on market $61,900 Active 88 DOM
-
2026-05-31days on market $61,900 Active 87 DOM
-
2026-05-30days on market $61,900 Active 86 DOM
-
2026-04-29$995
-
2026-04-28historical $995
-
2026-03-13price $61,900 375-char remark
Show marketing remark (375 chars)
Super Opportunity and very affordable! Fully renovated and move in ready!! Refurbished hardwood floors throughout. Updated kitchen with new refrigerator, stove, microwave and ceramic tile counter tops, spacious bedrooms, updated bathroom, new lighting and fans, central heat and air, fully repainted inside and out, bonus room off the kitchen, large yard fenced in the back.
-
2026-03-06$995
-
2026-03-05$65,500 Active 375-char remark
Show marketing remark (375 chars)
Super Opportunity and very affordable! Fully renovated and move in ready!! Refurbished hardwood floors throughout. Updated kitchen with new refrigerator, stove, microwave and ceramic tile counter tops, spacious bedrooms, updated bathroom, new lighting and fans, central heat and air, fully repainted inside and out, bonus room off the kitchen, large yard fenced in the back.
-
2023-10-26historical $850
-
2023-08-17$850
-
2023-08-13historical $850
-
2023-08-04$850
-
2022-06-20price $850
-
2021-10-01historical
-
2021-10-01historical
-
2007-01-19soldstatus
-
2006-11-17$27,000
-
2004-07-19$45,000
-
1998-10-09soldstatus
-
1976-04-21soldstatus
ⓘ Source: listings_history table (triggers on properties + properties_extension) + one-shot
backfill from property_details.listing_events for pre-trigger history.
Tax reassessment forecast MS · Resets to sale price
- Current annual tax
- $411 · $34/mo
- Projected year-2 tax
- $489 · $41/mo
- Expected delta
- +$78/yr (+$7/mo · 19.0%)
ⓘ Screening estimate from a state-policy table — verify with the county assessor before closing.
Climate risk First Street
- Flood 1/10 Low FEMA zone X (unshaded) · 0% chance over 30 yrs
- Wildfire 1/10 Low
- Heat 7/10 Severe 7 d/yr ≥108°F today · 20 d/yr by 30 yrs out
- Wind 8/10 Severe 80% chance of damaging wind over 30 yrs
- Air quality 1/10 Low 0 unhealthy d/yr today · 0 by 30 yrs out
Nearby sold comps map
Loading sold comps map…
Walkable amenities ~0.75 mi
Loading nearby amenities…
Taxation est. · year 1
- Rental income
- $13,270
- − Mortgage interest
- −$3,467
- − Property taxes
- −$411
- − Insurance
- −$310
- − Repairs & maintenance
- −$1,062
- − Management
- −$1,062
- − Depreciation
- −$1,801
- Taxable income
- $5,159
- Est. tax owed @ 24.0%
- −$1,238
- After-tax cash flow
- $4,630/yr
For passive investors: Depreciation is non-cash, so a rental often shows a tax loss while cash-flowing — sheltering income. Rental losses are passive: they offset passive income freely, and up to $25,000/yr can offset ordinary (W-2) income if you actively participate and your MAGI is under $100k (phasing out to $0 by $150k); unused losses carry forward. On sale, claimed depreciation is recaptured at up to 25%, and gains may owe capital-gains tax (a 1031 exchange can defer both). Figures are a year-1 estimate at your 24.0% rate — not tax advice; consult a CPA.
Schools (NCES district)
- District
- Jackson Public School District
- NCES district ID
- 2802190
- Math proficiency
- 9% ▼ -14.00%
- Reading proficiency
- 18% ▼ -7.00%
- Median HH income
- $33,234
- Composite
- 10.89/100
- National rank
- #9755
- State rank
- #112 of 130 in MS
Livability — Jackson
- Score
- 68/100
- State rank
- #66
- US rank
- #9695
Category grades
Schools grade is shown separately in the Schools card above.
Census & demographics
- Census place
- Jackson, MS
- County
- Hinds County · 167,040 people
- City population
- 140,204
- Metro
- Jackson, MS
- Population (ZIP)
- 25,659
- Household income
- $50,722
- Rent vs Own
- Severe rent burden
- 1314.0
Population outlook (Hinds County) Hauer SSP2
- Today (2025)
- 242,528 people
- By 2030
- 241,113 · -0.6%
- By 2040
- 235,557 · -2.9%
- By 2050
- 226,946 · -6.4%
- By 2075
- 199,995 · -17.5%
- By 2100
- 164,165 · -32.3%
Race, ethnicity, and origin ACS 2023
- Neighborhood character
- Predominantly Black (86%)
- Race & ethnicity
- Black 86% White 9% Hispanic / Latino 3% Two or more races 3%
- Common ancestry
- Serbian 1% Lithuanian 1%
- Foreign-born
- 1% · Canada
- Languages at home
- 97% English-only · Spanish 2%
Political lean MEDSL · Hinds
- 2024 margin
- Solid D (+46.1) · D 72.4% · R 26.3% · Other 1.4%
- 2008→2024 swing
- +7.1pp toward D · 2008: 39.0pp · 2024: 46.1pp
- All cycles
- 2024: D+46.1 2020: D+48.3 2016: D+43.7 2012: D+45.1 2008: D+39.0
Not yet ingested
- Civics
- —
Market trends
- HPI YoY
- ▼ -23.01%
- Current HPI
- 174.4025
- Rent YoY
- ▲ 4.23%
- Metro
- Jackson, MS
- State GDP YoY
- —
- F500 in state
- 0
Price history
+37.6% since first listed17 events — show timeline
- 2026-04-29 Listed for Rent $995 TURBOTENANT
- 2026-04-28 Rental Removed $995 TURBOTENANT
- 2026-03-13 Price Changed $61,900 MLSU
- 2026-03-06 Listed for Rent $995 TURBOTENANT
- 2026-03-05 Listed $65,500 MLSU
- 2023-10-26 Rental Removed $850 TURBOTENANT
- 2023-08-17 Listed for Rent $850 TURBOTENANT
- 2023-08-13 Rental Removed $850 TURBOTENANT
- 2023-08-04 Listed for Rent $850 TURBOTENANT
- 2022-06-20 Price Changed $850 TURBOTENANT
- 2021-10-01 Listing Removed — MLSU
- 2021-10-01 Listing Removed — MLSU
- 2007-01-19 Sold (Public Records) — Public Records
- 2006-11-17 Listed $27,000 MLSU
- 2004-07-19 Listed $45,000 MLSU
- 1998-10-09 Sold (Public Records) — Public Records
- 1976-04-21 Sold (Public Records) — Public Records
Property tax history
-5.6%/yrLatest (2025): $411 · +1.5% YoY. Source: county tax records.
Cash-flow waterfall
monthlySold comps — $/sqft
last 12 mo · ≤1 miLoading sold comps…