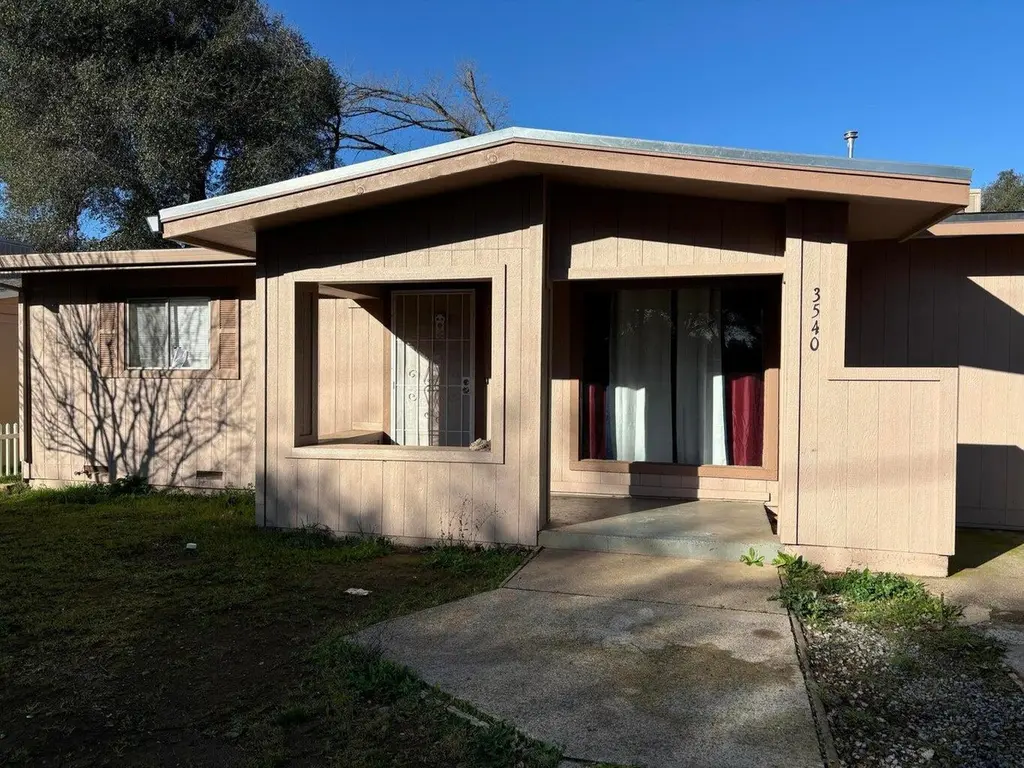
3540 Ricardo Ave · Redding, CA
Flood risk 1/10 · Minimal
- FEMA flood zone
- X (unshaded)
- Chance of flooding over 30 yrs
- 0.0%
- Est. flood insurance / yr
- $507 – $1,088
Fire risk 3/10 · Minor
- Est. fire insurance / yr
- $659 – $1,223
Heat risk 8/10 · Major
- Hot days now (above 105°F)
- 7 days/yr
- Hot days in 30 yrs
- 15 days/yr
Wind risk 1/10 · Minimal
- Chance of severe wind over 30 yrs
- —
Air-quality risk 10/10 · Severe
- Unhealthy air days now
- 37 days/yr
- Unhealthy air days in 30 yrs
- 40 days/yr
Risk factors via First Street. Map © Google.
Why this score? — see what drove the D+ grade
The composite is a weighted blend of 9 inputs, each scored 0–100. Each bar is that input's sub-score; the figure is the points it added to the 100-point composite (weight × sub-score).
- ARV discount +15.0/15.0
- Cash flow +13.3/30.0
- Schools +4.6/10.0
- DSCR +4.0/10.0
- Livability +3.8/5.0
- Rent growth +3.0/5.0
- 1% rule +2.7/10.0
- Condition / age +2.5/5.0
- Appreciation +0.0/10.0
$279,500
🖨 Deal sheet (PDF) 📄 Offer letter ✓ Due diligence
Listing remarks
This home has a lower effective age than the actual age due to being renovated approximately 2 years ago due to fire damage. New roof, gutters, windows, evaporative cooling, carpet & vinyl flooring. New interior and exterior paint. 3 bedroom 1.5 bath. Living room, dining room, family room. Inside laundry. Large fenced backyard.
Key facts
- New carpet
- New gutters
- Evaporative cooling
Tags
Neighborhood map
What this means for you Summary
Snapshot
- This is a 3-bed/1.5-bath single-family listed at $280k.
Deal economics
- At list price, monthly cash flow is $1 ($9/yr) — positive.
- The deal already cash-flows at list — no discount required.
- To meet the 1% rule (rent ≥ 1% of price), the offer needs to be $215k (23.1% below list).
- Recommended offer: $215k (23.1% below list) — sets the bar for 1% rule.
- Cap rate 6.3% vs local median 3.3% in Redding — top-decile yield for the area; either an underpriced asset or a hidden risk that comps aren't pricing in. Stress-test before assuming the spread holds.
Location & tenants
- Location reads 76/100 on livability (#106 in CA, #3,726 nationally) — a middle-class / working-renter tenant base. Strengths: amenities A+, commute A+, health & safety A+; Watch: employment C-, crime F, cost of living F.
- Shasta Union High (urban): math 41% / reading 67% proficiency, ranked #122 of 517 in CA (top 24%) — acceptable for families but not a draw, mixed tenant base, ~2y average lease; only 16% free/reduced lunch — higher-income household profile.
- Market conditions: Rents rising (+1.9%/yr); 286 active listings in the ZIP; 4 comparable units currently listed for rent nearby; rentals leasing fast (median 14d on market — plan ~1-2 weeks tenant-placement turnaround); 246 units permitted in Shasta County in 2024 (0 in 5+ unit buildings).
- This rent runs 35% of the median local income ($73k/yr) — at the standard rent-burdened threshold; future hikes will face affordability resistance.
Forward outlook
- Local home prices are declining (-3.0%/yr); year-one equity from $2k of loan paydown is wiped out by about $8k of value loss. Plan a longer hold.
- Shasta County population projected to shrink 9% by 2050 — rents likely to lag national; underwrite the cash flow, not the appreciation.
Negotiation context
- It's been on market 29 days — a 2% lower offer ($275k) is reasonable based on typical stale-listing flexibility.
- 4 sale attempts since 2y ago with the ask held roughly flat each time — persistent listings suggest the price (not the market) is what's stuck; bring a comps-based counter.
Risks & watch-outs
- Watch-outs: built in 1959 — expect roof / HVAC / electrical / plumbing capex.
- Climate carrying-cost: extreme-heat days projected 7→15/yr by 2055 (HVAC capex compounding) — expect insurance premiums to compound above CPI over the hold.
Questions for the listing agent
- Built in 1959 — when were the roof, HVAC, electrical panel, plumbing, and water heater last replaced?
- Is there a deadline driving the sale (1031 exchange, divorce, estate, relocation)? That informs how much negotiation room exists.
- Schools are B-rated — typically a magnet for longer-tenancy family renters. What's the average tenant stay here, and is there a school-zone premium baked into asking?
- Crime grade is F in this area — have there been break-ins, vandalism, or insurance claims at this property in the last 3 years? What carrier currently insures it and at what premium?
- The area grade is low — what's the realistic commute time and amenity access for the typical tenant pool here? Any planned neighborhood developments (good or bad) we should know about?
- What's the average days-on-market for RENTAL listings here right now (not sales)? A rising rental-DOM trend means longer vacancies and softer asking-rent achievability than the comps imply.
- What's the recent tenant-quality profile in this submarket — average credit score on applications, eviction rate, late-payment / NSF rate, and stable-employment percentage? A property-management company in the area should have these aggregated.
- How much new for-sale + rental construction is in the pipeline within 1–3 miles? Heavy new supply typically softens prices + rents 12–24 months out; constrained supply supports both.
Investment metrics
- 1% rule
- 0.77% ✗
- Cap rate
- 6.30%
- Cash-on-cash
- 0.01%
- DSCR
- 1.00
- GRM
- 10.8
CMA / ARV
- ARV (on-the-fly)
- $359,600
- Comps found
- 12
Show comp detail 12 sales within ~0.75 mi
| Address | Dist | Beds/Ba | Sqft | Sold | Price | $/sf | Match |
|---|---|---|---|---|---|---|---|
| 3540 Ricardo Ave | 0.00mi | 3/1.5 | 1,550 (0%) | 1mo | $286,800 | $185 | 100 |
| 737 Estate St | 0.20mi | 3/2.0 | 1,594 (+3%) | 2mo | $288,000 | $181 | 82 |
| 3591 Adams Ln | 0.17mi | 3/2.0 | 1,584 (+2%) | 6mo | $369,900 | $234 | 82 |
| 3348 School St | 0.26mi | 3/2.0 | 1,440 (-7%) | 5mo | $304,900 | $212 | 70 |
| 952 Camino Ct | 0.23mi | 3/2.0 | 1,372 (-12%) | 3mo | $361,000 | $263 | 66 |
| 855 Jefferson Ct | 0.12mi | 4/2.0 (+1) | 1,378 (-11%) | 6mo | $320,000 | $232 | 64 |
| 1150 Bond St | 0.63mi | 3/2.0 | 1,490 (-4%) | 2mo | $135,000 | $91 | 61 |
| 3710 Indio Way | 0.62mi | 3/2.0 | 1,508 (-3%) | 6mo | $356,000 | $236 | 60 |
| 3896 Cambria Dr | 0.68mi | 3/2.0 | 1,586 (+2%) | 5mo | $365,000 | $230 | 58 |
| 1153 Ruthie Ln | 0.42mi | 3/2.0 | 1,371 (-12%) | 6mo | $345,000 | $252 | 54 |
| 609 Dee Ct | 0.54mi | 3/2.0 | 1,357 (-12%) | 6mo | $343,250 | $253 | 48 |
| 1201 Echo Rd | 0.46mi | 3/2.0 | 1,323 (-15%) | 7mo | $303,700 | $230 | 47 |
Match score weights: distance 35% · size 25% · config 20% · recency 20%. Top-matched comps best support the ARV.
Projected returns pro-forma
-3.0% appreciation · 1.88% rent growth · sell at horizon
- IRR
- -17.5%
- Equity multiple
- 0.39×
- Total profit
- $-47,748
- Equity at exit
- $41,674
- IRR
- -11.5%
- Equity multiple
- 0.34×
- Total profit
- $-51,576
- Equity at exit
- $24,166
Cash invested: $78,260 (down + closing). Projections, not guarantees.
Landlord ↔ Tenant lean methodology
- Overall (STATE)
- 18 Strongly Tenant-Friendly
- State California
- 18 Strongly Tenant-Friendly · D+13
- County
- — inherits STATE
- City
- — inherits STATE
ZIP-level market 96002
- Rents YoY
- 1.9%
- Active inventory
- 286
- Price-to-rent
- 10.8×
Monthly cashflow live
- Estimated rent
- $2,149 medium interval (Pro) →
- Mortgage (P&I)
- −$1,466
- Tax from tax record
- −$115 /mo · $1,376/yr
- Insurance
- −$116
- HOA
- −$0
- Vacancy / Maint / Mgmt
- −$451
- Net cashflow
- $1
Break-even live
Sensitivity live
| Price | -10% $159 | -5% $80 | +0% $1 | +5% $-78 | +10% $-157 |
|---|---|---|---|---|---|
| Rent | -10% $-169 | -5% $-84 | +0% $1 | +5% $86 | +10% $171 |
| Rate | -1.0pp $142 | -0.5pp $72 | base $1 | +0.5pp $-72 | +1.0pp $-145 |
UW: 25.0% down · 7.5% · 30yr · 1.5% tax · 5.0% vac · 8.0% maint · 8.0% mgmt
Financing live
Cash to close
- Down payment
- $69,875
- Closing costs
- $8,385
- Reserves months
- —
- Total cash needed
- —
Loan-product check · same deal, 3 products live
Conventional
25% down · 7.5% · 30yr
- Down + closing
- —
- Monthly P&I
- —
- Monthly cashflow
- —
- DSCR
- —
- Eligible?
- —
Personal DTI + credit; lowest rate.
DSCR
20% down · 8.5% · 30yr
- Down + closing
- —
- Monthly P&I
- —
- Monthly cashflow
- —
- DSCR
- —
- Eligible?
- —
No personal income docs; deal must DSCR.
Hard money
10% down · 12.0% · 12mo
- Down + closing
- —
- Monthly P&I
- —
- Monthly cashflow
- —
- DSCR
- —
- Eligible?
- —
Short-term bridge; refi at stabilization.
Rent comps 4 comps
| Address | Beds | Baths | Sqft | Rent | $/sqft | DOM | Units | Dist |
|---|---|---|---|---|---|---|---|---|
| 3773 Ricardo Ave Redding, CA | 3.0 | 3.0 | 1404 | $1,995 | $1.42 | 13d | 1 | 0.34mi |
| 1390 Empress Ln Redding, CA | 3.0 | 2.0 | 2140 | $2,700 | $1.26 | 13d | 1 | 0.69mi |
| 3996 Morningsun Dr Redding, CA | 3.0 | 2.0 | 1384 | $1,975 | $1.43 | 13d | 1 | 0.95mi |
| 1933 Wheeler St Redding, CA | 3.0 | 2.0 | 1242 | $2,000 | $1.61 | 13d | 1 | 1.45mi |
Listing history 8 events
-
2026-04-28status Pending
-
2026-03-30$279,500 Active
-
2026-01-16price $279,500
-
2025-09-17price $299,500
-
2025-08-23$310,000 Active
-
2025-03-05$315,000 Active
-
2024-07-22historical $1,800
-
2024-05-04$1,800
ⓘ Source: listings_history table (triggers on properties + properties_extension) + one-shot
backfill from property_details.listing_events for pre-trigger history.
Tax reassessment forecast CA · Resets to sale price
- Current annual tax
- $1,376 · $115/mo
- Projected year-2 tax
- $2,124 · $177/mo
- Expected delta
- +$749/yr (+$62/mo · 54.4%)
ⓘ Screening estimate from a state-policy table — verify with the county assessor before closing.
Climate risk First Street
- Flood 1/10 Low FEMA zone X (unshaded) · 0% chance over 30 yrs
- Wildfire 3/10 Moderate
- Heat 8/10 Severe 7 d/yr ≥105°F today · 15 d/yr by 30 yrs out
- Wind 1/10 Low
- Air quality 10/10 Extreme 37 unhealthy d/yr today · 40 by 30 yrs out
Nearby sold comps map
Loading sold comps map…
Walkable amenities ~0.75 mi
Loading nearby amenities…
Taxation est. · year 1
- Rental income
- $25,786
- − Mortgage interest
- −$15,656
- − Property taxes
- −$1,376
- − Insurance
- −$1,398
- − Repairs & maintenance
- −$2,063
- − Management
- −$2,063
- − Depreciation
- −$8,131
- Taxable loss
- −$4,900
- Est. tax savings @ 24.0%
- +$1,176
- After-tax cash flow
- $1,185/yr
For passive investors: Depreciation is non-cash, so a rental often shows a tax loss while cash-flowing — sheltering income. Rental losses are passive: they offset passive income freely, and up to $25,000/yr can offset ordinary (W-2) income if you actively participate and your MAGI is under $100k (phasing out to $0 by $150k); unused losses carry forward. On sale, claimed depreciation is recaptured at up to 25%, and gains may owe capital-gains tax (a 1031 exchange can defer both). Figures are a year-1 estimate at your 24.0% rate — not tax advice; consult a CPA.
Schools (NCES district)
- District
- Shasta Union High
- NCES district ID
- 0636600
- Math proficiency
- 41% ▲ 3.00%
- Reading proficiency
- 67% ▲ 9.00%
- Median HH income
- $50,080
- Composite
- 46.01/100
- National rank
- #2532
- State rank
- #122 of 517 in CA
Livability — Redding
- Score
- 76/100
- State rank
- #106
- US rank
- #3726
Category grades
Schools grade is shown separately in the Schools card above.
Census & demographics
- Census place
- Redding, CA
- County
- Shasta County · 147,641 people
- City population
- 112,523
- Metro
- Redding, CA
- Population (ZIP)
- 33,783
- Household income
- $73,222
- Rent vs Own
- Severe rent burden
- 1026.0
Population outlook (Shasta County) Hauer SSP2
- Today (2025)
- 179,231 people
- By 2030
- 176,953 · -1.3%
- By 2040
- 169,982 · -5.2%
- By 2050
- 162,547 · -9.3%
- By 2075
- 145,649 · -18.7%
- By 2100
- 123,025 · -31.4%
Race, ethnicity, and origin ACS 2023
- Neighborhood character
- Predominantly White (72%)
- Race & ethnicity
- White 72% Hispanic / Latino 13% Two or more races 12% Asian 6% Native American 2% Black 1%
- Hispanic origin (detail)
- Mexican 10%
- Common ancestry
- Italian 4% Lithuanian 2% Slovak 2%
- Foreign-born
- 5% · Canada
- Languages at home
- 91% English-only · Spanish 4% Other Asian/Pacific 2% Other Indo-European 1%
Political lean MEDSL · Shasta
- 2024 margin
- Solid R (+36.5) · D 30.5% · R 67.0% · Other 2.5%
- 2008→2024 swing
- -10.7pp toward R · 2008: -25.8pp · 2024: -36.5pp
- All cycles
- 2024: R+36.5 2020: R+33.1 2016: R+37.4 2012: R+30.3 2008: R+25.8
Not yet ingested
- Civics
- —
Market trends
- HPI YoY
- ▼ -248.70%
- Current HPI
- 319.713
- Rent YoY
- ▲ 1.88%
- Metro
- Redding, CA
- State GDP YoY
- ▲ 3.21%
- F500 in state
- 116
Industry mix (Fortune 500 HQ in CA)
| Industry | F500 HQs | Revenue |
|---|---|---|
| Technology | 27 | $1,492B |
|
||
| Financial Services | 3 | $174B |
|
||
| Retail | 3 | $44B |
|
||
| Insurance | 3 | $26B |
|
||
| Media / Entertainment | 2 | $115B |
|
||
| Pharmaceuticals / Biotech | 2 | $62B |
|
||
Price history
+15427.8% since first listed8 events — show timeline
- 2026-04-28 Pending — SAOR
- 2026-03-30 Listed $279,500 SAOR
- 2026-01-16 Price Changed $279,500 SAOR
- 2025-09-17 Price Changed $299,500 SAOR
- 2025-08-23 Listed $310,000 SAOR
- 2025-03-05 Listed $315,000 SAOR
- 2024-07-22 Rental Removed $1,800 APPFOLIO
- 2024-05-04 Listed for Rent $1,800 APPFOLIO
Property tax history
+1.7%/yrLatest (2025): $1,376 · +1.5% YoY. Source: county tax records.
Cash-flow waterfall
monthlySold comps — $/sqft
last 12 mo · ≤1 miLoading sold comps…