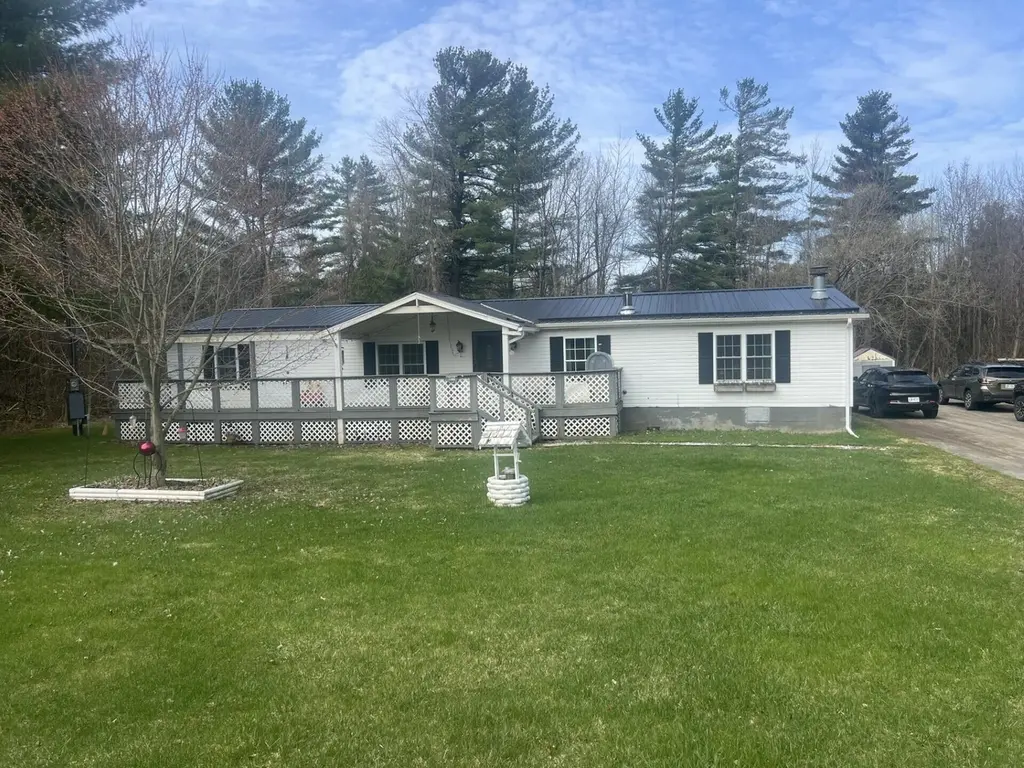
61 Bird Rd · Fort Covington, NY
Flood risk No data
- FEMA flood zone
- —
- Chance of flooding over 30 yrs
- —
- Est. flood insurance / yr
- —
Fire risk No data
- Est. fire insurance / yr
- —
Heat risk No data
- Hot days now (above threshold)
- —
- Hot days in 30 yrs
- —
Wind risk No data
- Chance of severe wind over 30 yrs
- —
Air-quality risk No data
- Unhealthy air days now
- —
- Unhealthy air days in 30 yrs
- —
Risk factors via First Street. Map © Google.
Why this score? — see what drove the D- grade
The composite is a weighted blend of 9 inputs, each scored 0–100. Each bar is that input's sub-score; the figure is the points it added to the 100-point composite (weight × sub-score).
- Cash flow +8.9/30.0
- Appreciation +8.7/10.0
- ARV discount +4.2/15.0
- Schools +3.2/10.0
- DSCR +2.5/10.0
- Rent growth +2.5/5.0
- Livability +2.5/5.0
- Condition / age +2.5/5.0
- 1% rule +2.4/10.0
$149,900
🖨 Deal sheet (PDF) 📄 Offer letter ✓ Due diligence
Listing remarks
This large 3-Bedroom 2-Bath manufactured is in excellent condition sits on 4.94 Surveyed lot with large 2-car Garage. Home has large eat in Kitchen with new Gas Stove and Dishwasher-Family room-Dinning Room and Living Room. Large covered front Porch-Has a wood burning fireplace and a Monitor heater for the Spring and fall Months as well as a newer forced air Furnace that can be converted to Propane.
Key facts
- Large eat in kitchen
- 4.94 acre lot
- Garage
Tags
Property features AI
Finance
- Other: Property includes view; Pets allowed; Crops included
Exterior
- Parking: Driveway; On-street parking available; Garage that faces the side with workshop space; Gravel/unpaved parking areas; Storage in garage
- Security: Smoke detectors; Carbon monoxide detectors
- Utilities: Private well water; Public sewer; 200+ amp electric service with circuit breakers; Electricity connected; Sewer connected; Cable available; Phone available
- Home design: Manufactured house (double wide); Updated/remodeled condition; One story
- Construction: Block and vinyl siding construction; Asphalt and metal roof; Block and slab foundation; Built as a manufactured home
- Exterior features: Covered front porch; Exterior lighting; On-site storage; Workshop; Residence with additional storage/workshop structures; Wooded lot with many trees; Back yard and front yard; Cleared, level areas
Interior
- Kitchen: Built-in gas oven; Propane cooktop; Dishwasher; Microwave; Refrigerator; Freezer; Exhaust fan; Electric water heater
- Bedrooms: 3 bedrooms on the main level
- Flooring: Laminate flooring; Vinyl flooring
- Bathrooms: 2 full bathrooms (both on the main level)
- Heating & cooling: Central heating; Forced air; Kerosene heating; Wood heating; Fireplace; Ceiling fans; No central cooling
- Interior features: Ceiling fans; Eat-in kitchen; Kitchen island; Open floor plan; Storage; Vaulted ceilings; Walk-in closets; Double-pane windows; Stone fireplace in family room
- Laundry & utility: Washer and dryer; Laundry on the main level; Generator
Neighborhood map
What this means for you Summary
Snapshot
- This is a 2-bed/2.0-bath manufactured listed at $150k.
Deal economics
- At list price, monthly cash flow is $-119 ($-1k/yr) — negative.
- To cash-flow at today's rent, offer at most $129k (14.1% below list).
- To meet the 1% rule (rent ≥ 1% of price), the offer needs to be $111k (25.8% below list).
- Recommended offer: $111k (25.8% below list) — sets the bar for 1% rule.
Location & tenants
- Location reads: area grade D — affects rentability + tenant quality, not the cash-flow math above.
- Salmon River Central School District (rural): math 34% / reading 43% proficiency, ranked #545 of 590 in NY (top 92%) — families likely to look elsewhere, expect single-tenant / working-renter base with shorter leases; 61% free/reduced lunch — lower-income household profile, screen leases tightly.
- Zoned schools: Salmon River Elementary School (math 27% / reading 37%, grade F, #1,646 of 2,108 statewide, top 80%, 317 students, 71% FRL); Salmon River Middle School (math 8% / reading 32%, grade F, #678 of 729 statewide, top 94%, 313 students, 77% FRL); Salmon River High School (math 98% / reading 72%, grade A, #374 of 1,100 statewide, top 34%, 396 students, 69% FRL).
- Market conditions: 20 active listings in the ZIP; 124 units permitted in Franklin County in 2024 (0 in 5+ unit buildings).
Forward outlook
- In year one you build about $12k of equity ($1k loan paydown + $11k appreciation (7.4% local appreciation)).
- Franklin County population projected at -14% by 2050 — secular population decline; favor cash flow + early exit over multi-decade hold.
- By year 3, paydown + projected appreciation supports a ~$30k cash-out refi (75% LTV) — recoverable capital for the next deal without selling this one.
Negotiation context
- It's been on market 58 days — a 3% lower offer ($145k) is reasonable based on typical stale-listing flexibility.
- Current owner paid $130k; 15% above their basis — modest negotiation headroom, anchor on the comps not their cost.
Questions for the listing agent
- What do current leases actually rent for vs. the listed asking? Can we see a recent rent roll and the last 12 months of T-12 income?
- It's been on market 58 days. Have you received any prior offers? Is the seller open to a 26% concession, seller financing, or rate buy-down credit?
- Is there a deadline driving the sale (1031 exchange, divorce, estate, relocation)? That informs how much negotiation room exists.
- The area grade is low — what's the realistic commute time and amenity access for the typical tenant pool here? Any planned neighborhood developments (good or bad) we should know about?
- What's the average days-on-market for RENTAL listings here right now (not sales)? A rising rental-DOM trend means longer vacancies and softer asking-rent achievability than the comps imply.
- What's the recent tenant-quality profile in this submarket — average credit score on applications, eviction rate, late-payment / NSF rate, and stable-employment percentage? A property-management company in the area should have these aggregated.
- How much new for-sale + rental construction is in the pipeline within 1–3 miles? Heavy new supply typically softens prices + rents 12–24 months out; constrained supply supports both.
Investment metrics
- 1% rule
- 0.74% ✗
- Cap rate
- 5.34%
- Cash-on-cash
- -3.42%
- DSCR
- 0.85
- GRM
- 11.2
CMA / ARV
- ARV (on-the-fly)
- $139,552
- Comps found
- 2
Show comp detail 2 sales within ~0.75 mi
| Address | Dist | Beds/Ba | Sqft | Sold | Price | $/sf | Match |
|---|---|---|---|---|---|---|---|
| 61 Bird Road Rd | 0.00mi | 3/2.0 (+1) | 1,568 (0%) | 21mo | $130,000 | $83 | 77 |
| 50 Sand St St | 0.33mi | 3/2.0 (+1) | 1,512 (-4%) | 13mo | $135,000 | $89 | 62 |
Match score weights: distance 35% · size 25% · config 20% · recency 20%. Top-matched comps best support the ARV.
Projected returns pro-forma
7.41% appreciation · 3.0% rent growth · sell at horizon
- IRR
- 16.0%
- Equity multiple
- 2.16×
- Total profit
- $48,567
- Equity at exit
- $107,960
- IRR
- 15.6%
- Equity multiple
- 4.49×
- Total profit
- $146,561
- Equity at exit
- $208,884
Cash invested: $41,972 (down + closing). Projections, not guarantees.
Landlord ↔ Tenant lean methodology
- Overall (STATE)
- 15 Strongly Tenant-Friendly
- State New York
- 15 Strongly Tenant-Friendly · D+10
- County
- — inherits STATE
- City
- — inherits STATE
ZIP-level market 12926
- Home prices YoY
- 2.6%
- Active inventory
- 20
- Price-to-rent
- 11.2×
Monthly cashflow live
- Estimated rent
- $1,113 medium interval (Pro) →
- Mortgage (P&I)
- −$786
- Tax from tax record
- −$150 /mo · $1,799/yr
- Insurance
- −$62
- HOA
- −$0
- Vacancy / Maint / Mgmt
- −$234
- Net cashflow
- $-119
Break-even live
Sensitivity live
| Price | -10% $-35 | -5% $-77 | +0% $-119 | +5% $-162 | +10% $-204 |
|---|---|---|---|---|---|
| Rent | -10% $-207 | -5% $-163 | +0% $-119 | +5% $-76 | +10% $-32 |
| Rate | -1.0pp $-44 | -0.5pp $-81 | base $-119 | +0.5pp $-158 | +1.0pp $-198 |
UW: 25.0% down · 7.5% · 30yr · 1.5% tax · 5.0% vac · 8.0% maint · 8.0% mgmt
Financing live
Cash to close
- Down payment
- $37,475
- Closing costs
- $4,497
- Reserves months
- —
- Total cash needed
- —
Loan-product check · same deal, 3 products live
Conventional
25% down · 7.5% · 30yr
- Down + closing
- —
- Monthly P&I
- —
- Monthly cashflow
- —
- DSCR
- —
- Eligible?
- —
Personal DTI + credit; lowest rate.
DSCR
20% down · 8.5% · 30yr
- Down + closing
- —
- Monthly P&I
- —
- Monthly cashflow
- —
- DSCR
- —
- Eligible?
- —
No personal income docs; deal must DSCR.
Hard money
10% down · 12.0% · 12mo
- Down + closing
- —
- Monthly P&I
- —
- Monthly cashflow
- —
- DSCR
- —
- Eligible?
- —
Short-term bridge; refi at stabilization.
Listing history 19 events
-
2026-06-21statusdays on market $149,900 Pending 58 DOM
-
2026-06-18days on market $149,900 Active 56 DOM
-
2026-06-17days on market $149,900 Active 55 DOM
-
2026-06-16days on market $149,900 Active 54 DOM
-
2026-06-15days on market $149,900 Active 53 DOM
-
2026-06-13days on market $149,900 Active 51 DOM
-
2026-06-12days on market $149,900 Active 50 DOM
-
2026-06-09days on market $149,900 Active 47 DOM
-
2026-06-08days on market $149,900 Active 46 DOM
-
2026-06-07days on market $149,900 Active 45 DOM
-
2026-06-05days on market $149,900 Active 43 DOM
-
2026-06-04days on market $149,900 Active 41 DOM
-
2026-06-02days on market $149,900 Active 40 DOM
-
2026-06-01days on market $149,900 Active 39 DOM
-
2026-05-31days on market $149,900 Active 38 DOM
-
2026-05-12price $149,900 402-char remark
-
2026-04-23price $159,900 402-char remark
-
2026-04-23$159 Active 402-char remark
-
2024-09-19soldstatus $130,000
ⓘ Source: listings_history table (triggers on properties + properties_extension) + one-shot
backfill from property_details.listing_events for pre-trigger history.
Tax reassessment forecast NY · Partial reset (capped growth)
- Current annual tax
- $1,799 · $150/mo
- Projected year-2 tax
- $2,166 · $181/mo
- Expected delta
- +$367/yr (+$31/mo · 20.4%)
ⓘ Screening estimate from a state-policy table — verify with the county assessor before closing.
Nearby sold comps map
Loading sold comps map…
Walkable amenities ~0.75 mi
Loading nearby amenities…
Taxation est. · year 1
- Rental income
- $13,351
- − Mortgage interest
- −$8,397
- − Property taxes
- −$1,799
- − Insurance
- −$750
- − Repairs & maintenance
- −$1,068
- − Management
- −$1,068
- − Depreciation
- −$4,361
- Taxable loss
- −$4,090
- Est. tax savings @ 24.0%
- +$982
- After-tax cash flow
- $-452/yr
For passive investors: Depreciation is non-cash, so a rental often shows a tax loss while cash-flowing — sheltering income. Rental losses are passive: they offset passive income freely, and up to $25,000/yr can offset ordinary (W-2) income if you actively participate and your MAGI is under $100k (phasing out to $0 by $150k); unused losses carry forward. On sale, claimed depreciation is recaptured at up to 25%, and gains may owe capital-gains tax (a 1031 exchange can defer both). Figures are a year-1 estimate at your 24.0% rate — not tax advice; consult a CPA.
Schools (NCES district)
- District
- Salmon River Central School District
- NCES district ID
- 3625500
- Math proficiency
- 34% ▼ -1.00%
- Reading proficiency
- 43% ▲ 7.00%
- Median HH income
- $39,710
- Composite
- 32.24/100
- National rank
- #5770
- State rank
- #545 of 590 in NY
Livability — Fort Covington
No livability data for this city. (Only ~50 U.S. cities are tracked.)
Census & demographics
- City population
- 1,340
- Population (ZIP)
- 2,493
Population outlook (Franklin County) Hauer SSP2
- Today (2025)
- 48,098 people
- By 2030
- 46,790 · -2.7%
- By 2040
- 44,400 · -7.7%
- By 2050
- 41,256 · -14.2%
- By 2075
- 32,190 · -33.1%
- By 2100
- 23,407 · -51.3%
Race, ethnicity, and origin ACS 2023
- Neighborhood character
- Predominantly White (97%)
- Race & ethnicity
- White 97% Two or more races 2% Native American 2%
- Common ancestry
- Lithuanian 19% Iranian 4% Slovak 3%
- Foreign-born
- 2% · Canada
- Languages at home
- 97% English-only · German/W. Germanic 2% French/Haitian/Cajun 1%
Political lean MEDSL · Franklin
- 2024 margin
- Lean R (+9.0) · D 45.5% · R 54.5%
- 2008→2024 swing
- -31.2pp toward R · 2008: 22.2pp · 2024: -9.0pp
- All cycles
- 2024: R+9.0 2020: R+2.2 2016: R+7.4 2012: D+26.3 2008: D+22.2
Not yet ingested
- Civics
- —
Market trends
- HPI YoY
- ▲ 7.41%
- Current HPI
- 290.7423
- Rent YoY
- —
- Metro
- —
- State GDP YoY
- ▲ 2.60%
- F500 in state
- 92
Industry mix (Fortune 500 HQ in NY)
| Industry | F500 HQs | Revenue |
|---|---|---|
| Financial Services | 10 | $950B |
|
||
| Consumer Goods | 9 | $162B |
|
||
| Insurance | 4 | $225B |
|
||
| Telecommunications | 2 | $144B |
|
||
| Pharmaceuticals | 2 | $112B |
|
||
| Media / Entertainment | 2 | $69B |
|
||
Price history
+15.3% since first listed4 events — show timeline
- 2026-05-12 Price Changed $149,900 ACVMLS
- 2026-04-23 Price Changed $159,900 ACVMLS
- 2026-04-23 Listed $159 ACVMLS
- 2024-09-19 Sold (Public Records) $130,000 Public Records
Property tax history
+0.3%/yrLatest (2025): $1,799 · +4.8% YoY. Source: county tax records.
Cash-flow waterfall
monthlySold comps — $/sqft
last 12 mo · ≤1 miLoading sold comps…