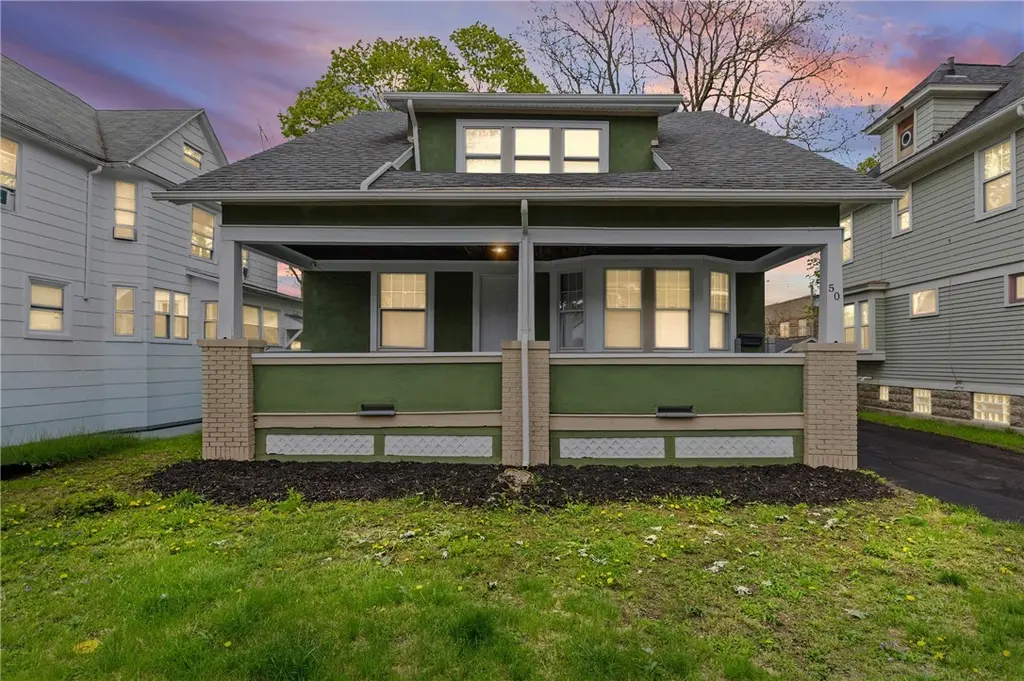
50 Finch St · Rochester, NY
Flood risk 1/10 · Minimal
- FEMA flood zone
- X (unshaded)
- Chance of flooding over 30 yrs
- 0.0%
- Est. flood insurance / yr
- $473 – $860
Fire risk 1/10 · Minimal
- Est. fire insurance / yr
- $691 – $1,283
Heat risk 2/10 · Minimal
- Hot days now (above 95°F)
- 7 days/yr
- Hot days in 30 yrs
- 15 days/yr
Wind risk 1/10 · Minimal
- Chance of severe wind over 30 yrs
- —
Air-quality risk 2/10 · Minimal
- Unhealthy air days now
- 1 days/yr
- Unhealthy air days in 30 yrs
- 2 days/yr
Risk factors via First Street. Map © Google.
Why this score? — see what drove the C+ grade
The composite is a weighted blend of 9 inputs, each scored 0–100. Each bar is that input's sub-score; the figure is the points it added to the 100-point composite (weight × sub-score).
- Cash flow +26.7/30.0
- DSCR +9.2/10.0
- ARV discount +6.3/15.0
- 1% rule +6.0/10.0
- Livability +3.8/5.0
- Rent growth +2.5/5.0
- Condition / age +2.5/5.0
- Appreciation +2.2/10.0
- Schools +1.9/10.0
$144,900
🖨 Deal sheet 📄 Offer letter ✓ Due diligence
Listing remarks
This Spectacular 5 bed, 2 full bath Colonial has it all! TURN KEY, 50 Finch St is located in the heart of the vibrant City of Rochester! Just mins from Aquinas Institute Of Rochester & Expressway 104. Offering over 1,900 SQFT, this spacious home makes an immediate impression with its long, freshly sealed driveway & oversized open front porch. Featuring low maintenance stucco siding, this property is built for ease, with a fully fenced backyard ideal for entertaining, pets, or added privacy. From the expansive front porch, step inside to rich NATURAL WOODWORK & REFINISHED HARDWOODS throughout. The layout opens effortlessly into a SPACIOUS LIVING ROOM & formal dinning
Key facts
- New h20 tank
- Walk-in pantry
- 4,791 sq ft lot
Tags
Property features AI
Exterior
- Parking: No garage
- Utilities: Public water connected; Sewer connected
- Home design: 2-story house; Existing (year built unknown)
- Construction: Stucco exterior; Shingle roof; Block foundation
- Exterior features: Blacktop driveway; Near public transit; Rectangular residential lot; City street frontage; Lot dimensions approximately 45 x 130
Interior
- Kitchen: Electric cooktop; Microwave; Refrigerator
- Bedrooms: 2 main-level bedrooms; Total rooms: 10; Includes bedroom and living room among room types; Has a full basement
- Flooring: Carpet; Hardwood; Luxury vinyl; Tile; Vinyl; Varies
- Bathrooms: 2 full bathrooms; 1 main-level bathroom
- Heating & cooling: Gas forced-air heating; Has heating
- Interior features: Breakfast bar; Separate/formal dining room; Separate/formal living room; Combined living/dining room; Walk-in pantry; Natural woodwork; Bedroom on main level; Main level primary
- Laundry & utility: Gas water heater
Neighborhood map
What this means for you Summary
Snapshot
- This is a 4-bed/2.0-bath single-family listed at $145k.
Deal economics
- At list price, monthly cash flow is $391 ($5k/yr) — positive.
- The deal already cash-flows at list — no discount required.
- Meets the 1% rule at list price ($2k rent vs $145k).
Location & tenants
- Location reads 76/100 on livability (#222 in NY, #3,482 nationally) — a middle-class / working-renter tenant base. Strengths: commute A+, cost of living A+, housing A+; Watch: schools D+, crime F, employment F.
- Rochester City School District (urban): math 21% / reading 26% proficiency, ranked #589 of 590 in NY (top 100%) — low school quality limits family demand, transient renter base, plan for 1-2y turnover; 82% free/reduced lunch — lower-income household profile, screen leases tightly.
- Market conditions: 71 active listings in the ZIP; 12 comparable units currently listed for rent nearby; rentals at typical pace (median 21d on market — plan ~3-4 weeks tenant-placement turnaround); 1,169 units permitted in Monroe County in 2024 (591 in 5+ unit buildings).
Forward outlook
- Local home prices are declining (-3.0%/yr); year-one equity from $1k of loan paydown is wiped out by about $4k of value loss. Plan a longer hold.
- Monroe County population projected to shrink 6% by 2050 — rents likely to lag national; underwrite the cash flow, not the appreciation.
- At projected returns (-3.0% appreciation + 3.0% rent growth), your $41k cash investment doubles in ~10 years — after that, you're playing with house money.
Negotiation context
- Only 11 days on market — expect competitive offers; lowballing is unlikely to land.
- Current owner paid $35k; list at $145k implies a 314% gain — meaningful room to come down on a strong offer.
Risks & watch-outs
- Watch-outs: built in 1910 — expect roof / HVAC / electrical / plumbing capex.
Questions for the listing agent
- Built in 1910 — when were the roof, HVAC, electrical panel, plumbing, and water heater last replaced?
- Is there a deadline driving the sale (1031 exchange, divorce, estate, relocation)? That informs how much negotiation room exists.
- Schools are D-rated, which usually means shorter tenancies and higher turnover. Who's the typical renter profile here, and what's been the actual vacancy rate?
- Crime grade is F in this area — have there been break-ins, vandalism, or insurance claims at this property in the last 3 years? What carrier currently insures it and at what premium?
- What's the average days-on-market for RENTAL listings here right now (not sales)? A rising rental-DOM trend means longer vacancies and softer asking-rent achievability than the comps imply.
- What's the recent tenant-quality profile in this submarket — average credit score on applications, eviction rate, late-payment / NSF rate, and stable-employment percentage? A property-management company in the area should have these aggregated.
- How much new for-sale + rental construction is in the pipeline within 1–3 miles? Heavy new supply typically softens prices + rents 12–24 months out; constrained supply supports both.
Investment metrics
- 1% rule
- 1.10% ✓
- Cap rate
- 9.53%
- Cash-on-cash
- 11.58%
- DSCR
- 1.52
- GRM
- 7.6
CMA / ARV
- ARV (median comp)
- $141,006
- List price
- $144,900
- Delta
- 2.76%
- Verdict
- FAIR
- Comps
- 20 within 1.0 mi
Show comp detail 12 sales within ~0.75 mi
| Address | Dist | Beds/Ba | Sqft | Sold | Price | $/sf | Match |
|---|---|---|---|---|---|---|---|
| 371 Glenwood Ave | 0.12mi | 4/2.0 | 1,830 (-4%) | 5mo | $168,000 | $92 | 83 |
| 320 Ravine Ave | 0.25mi | 4/2.0 | 1,923 (+0%) | 6mo | $140,000 | $73 | 83 |
| 309 Emerson St | 0.37mi | 4/1.5 | 1,725 (-10%) | 4mo | $65,000 | $38 | 61 |
| 416 Augustine St | 0.56mi | 4/2.0 | 1,764 (-8%) | 1mo | $202,000 | $115 | 60 |
| 128 Bryan St | 0.43mi | 3/1.5 (-1) | 1,740 (-9%) | 3mo | $160,000 | $92 | 55 |
| 170 Otis St | 0.66mi | 5/3.0 (+1) | 1,830 (-4%) | 0mo | $190,000 | $104 | 52 |
| 205 Albemarle St | 0.68mi | 4/1.0 | 1,780 (-7%) | 6mo | $175,000 | $98 | 48 |
| 135 Albemarle St | 0.71mi | 4/2.0 | 1,732 (-10%) | 4mo | $205,000 | $118 | 47 |
| 361 Augustine St | 0.52mi | 4/2.0 | 1,638 (-14%) | 6mo | $200,000 | $122 | 47 |
| 505 Augustine St | 0.57mi | 4/1.0 | 1,678 (-12%) | 3mo | $160,000 | $95 | 46 |
| 200 Albemarle St | 0.71mi | 5/2.0 (+1) | 1,672 (-13%) | 2mo | $195,000 | $117 | 39 |
| 174 Alameda St | 0.66mi | 3/1.5 (-1) | 1,658 (-13%) | 3mo | $175,000 | $106 | 37 |
Match score weights: distance 35% · size 25% · config 20% · recency 20%. Top-matched comps best support the ARV.
Projected returns pro-forma
-3.0% appreciation · 3.0% rent growth · sell at horizon
- IRR
- 0.9%
- Equity multiple
- 1.03×
- Total profit
- $1,391
- Equity at exit
- $21,605
- IRR
- 10.5%
- Equity multiple
- 1.82×
- Total profit
- $33,080
- Equity at exit
- $12,528
Cash invested: $40,572 (down + closing). Projections, not guarantees.
Landlord ↔ Tenant lean methodology
- Overall (STATE)
- 15 Strongly Tenant-Friendly
- State New York
- 15 Strongly Tenant-Friendly · D+10
- County
- — inherits STATE
- City
- — inherits STATE
ZIP-level market 14613
- Home prices YoY
- -2.0%
- Active inventory
- 71
- Price-to-rent
- 7.6×
Monthly cashflow live
- Estimated rent
- $1,597 high interval (Pro) →
- Mortgage (P&I)
- −$760
- Tax from tax record
- −$50 /mo · $601/yr
- Insurance
- −$60
- HOA
- −$0
- Vacancy / Maint / Mgmt
- −$335
- Net cashflow
- $391
Break-even live
UW: 25.0% down · 7.5% · 30yr · 1.5% tax · 5.0% vac · 8.0% maint · 8.0% mgmt
Financing live
Cash to close
- Down payment
- $36,225
- Closing costs
- $4,347
- Reserves months
- —
- Total cash needed
- —
Loan-product check · same deal, 3 products live
Conventional
25% down · 7.5% · 30yr
- Down + closing
- —
- Monthly P&I
- —
- Monthly cashflow
- —
- DSCR
- —
- Eligible?
- —
Personal DTI + credit; lowest rate.
DSCR
20% down · 8.5% · 30yr
- Down + closing
- —
- Monthly P&I
- —
- Monthly cashflow
- —
- DSCR
- —
- Eligible?
- —
No personal income docs; deal must DSCR.
Hard money
10% down · 12.0% · 12mo
- Down + closing
- —
- Monthly P&I
- —
- Monthly cashflow
- —
- DSCR
- —
- Eligible?
- —
Short-term bridge; refi at stabilization.
Rent comps 12 comps
| Address | Beds | Baths | Sqft | Rent | $/sqft | DOM | Units | Dist |
|---|---|---|---|---|---|---|---|---|
| 327 Glenwood Ave Rochester, NY | 3.0 | 1.0 | 2012 | $1,690 | $0.84 | 3d | 1 | 0.12mi |
| 98 Pierpont St Rochester, NY | 3.0 | 1.0 | 1973 | $1,295 | $0.66 | 43d | 1 | 0.28mi |
| 1016 Lake Ave Unit 1 Rochester, NY | 3.0 | 1.0 | 1300 | $1,600 | $1.23 | 43d | 1 | 0.62mi |
| 28-30 Carthage Dr Unit 28 Rochester, NY | 3.0 | 1.0 | 1415 | $1,600 | $1.13 | 23d | 1 | 0.70mi |
| 287 Electric Ave Rochester, NY | 3.0 | 1.5 | 1297 | $1,500 | $1.16 | 2d | 1 | 0.88mi |
| 768 Flower City Park Rochester, NY | 3.0 | 1.0 | 1995 | $1,995 | $1.00 | 10d | 1 | 1.08mi |
| 235 Flower City Park Rochester, NY | 3.0 | 1.0 | 2000 | $1,360 | $0.68 | 43d | 1 | 1.09mi |
| 248 Flower City Park Rochester, NY | 3.0 | 1.0 | 1350 | $1,800 | $1.33 | 3d | 1 | 1.12mi |
| 649 Jay St Rochester, NY | 5.0 | 2.0 | 2144 | $2,000 | $0.93 | 3d | 1 | 1.30mi |
| 2 Jay St Unit 2 Rochester, NY | 3.0 | 1.0 | 1252 | $1,045 | $0.83 | 43d | 1 | 1.38mi |
| 385 Ames St Rochester, NY | 3.0 | 1.5 | 1738 | $1,500 | $0.86 | 21d | 1 | 1.40mi |
| 108 Wetmore Park Rochester, NY | 3.0 | 2.0 | 1278 | $1,900 | $1.49 | 10d | 1 | 1.41mi |
Listing history 3 events
-
2026-05-15status Pending 1807-char remark
-
2026-05-05$144,900 Active 1807-char remark
-
2000-07-11soldstatus $35,000
ⓘ Source: listings_history table (triggers on properties + properties_extension) + one-shot
backfill from property_details.listing_events for pre-trigger history.
Tax reassessment forecast NY · Partial reset (capped growth)
- Current annual tax
- $601 · $50/mo
- Projected year-2 tax
- $1,525 · $127/mo
- Expected delta
- +$924/yr (+$77/mo · 153.6%)
ⓘ Screening estimate from a state-policy table — verify with the county assessor before closing.
Climate risk First Street
- Flood 1/10 Low FEMA zone X (unshaded) · 0% chance over 30 yrs
- Wildfire 1/10 Low
- Heat 2/10 Low 7 d/yr ≥95°F today · 15 d/yr by 30 yrs out
- Wind 1/10 Low
- Air quality 2/10 Low 1 unhealthy d/yr today · 2 by 30 yrs out
Nearby sold comps map
Loading sold comps map…
Walkable amenities ~0.75 mi
Loading nearby amenities…
Taxation est. · year 1
- Rental income
- $19,166
- − Mortgage interest
- −$8,117
- − Property taxes
- −$601
- − Insurance
- −$724
- − Repairs & maintenance
- −$1,533
- − Management
- −$1,533
- − Depreciation
- −$4,215
- Taxable income
- $2,441
- Est. tax owed @ 24.0%
- −$586
- After-tax cash flow
- $4,111/yr
For passive investors: Depreciation is non-cash, so a rental often shows a tax loss while cash-flowing — sheltering income. Rental losses are passive: they offset passive income freely, and up to $25,000/yr can offset ordinary (W-2) income if you actively participate and your MAGI is under $100k (phasing out to $0 by $150k); unused losses carry forward. On sale, claimed depreciation is recaptured at up to 25%, and gains may owe capital-gains tax (a 1031 exchange can defer both). Figures are a year-1 estimate at your 24.0% rate — not tax advice; consult a CPA.
Schools (NCES district)
- District
- Rochester City School District
- NCES district ID
- 3624750
- Math proficiency
- 21% ▬ 0.00%
- Reading proficiency
- 26% ▲ 4.00%
- Median HH income
- $30,923
- Composite
- 18.98/100
- National rank
- #8850
- State rank
- #589 of 590 in NY
Livability — Rochester
- Score
- 76/100
- State rank
- #222
- US rank
- #3482
Category grades
Schools grade is shown separately in the Schools card above.
Census & demographics
- Census place
- Rochester, NY
- City population
- 432,803
- Population (ZIP)
- 14,740
Population outlook (Monroe County) Hauer SSP2
- Today (2025)
- 759,460 people
- By 2030
- 757,154 · -0.3%
- By 2040
- 740,644 · -2.5%
- By 2050
- 714,443 · -5.9%
- By 2075
- 645,883 · -15.0%
- By 2100
- 547,084 · -28.0%
Race, ethnicity, and origin ACS 2023
- Neighborhood character
- Highly diverse neighborhood (Simpson 0.70)
- Race & ethnicity
- Black 45% White 22% Hispanic / Latino 20% Two or more races 10% Asian 8% Pacific Islander 1%
- Hispanic origin (detail)
- Puerto Rican 16% Dominican 3%
- Common ancestry
- British 2% Serbian 1% Romanian 1%
- Foreign-born
- 13% · Canada, India, Philippines
- Languages at home
- 79% English-only · Spanish 12% Other Asian/Pacific 5% Other Indo-European 3%
Political lean MEDSL · Monroe
- 2024 margin
- D (+19.1) · D 59.5% · R 40.5%
- 2008→2024 swing
- +1.4pp toward D · 2008: 17.7pp · 2024: 19.1pp
- All cycles
- 2024: D+19.1 2020: D+21.0 2016: D+14.1 2012: D+17.4 2008: D+17.7
Not yet ingested
- Civics
- —
Market trends
- HPI YoY
- ▼ -5.56%
- Current HPI
- 274.2485
- Rent YoY
- —
- Metro
- —
- State GDP YoY
- ▲ 2.60%
- F500 in state
- 92
Industry mix (Fortune 500 HQ in NY)
| Industry | F500 HQs | Revenue |
|---|---|---|
| Financial Services | 10 | $950B |
|
||
| Consumer Goods | 9 | $162B |
|
||
| Insurance | 4 | $225B |
|
||
| Telecommunications | 2 | $144B |
|
||
| Pharmaceuticals | 2 | $112B |
|
||
| Media / Entertainment | 2 | $69B |
|
||
Price history
+314.0% since first listed3 events — show timeline
- 2026-05-15 Pending — UNYREIS
- 2026-05-05 Listed $144,900 UNYREIS
- 2000-07-11 Sold (Public Records) $35,000 Public Records
Property tax history
-0.9%/yrLatest (2025): $601 · -3.9% YoY. Source: county tax records.
Cash-flow waterfall
monthlySold comps — $/sqft
last 12 mo · ≤1 miLoading sold comps…