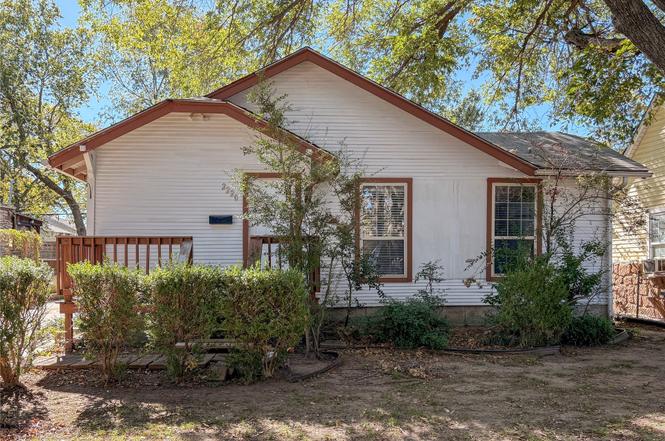
2220 W 40th St · Tulsa, OK
Flood risk 1/10 · Minimal
- FEMA flood zone
- X (unshaded)
- Chance of flooding over 30 yrs
- 0.0%
- Est. flood insurance / yr
- $473 – $860
Fire risk 4/10 · Minor
- Est. fire insurance / yr
- $2,463 – $4,575
Heat risk 7/10 · Major
- Hot days now (above 111°F)
- 7 days/yr
- Hot days in 30 yrs
- 18 days/yr
Wind risk 2/10 · Minimal
- Chance of severe wind over 30 yrs
- 4.0%
Air-quality risk 3/10 · Minor
- Unhealthy air days now
- 2 days/yr
- Unhealthy air days in 30 yrs
- 3 days/yr
Risk factors via First Street. Map © Google.
Why this score? — see what drove the B grade
The composite is a weighted blend of 9 inputs, each scored 0–100. Each bar is that input's sub-score; the figure is the points it added to the 100-point composite (weight × sub-score).
- Cash flow +30.0/30.0
- ARV discount +15.0/15.0
- 1% rule +10.0/10.0
- DSCR +10.0/10.0
- Livability +3.8/5.0
- Rent growth +2.7/5.0
- Condition / age +2.5/5.0
- Schools +0.8/10.0
- Appreciation +0.0/10.0
$100,000
🖨 Deal sheet 📄 Offer letter ✓ Due diligence
Listing remarks
Three bedroom home with neutral paint throughout, hardwood floors and plenty of storage. Original hardwood floors, large closets, spacious kitchen, indoor laundry. Back deck, privacy fencing and detached garage with additional storage. Quick access to I- 244, Hwy 75, Tulsa Hills and Downtown Tulsa!
Key facts
- Privacy fencing
- Spacious kitchen
- Large closets
Tags
Neighborhood map
What this means for you Summary
Snapshot
- This is a 3-bed/1.0-bath single-family listed at $100k.
Deal economics
- At list price, monthly cash flow is $617 ($7k/yr) — positive.
- The deal already cash-flows at list — no discount required.
- Meets the 1% rule at list price ($2k rent vs $100k).
- Cap rate 13.7% vs local median 3.9% in Tulsa — top-decile yield for the area; either an underpriced asset or a hidden risk that comps aren't pricing in. Stress-test before assuming the spread holds.
Location & tenants
- Location reads 75/100 on livability (#13 in OK, #4,058 nationally) — a middle-class / working-renter tenant base. Strengths: amenities A+, commute A+, cost of living A+; Watch: schools F, crime F, employment D-.
- Tulsa (urban): math 7% / reading 12% proficiency, ranked #250 of 270 in OK (top 93%) — low school quality limits family demand, transient renter base, plan for 1-2y turnover; 76% free/reduced lunch — lower-income household profile, screen leases tightly.
- Market conditions: Rents flat; 99 active listings in the ZIP; 9 comparable units currently listed for rent nearby; rentals at typical pace (median 21d on market — plan ~3-4 weeks tenant-placement turnaround); 2,818 units permitted in Tulsa County in 2024 (518 in 5+ unit buildings).
- This rent runs 36% of the median local income ($54k/yr) — at the standard rent-burdened threshold; future hikes will face affordability resistance.
Forward outlook
- Local home prices are declining (-3.0%/yr); year-one equity from $691 of loan paydown is wiped out by about $3k of value loss. Plan a longer hold.
- Tulsa County population projected at +30% by 2050 — long-run rental-demand tailwind backs the buy-and-hold thesis.
- At projected returns (-3.0% appreciation + 0.8% rent growth), your $28k cash investment doubles in ~6 years — after that, you're playing with house money.
Negotiation context
- Only 7 days on market — expect competitive offers; lowballing is unlikely to land.
- 2 sale attempts with the ask held roughly flat each time — persistent listings suggest the price (not the market) is what's stuck; bring a comps-based counter.
Risks & watch-outs
- Watch-outs: built in 1926 — expect roof / HVAC / electrical / plumbing capex.
- Climate carrying-cost: extreme-heat days projected 7→18/yr by 2055 (HVAC capex compounding) — expect insurance premiums to compound above CPI over the hold.
Questions for the listing agent
- Built in 1926 — when were the roof, HVAC, electrical panel, plumbing, and water heater last replaced?
- Is there a deadline driving the sale (1031 exchange, divorce, estate, relocation)? That informs how much negotiation room exists.
- Schools are F-rated, which usually means shorter tenancies and higher turnover. Who's the typical renter profile here, and what's been the actual vacancy rate?
- Crime grade is F in this area — have there been break-ins, vandalism, or insurance claims at this property in the last 3 years? What carrier currently insures it and at what premium?
- What's the average days-on-market for RENTAL listings here right now (not sales)? A rising rental-DOM trend means longer vacancies and softer asking-rent achievability than the comps imply.
- What's the recent tenant-quality profile in this submarket — average credit score on applications, eviction rate, late-payment / NSF rate, and stable-employment percentage? A property-management company in the area should have these aggregated.
- How much new for-sale + rental construction is in the pipeline within 1–3 miles? Heavy new supply typically softens prices + rents 12–24 months out; constrained supply supports both.
Investment metrics
- 1% rule
- 1.59% ✓
- Cap rate
- 13.70%
- Cash-on-cash
- 26.45%
- DSCR
- 2.18
- GRM
- 5.3
CMA / ARV
- ARV (on-the-fly)
- $189,046
- Comps found
- 12
Show comp detail 12 sales within ~0.75 mi
| Address | Dist | Beds/Ba | Sqft | Sold | Price | $/sf | Match |
|---|---|---|---|---|---|---|---|
| 2303 W 40th St | 0.04mi | 3/2.0 | 1,465 (+11%) | 2mo | $184,900 | $126 | 74 |
| 2239 W 45th St | 0.42mi | 3/1.5 | 1,390 (+5%) | 3mo | $199,000 | $143 | 67 |
| 4116 S 31st West Ave | 0.53mi | 3/2.0 | 1,315 (-0%) | 4mo | $180,000 | $137 | 67 |
| 3619 S 29th West Ave | 0.57mi | 3/2.0 | 1,257 (-5%) | 1mo | $141,000 | $112 | 61 |
| 4606 S 27th WestAvenue | 0.63mi | 3/2.0 | 1,281 (-3%) | 2mo | $245,000 | $191 | 60 |
| 3817 S 29th WestAvenue | 0.42mi | 3/2.0 | 1,202 (-9%) | 3mo | $155,000 | $129 | 59 |
| 4610 S 27th WestAvenue | 0.64mi | 3/2.0 | 1,281 (-3%) | 5mo | $245,000 | $191 | 57 |
| 4310 S Union Ave | 0.49mi | 3/1.0 | 1,192 (-10%) | 5mo | $190,000 | $159 | 57 |
| 3808 S 31st West Ave | 0.53mi | 4/2.0 (+1) | 1,260 (-5%) | 3mo | $185,000 | $147 | 56 |
| 4603 S Waco Ave | 0.62mi | 4/1.5 (+1) | 1,449 (+10%) | 6mo | $200,000 | $138 | 44 |
| 4718 S 25th WestAvenue | 0.73mi | 3/2.0 | 1,144 (-14%) | 3mo | $189,900 | $166 | 36 |
| 2317 W 47th Pl | 0.73mi | 2/2.0 (-1) | 1,190 (-10%) | 6mo | $125,000 | $105 | 36 |
Match score weights: distance 35% · size 25% · config 20% · recency 20%. Top-matched comps best support the ARV.
Projected returns pro-forma
-3.0% appreciation · 0.78% rent growth · sell at horizon
- IRR
- 17.8%
- Equity multiple
- 1.70×
- Total profit
- $19,627
- Equity at exit
- $14,910
- IRR
- 24.7%
- Equity multiple
- 2.93×
- Total profit
- $54,062
- Equity at exit
- $8,646
Cash invested: $28,000 (down + closing). Projections, not guarantees.
Landlord ↔ Tenant lean methodology
- Overall (STATE)
- 83 Strongly Landlord-Friendly
- State Oklahoma
- 83 Strongly Landlord-Friendly · R+20
- County
- — inherits STATE
- City
- — inherits STATE
ZIP-level market 74107
- Home prices YoY
- -15.3%
- Rents YoY
- 0.8%
- Active inventory
- 99
- Price-to-rent
- 5.3×
Monthly cashflow live
- Estimated rent
- $1,586 high interval (Pro) →
- Mortgage (P&I)
- −$524
- Tax from tax record
- −$70 /mo · $834/yr
- Insurance
- −$42
- HOA
- −$0
- Vacancy / Maint / Mgmt
- −$333
- Net cashflow
- $617
Break-even live
UW: 25.0% down · 7.5% · 30yr · 1.5% tax · 5.0% vac · 8.0% maint · 8.0% mgmt
Financing live
Cash to close
- Down payment
- $25,000
- Closing costs
- $3,000
- Reserves months
- —
- Total cash needed
- —
Loan-product check · same deal, 3 products live
Conventional
25% down · 7.5% · 30yr
- Down + closing
- —
- Monthly P&I
- —
- Monthly cashflow
- —
- DSCR
- —
- Eligible?
- —
Personal DTI + credit; lowest rate.
DSCR
20% down · 8.5% · 30yr
- Down + closing
- —
- Monthly P&I
- —
- Monthly cashflow
- —
- DSCR
- —
- Eligible?
- —
No personal income docs; deal must DSCR.
Hard money
10% down · 12.0% · 12mo
- Down + closing
- —
- Monthly P&I
- —
- Monthly cashflow
- —
- DSCR
- —
- Eligible?
- —
Short-term bridge; refi at stabilization.
Rent comps 9 comps
| Address | Beds | Baths | Sqft | Rent | $/sqft | DOM | Units | Dist |
|---|---|---|---|---|---|---|---|---|
| 1936 W 40th St Tulsa, OK | 2.0 | 2.0 | 1286 | $2,150 | $1.67 | 21d | 1 | 0.14mi |
| 3817 S 29th West Ave Tulsa, OK | 3.0 | 2.0 | 1202 | $1,350 | $1.12 | 23d | 1 | 0.43mi |
| 4328 S 27th West Ave Tulsa, OK | 3.0 | 1.5 | 1606 | $1,650 | $1.03 | 23d | 1 | 0.43mi |
| 4128 S 32nd West Ave Tulsa, OK | 3.0 | 1.0 | 957 | $1,175 | $1.23 | 1d | 1 | 0.60mi |
| 1913 W 50th St Tulsa, OK | 3.0 | 2.0 | 1082 | $1,195 | $1.10 | 23d | 1 | 1.00mi |
| 3722 W 44th St Tulsa, OK | 3.0 | 1.0 | 1043 | $1,150 | $1.10 | 1d | 1 | 1.04mi |
| 4847 S 32nd West Ave Tulsa, OK | 3.0 | 1.0 | 876 | $1,200 | $1.37 | 16d | 1 | 1.07mi |
| 5031 S 30th West Ave Tulsa, OK | 2.0 | 1.0 | 987 | $1,095 | $1.11 | 21d | 1 | 1.09mi |
| 4956 S Maybelle Ave Tulsa, OK | 3.0 | 1.0 | 933 | $1,395 | $1.50 | 14d | 1 | 1.34mi |
Listing history 5 events
-
2025-12-12status Pending
-
2025-12-05$100,000 Active
-
2025-11-03status Pending
-
2025-11-03historical
-
2025-10-22$100,000 Active
ⓘ Source: listings_history table (triggers on properties + properties_extension) + one-shot
backfill from property_details.listing_events for pre-trigger history.
Tax reassessment forecast OK · Resets to sale price
- Current annual tax
- $834 · $70/mo
- Projected year-2 tax
- $900 · $75/mo
- Expected delta
- +$66/yr (+$5/mo · 7.9%)
ⓘ Screening estimate from a state-policy table — verify with the county assessor before closing.
Climate risk First Street
- Flood 1/10 Low FEMA zone X (unshaded) · 0% chance over 30 yrs
- Wildfire 4/10 Moderate
- Heat 7/10 Severe 7 d/yr ≥111°F today · 18 d/yr by 30 yrs out
- Wind 2/10 Low 4% chance of damaging wind over 30 yrs
- Air quality 3/10 Moderate 2 unhealthy d/yr today · 3 by 30 yrs out
Nearby sold comps map
Loading sold comps map…
Walkable amenities ~0.75 mi
Loading nearby amenities…
Taxation est. · year 1
- Rental income
- $19,029
- − Mortgage interest
- −$5,602
- − Property taxes
- −$834
- − Insurance
- −$500
- − Repairs & maintenance
- −$1,522
- − Management
- −$1,522
- − Depreciation
- −$2,909
- Taxable income
- $6,140
- Est. tax owed @ 24.0%
- −$1,473
- After-tax cash flow
- $5,932/yr
For passive investors: Depreciation is non-cash, so a rental often shows a tax loss while cash-flowing — sheltering income. Rental losses are passive: they offset passive income freely, and up to $25,000/yr can offset ordinary (W-2) income if you actively participate and your MAGI is under $100k (phasing out to $0 by $150k); unused losses carry forward. On sale, claimed depreciation is recaptured at up to 25%, and gains may owe capital-gains tax (a 1031 exchange can defer both). Figures are a year-1 estimate at your 24.0% rate — not tax advice; consult a CPA.
Schools (NCES district)
- District
- Tulsa
- NCES district ID
- 4030240
- Math proficiency
- 7% ▼ -9.00%
- Reading proficiency
- 12% ▼ -7.00%
- Median HH income
- $37,895
- Composite
- 8.04/100
- National rank
- #9919
- State rank
- #250 of 270 in OK
Livability — Tulsa
- Score
- 75/100
- State rank
- #13
- US rank
- #4058
Category grades
Schools grade is shown separately in the Schools card above.
Census & demographics
- Census place
- Tulsa, OK
- County
- Tulsa County · 640,811 people
- City population
- 389,418
- Metro
- Tulsa, OK
- Population (ZIP)
- 19,013
- Household income
- $53,505
- Rent vs Own
- Severe rent burden
- 667.0
Population outlook (Tulsa County) Hauer SSP2
- Today (2025)
- 723,846 people
- By 2030
- 766,033 · +5.8%
- By 2040
- 851,386 · +17.6%
- By 2050
- 938,389 · +29.6%
- By 2075
- 1,166,011 · +61.1%
- By 2100
- 1,350,277 · +86.5%
Race, ethnicity, and origin ACS 2023
- Neighborhood character
- Diverse neighborhood (Simpson 0.63)
- Race & ethnicity
- White 59% Two or more races 18% Hispanic / Latino 11% Black 8% Native American 6% Pacific Islander 2% Asian 1%
- Hispanic origin (detail)
- Mexican 8% Puerto Rican 1%
- Common ancestry
- Lithuanian 2% Slovak 2% Italian 1%
- Foreign-born
- 4% · Canada
- Languages at home
- 90% English-only · Spanish 7% Other Asian/Pacific 2%
Political lean MEDSL · Tulsa
- 2024 margin
- R (+15.2) · D 41.3% · R 56.5% · Other 2.2%
- 2008→2024 swing
- +9.2pp toward D · 2008: -24.5pp · 2024: -15.2pp
- All cycles
- 2024: R+15.2 2020: R+15.6 2016: R+22.9 2012: R+27.4 2008: R+24.5
Not yet ingested
- Civics
- —
Market trends
- HPI YoY
- ▼ -42.46%
- Current HPI
- 235.2296
- Rent YoY
- ▲ 0.78%
- Metro
- Tulsa, OK
- State GDP YoY
- ▲ 1.55%
- F500 in state
- 6
Industry mix (Fortune 500 HQ in OK)
| Industry | F500 HQs | Revenue |
|---|---|---|
| Energy | 3 | $48B |
|
||
Price history
+0.0% since first listed5 events — show timeline
- 2025-12-12 Pending — MLS Technology, Inc.
- 2025-12-05 Listed $100,000 MLS Technology, Inc.
- 2025-11-03 Pending — MLS Technology, Inc.
- 2025-11-03 Listing Removed — MLS Technology, Inc.
- 2025-10-22 Listed $100,000 MLS Technology, Inc.
Property tax history
+2.1%/yrLatest (2025): $834 · +7.1% YoY. Source: county tax records.
Cash-flow waterfall
monthlySold comps — $/sqft
last 12 mo · ≤1 miLoading sold comps…