 🏗️ New Construction
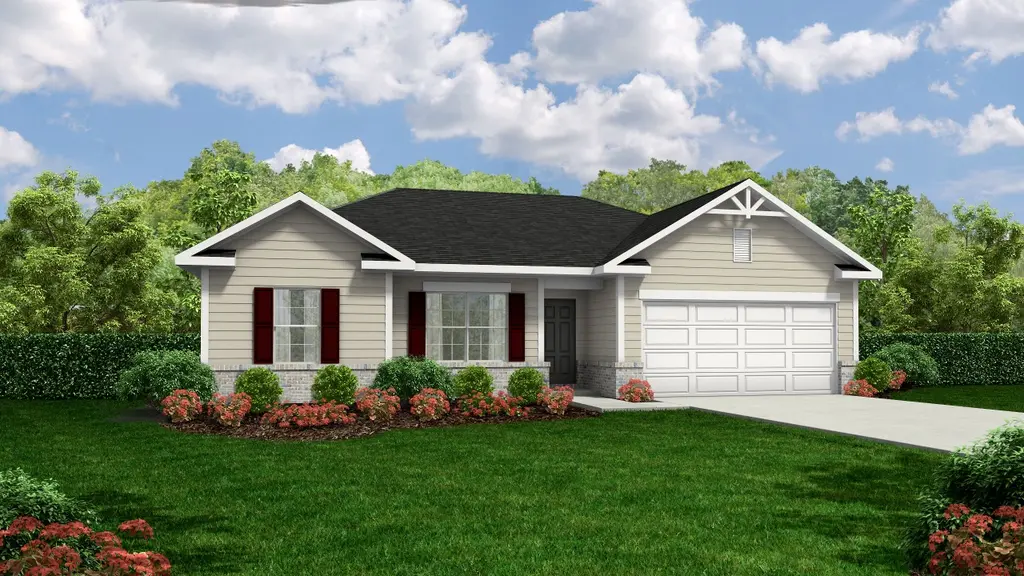
Stafford Plan · Hinesville, GA
Flood risk 1/10 · Minimal
- FEMA flood zone
- X (unshaded)
- Chance of flooding over 30 yrs
- 0.0%
- Est. flood insurance / yr
- $507 – $1,088
Fire risk 6/10 · Moderate
- Est. fire insurance / yr
- $963 – $1,789
Heat risk 8/10 · Major
- Hot days now (above 111°F)
- 6 days/yr
- Hot days in 30 yrs
- 16 days/yr
Wind risk 8/10 · Major
- Chance of severe wind over 30 yrs
- 97.0%
Air-quality risk 2/10 · Minimal
- Unhealthy air days now
- 2 days/yr
- Unhealthy air days in 30 yrs
- 2 days/yr
Risk factors via First Street. Map © Google.
Why this score? — see what drove the F grade
The composite is a weighted blend of 9 inputs, each scored 0–100. Each bar is that input's sub-score; the figure is the points it added to the 100-point composite (weight × sub-score).
- Cash flow +7.9/30.0
- ARV discount +7.5/15.0
- Rent growth +3.9/5.0
- Livability +3.7/5.0
- 1% rule +2.5/10.0
- DSCR +2.0/10.0
- Schools +2.0/10.0
- Condition / age +1.0/5.0
- Appreciation +0.0/10.0
$252,900
🖨 Deal sheet 📄 Offer letter ✓ Due diligence
Listing remarks MLS
This Stafford home, situated in the serene countryside of Tibet Road in Sassafras, exudes charm with its attractive BRICK FRONT and vinyl accents. It provides ample storage and adaptability, catering to families of all sizes. The open-concept design offers seamless views to the modern kitchen and breakfast area, perfect for hosting guests. The master suite boasts a spacious walk-in closet, along with a private bath featuring dual vanity, garden tub, and separate shower. Unwind in the large, beautiful backyard after a long day. Artistic renderings and illustrations are for reference only. Actual floor plans, features, and inclusions may differ.
Key facts
- Brick front
- Walk-in closet
- Private bath
Tags
Neighborhood map
What this means for you Summary
Snapshot
- This is a 4-bed/2.0-bath single-family listed at $253k. Condition is rated poor.
Deal economics
- At list price, monthly cash flow is $-297 ($-4k/yr) — negative.
- To cash-flow at today's rent, offer at most $237k (6.3% below list).
- To meet the 1% rule (rent ≥ 1% of price), the offer needs to be $211k (16.6% below list).
- Recommended offer: $211k (16.6% below list) — sets the bar for 1% rule.
Location & tenants
- Location reads 73/100 on livability (#51 in GA) — a middle-class / working-renter tenant base. Strengths: cost of living A+, housing A+, health & safety A+; Watch: schools D+, commute D+, crime F.
- Liberty County (urban): math 19% / reading 28% proficiency, ranked #133 of 174 in GA (top 76%) — low school quality limits family demand, transient renter base, plan for 1-2y turnover.
- Market conditions: Rents rising fast (+5.4%/yr); 612 active listings in the ZIP; 19 comparable units currently listed for rent nearby; rentals lingering (median 44d on market — plan ~5-8 weeks vacancy on turnover, expect pricing pressure); 100% of comp listings sitting > 30 days — soft ceiling on asking rent; 471 units permitted in Liberty County in 2024 (0 in 5+ unit buildings).
- This rent runs 42% of the median local income ($60k/yr) — at the standard rent-burdened threshold; future hikes will face affordability resistance.
Forward outlook
- Local home prices are declining (-3.0%/yr); year-one equity from $2k of loan paydown is wiped out by about $8k of value loss. Plan a longer hold.
- Liberty County population projected to shrink 8% by 2050 — rents likely to lag national; underwrite the cash flow, not the appreciation.
Negotiation context
- It's been on market 298 days — a 12% lower offer ($223k) is reasonable based on typical stale-listing flexibility.
Risks & watch-outs
- Climate carrying-cost: severe wind risk, 97% chance of damaging wind over 30y; major wildfire risk; extreme-heat days projected 6→16/yr by 2055 (HVAC capex compounding) — expect insurance premiums to compound above CPI over the hold.
Questions for the listing agent
- What do current leases actually rent for vs. the listed asking? Can we see a recent rent roll and the last 12 months of T-12 income?
- It's been on market 298 days. Have you received any prior offers? Is the seller open to a 17% concession, seller financing, or rate buy-down credit?
- Have any recent inspections been done? Can we get a copy of the seller's disclosures and any deferred-maintenance estimates?
- What does the HOA fee cover, when was the last increase, and are there any pending special assessments or reserve-fund shortfalls?
- Why hasn't it sold? Are there any deal-killer items the seller is aware of (foundation, flood, title, zoning, code violations)?
- Is there a deadline driving the sale (1031 exchange, divorce, estate, relocation)? That informs how much negotiation room exists.
- Schools are D-rated, which usually means shorter tenancies and higher turnover. Who's the typical renter profile here, and what's been the actual vacancy rate?
- Crime grade is F in this area — have there been break-ins, vandalism, or insurance claims at this property in the last 3 years? What carrier currently insures it and at what premium?
- The area grade is low — what's the realistic commute time and amenity access for the typical tenant pool here? Any planned neighborhood developments (good or bad) we should know about?
- What's the average days-on-market for RENTAL listings here right now (not sales)? A rising rental-DOM trend means longer vacancies and softer asking-rent achievability than the comps imply.
- What's the recent tenant-quality profile in this submarket — average credit score on applications, eviction rate, late-payment / NSF rate, and stable-employment percentage? A property-management company in the area should have these aggregated.
- How much new for-sale + rental construction is in the pipeline within 1–3 miles? Heavy new supply typically softens prices + rents 12–24 months out; constrained supply supports both.
Investment metrics
- 1% rule
- 0.75% ✗
- Cap rate
- 5.02%
- Cash-on-cash
- -4.54%
- DSCR
- 0.80
- GRM
- 11.0
CMA / ARV
- ARV (median comp)
- $279,789
- List price
- $252,900
- Delta
- -9.61%
- Verdict
- FAIR
- Comps
- 20 within 1.0 mi
Show comp detail 12 sales within ~0.75 mi
| Address | Dist | Beds/Ba | Sqft | Sold | Price | $/sf | Match |
|---|---|---|---|---|---|---|---|
| 232 Juniper Dr | 0.17mi | 4/2.0 | 1,565 (0%) | 0mo | $271,350 | $173 | 92 |
| 191 Juniper Dr | 0.13mi | 4/2.5 | 1,609 (+3%) | 1mo | $283,825 | $176 | 86 |
| 157 Juniper Dr | 0.10mi | 3/2.0 (-1) | 1,527 (-2%) | 2mo | $268,925 | $176 | 84 |
| 167 Juniper Dr | 0.11mi | 4/2.0 | 1,735 (+11%) | 0mo | $285,225 | $164 | 76 |
| 158 Juniper Dr | 0.09mi | 3/2.5 (-1) | 1,455 (-7%) | 1mo | $271,100 | $186 | 76 |
| 177 Juniper Dr | 0.12mi | 3/2.0 (-1) | 1,380 (-12%) | 2mo | $262,300 | $190 | 68 |
| 1238 Grayson Ave | 0.42mi | 3/2.5 (-1) | 1,462 (-7%) | 2mo | $275,000 | $188 | 61 |
| 1041 Grayson Ave | 0.43mi | 3/2.5 (-1) | 1,693 (+8%) | 2mo | $278,000 | $164 | 58 |
| 215 Nobel Crst | 0.69mi | 3/2.0 (-1) | 1,522 (-3%) | 1mo | $267,500 | $176 | 58 |
| 872 Grayson Ave | 0.48mi | 3/2.5 (-1) | 1,411 (-10%) | 1mo | $250,000 | $177 | 53 |
| 1308 Karen Ct | 0.68mi | 3/2.5 (-1) | 1,478 (-6%) | 1mo | $265,000 | $179 | 51 |
| 622 Piedmont Ave | 0.73mi | 3/2.0 (-1) | 1,363 (-13%) | 2mo | $239,999 | $176 | 38 |
Match score weights: distance 35% · size 25% · config 20% · recency 20%. Top-matched comps best support the ARV.
Projected returns pro-forma
-3.0% appreciation · 5.41% rent growth · sell at horizon
- IRR
- -21.3%
- Equity multiple
- 0.25×
- Total profit
- $-58,934
- Equity at exit
- $41,717
- IRR
- -10.0%
- Equity multiple
- 0.33×
- Total profit
- $-52,844
- Equity at exit
- $24,191
Cash invested: $78,341 (down + closing). Projections, not guarantees.
Landlord ↔ Tenant lean methodology
- Overall (STATE)
- 90 Strongly Landlord-Friendly
- State Georgia
- 90 Strongly Landlord-Friendly · R+3
- County
- — inherits STATE
- City
- — inherits STATE
ZIP-level market 31313
- Home prices YoY
- -27.1%
- Rents YoY
- 5.4%
- Active inventory
- 612
- Price-to-rent
- 10.0×
Monthly cashflow live
- Estimated rent
- $2,110 high interval (Pro) →
- Mortgage (P&I)
- −$1,467
- Tax est. 1.5%
- −$350 /mo · $4,197/yr
- Insurance
- −$117
- HOA
- −$30
- Vacancy / Maint / Mgmt
- −$443
- Net cashflow
- $-297
Break-even live
UW: 25.0% down · 7.5% · 30yr · 1.5% tax · 5.0% vac · 8.0% maint · 8.0% mgmt
Financing live
Cash to close
- Down payment
- $69,947
- Closing costs
- $8,394
- Reserves months
- —
- Total cash needed
- —
Loan-product check · same deal, 3 products live
Conventional
25% down · 7.5% · 30yr
- Down + closing
- —
- Monthly P&I
- —
- Monthly cashflow
- —
- DSCR
- —
- Eligible?
- —
Personal DTI + credit; lowest rate.
DSCR
20% down · 8.5% · 30yr
- Down + closing
- —
- Monthly P&I
- —
- Monthly cashflow
- —
- DSCR
- —
- Eligible?
- —
No personal income docs; deal must DSCR.
Hard money
10% down · 12.0% · 12mo
- Down + closing
- —
- Monthly P&I
- —
- Monthly cashflow
- —
- DSCR
- —
- Eligible?
- —
Short-term bridge; refi at stabilization.
Rent comps 19 comps
| Address | Beds | Baths | Sqft | Rent | $/sqft | DOM | Units | Dist |
|---|---|---|---|---|---|---|---|---|
| 1300 Independence Place Dr Hinesville, GA | 1.0–4.0 | 1.0–4.0 | 862 | $1,830 | $2.12 | 43d | 23 | 0.46mi |
| 264 Marron Way Hinesville, GA | 4.0 | 2.5 | 1997 | $2,200 | $1.10 | 43d | 1 | 0.53mi |
| 1110 Creekside Cir Hinesville, GA | 3.0 | 2.0 | 1356 | $2,000 | $1.47 | 43d | 1 | 0.59mi |
| 600 Brightleaf Cir Hinesville, GA | 3.0 | 2.5 | 1603 | $2,300 | $1.43 | 43d | 1 | 0.73mi |
| 511 Wyckfield Way Hinesville, GA | 4.0 | 2.5 | 2070 | $2,475 | $1.20 | 43d | 1 | 0.86mi |
| 501 Burke Dr Hinesville, GA | 1.0–3.0 | 1.0–2.0 | 1132 | $1,891 | $1.67 | 43d | 18 | 0.87mi |
| 203 Guyett Ave Hinesville, GA | 4.0 | 2.5 | 1593 | $2,000 | $1.26 | 43d | 1 | 0.98mi |
| 403 Valdez Ct Hinesville, GA | 3.0 | 2.5 | 1810 | $2,000 | $1.10 | 43d | 1 | 1.06mi |
| 908 Ringneck Way Hinesville, GA | 3.0 | 2.0 | 1526 | $1,750 | $1.15 | 44d | 1 | 1.17mi |
| 717 Mill Creek Cir Hinesville, GA | 4.0 | 2.5 | 1776 | $2,200 | $1.24 | 43d | 1 | 1.20mi |
| 712 Mill Creek Cir Hinesville, GA | 4.0 | 2.0 | 1456 | $1,900 | $1.30 | 43d | 1 | 1.22mi |
| 34 Wythe St Hinesville, GA | 4.0 | 2.5 | 1978 | $2,200 | $1.11 | 43d | 1 | 1.23mi |
| 924 Sanford Ln Hinesville, GA | 4.0 | 2.5 | 1801 | $1,995 | $1.11 | 43d | 1 | 1.24mi |
| 410 Conley Dr Hinesville, GA | 3.0 | 3.0 | 1742 | $2,000 | $1.15 | 43d | 1 | 1.24mi |
| 960 Gulfstream Rd Hinesville, GA | 4.0 | 2.0 | 1515 | $2,150 | $1.42 | 43d | 1 | 1.29mi |
| 916 Mandarin Dr Hinesville, GA | 3.0 | 2.0 | 1433 | $1,550 | $1.08 | 43d | 1 | 1.30mi |
| 905 King Air Ct Hinesville, GA | 3.0 | 2.0 | 1407 | $1,750 | $1.24 | 43d | 1 | 1.34mi |
| 710 Little John Dr Hinesville, GA | 3.0 | 2.0 | 1459 | $1,700 | $1.17 | 43d | 1 | 1.45mi |
| 722 Robin Hood Dr Hinesville, GA | 3.0 | 2.0 | 1668 | $1,500 | $0.90 | 43d | 1 | 1.48mi |
HOA detail
- Monthly dues
- $30 · $360/yr
Listing history 18 events
-
2026-06-19days on market $252,900 Active 298 DOM
-
2026-06-18days on market $252,900 Active 297 DOM
-
2026-06-17days on market $252,900 Active 296 DOM
-
2026-06-16days on market $252,900 Active 295 DOM
-
2026-06-15days on market $252,900 Active 294 DOM
-
2026-06-14days on market $252,900 Active 292 DOM
-
2026-06-13days on market $252,900 Active 291 DOM
-
2026-06-10days on market $252,900 Active 289 DOM
-
2026-06-09days on market $252,900 Active 288 DOM
-
2026-06-08days on market $252,900 Active 287 DOM
-
2026-06-07days on market $252,900 Active 286 DOM
-
2026-06-05days on market $252,900 Active 283 DOM
-
2026-06-03days on market $252,900 Active 282 DOM
-
2026-06-02days on market $252,900 Active 281 DOM
-
2026-06-01days on market $252,900 Active 280 DOM
-
2026-05-31days on market $252,900 Active 279 DOM
-
2026-05-30days on market $252,900 Active 278 DOM
-
2025-08-25$252,900 Active 651-char remark
Show marketing remark (651 chars)
This Stafford home, situated in the serene countryside of Tibet Road in Sassafras, exudes charm with its attractive BRICK FRONT and vinyl accents. It provides ample storage and adaptability, catering to families of all sizes. The open-concept design offers seamless views to the modern kitchen and breakfast area, perfect for hosting guests. The master suite boasts a spacious walk-in closet, along with a private bath featuring dual vanity, garden tub, and separate shower. Unwind in the large, beautiful backyard after a long day. Artistic renderings and illustrations are for reference only. Actual floor plans, features, and inclusions may differ.
ⓘ Source: listings_history table (triggers on properties + properties_extension) + one-shot
backfill from property_details.listing_events for pre-trigger history.
Climate risk First Street
- Flood 1/10 Low FEMA zone X (unshaded) · 0% chance over 30 yrs
- Wildfire 6/10 Major
- Heat 8/10 Severe 6 d/yr ≥111°F today · 16 d/yr by 30 yrs out
- Wind 8/10 Severe 97% chance of damaging wind over 30 yrs
- Air quality 2/10 Low 2 unhealthy d/yr today · 2 by 30 yrs out
Nearby sold comps map
Loading sold comps map…
Walkable amenities ~0.75 mi
Loading nearby amenities…
Taxation est. · year 1
- Rental income
- $25,322
- − Mortgage interest
- −$15,673
- − Property taxes
- −$4,197
- − Insurance
- −$1,399
- − Repairs & maintenance
- −$2,026
- − Management
- −$2,026
- − HOA
- −$360
- − Depreciation
- −$8,139
- Taxable loss
- −$8,497
- Est. tax savings @ 24.0%
- +$2,039
- After-tax cash flow
- $-1,519/yr
For passive investors: Depreciation is non-cash, so a rental often shows a tax loss while cash-flowing — sheltering income. Rental losses are passive: they offset passive income freely, and up to $25,000/yr can offset ordinary (W-2) income if you actively participate and your MAGI is under $100k (phasing out to $0 by $150k); unused losses carry forward. On sale, claimed depreciation is recaptured at up to 25%, and gains may owe capital-gains tax (a 1031 exchange can defer both). Figures are a year-1 estimate at your 24.0% rate — not tax advice; consult a CPA.
Condition & rehab AI · 2 photos
This Stafford home in Sassafras, GA, requires extensive repairs and maintenance, including a new roof, exterior siding, and landscaping. Significant improvements are needed to bring the property up to a good condition and increase its resale and rental value.
Repairs flagged
- Major roof — Signs of water damage and possible leaks.
- Major exterior siding — Peeling paint and visible damage.
- Major landscaping — Overgrown and unkempt appearance.
- Major interior walls and paint — No photos of interior condition, but exterior suggests similar state.
- Major systems — No photos of systems, but overall condition suggests need for repair or replacement.
- Major flooring — No photos of flooring, but exterior condition suggests similar state. Likely worn and in need of replacement or repair.
Value-add opportunities
- Resale repair and replace roof — A new roof would significantly improve the home's appearance and value.
- Resale repair and paint exterior siding — A fresh coat of paint would improve the home's curb appeal and value.
- Both landscaping and yard maintenance — A well-maintained yard would enhance both resale and rental value.
- Resale repair and replace flooring — New flooring would improve the home's appearance and value.
- Resale repair and replace interior walls and paint — Fresh walls and paint would significantly improve the home's appearance and value.
- Resale repair and replace systems — Up-to-date systems would improve the home's functionality and value.
Renovation cost estimate screening
| Repair item | Severity | Est. cost |
|---|---|---|
| roof · Signs of water damage and possible leaks. | Major | $15,000–50,000 |
| exterior siding · Peeling paint and visible damage. | Major | $15,000–50,000 |
| landscaping · Overgrown and unkempt appearance. | Major | $15,000–50,000 |
| interior walls and paint · No photos of interior condition, but exterior suggests similar state. | Major | $15,000–50,000 |
| systems · No photos of systems, but overall condition suggests need for repair or replacement. | Major | $15,000–50,000 |
| flooring · No photos of flooring, but exterior condition suggests similar state. Likely worn and in need of replacement or repair. | Major | $15,000–50,000 |
| Total estimated repair cost · 6 items | $90,000–300,000 |
Value-add ROI direction
- Resale repair and replace roof — A new roof would significantly improve the home's appearance and value. ↑
- Resale repair and paint exterior siding — A fresh coat of paint would improve the home's curb appeal and value. ↑
- Both landscaping and yard maintenance — A well-maintained yard would enhance both resale and rental value. ↑
- Resale repair and replace flooring — New flooring would improve the home's appearance and value. ↑
- Resale repair and replace interior walls and paint — Fresh walls and paint would significantly improve the home's appearance and value. ↑
- Resale repair and replace systems — Up-to-date systems would improve the home's functionality and value. ↑
ⓘ Cost ranges are severity-bucket heuristics (US national rule-of-thumb). Get contractor quotes + a written scope before underwriting a rehab budget.
Schools (NCES district)
- District
- Liberty County
- NCES district ID
- 1303300
- Math proficiency
- 19% ▼ -16.00%
- Reading proficiency
- 28% ▼ -13.00%
- Median HH income
- $43,911
- Composite
- 20.2/100
- National rank
- #8630
- State rank
- #133 of 174 in GA
Livability — Hinesville
- Score
- 73/100
- State rank
- #51
- US rank
- #5200
Category grades
Schools grade is shown separately in the Schools card above.
Census & demographics
- County
- Liberty County · 58,565 people
- City population
- 42,838
- Metro
- Hinesville, GA
- Population (ZIP)
- 42,838
- Household income
- $60,233
- Rent vs Own
- Severe rent burden
- 1693.0
Population outlook (Liberty County) Hauer SSP2
- Today (2025)
- 58,689 people
- By 2030
- 57,670 · -1.7%
- By 2040
- 55,750 · -5.0%
- By 2050
- 54,155 · -7.7%
- By 2075
- 58,947 · +0.4%
- By 2100
- 66,919 · +14.0%
Race, ethnicity, and origin ACS 2023
- Neighborhood character
- Diverse neighborhood (Simpson 0.67)
- Race & ethnicity
- Black 47% White 31% Hispanic / Latino 13% Two or more races 11% Asian 2%
- Hispanic origin (detail)
- Mexican 4% Puerto Rican 7%
- Common ancestry
- Slovak 1% Italian 1% Lithuanian 1%
- Foreign-born
- 7% · Canada, South Korea
- Languages at home
- 86% English-only · Spanish 7% Other Indo-European 2% German/W. Germanic 1%
Political lean MEDSL · Liberty
- 2024 margin
- D (+17.4) · D 58.5% · R 41.0%
- 2008→2024 swing
- -10.9pp toward R · 2008: 28.4pp · 2024: 17.4pp
- All cycles
- 2024: D+17.4 2020: D+24.1 2016: D+21.2 2012: D+30.2 2008: D+28.4
Not yet ingested
- Civics
- —
Market trends
- HPI YoY
- ▼ -77.50%
- Current HPI
- 208.0927
- Rent YoY
- ▲ 5.41%
- Metro
- Hinesville, GA
- State GDP YoY
- ▲ 2.66%
- F500 in state
- 28
Industry mix (Fortune 500 HQ in GA)
| Industry | F500 HQs | Revenue |
|---|---|---|
| Paper / Packaging | 2 | $29B |
|
||
| Retail | 1 | $160B |
|
||
| Transportation / Logistics | 1 | $91B |
|
||
| Airlines | 1 | $62B |
|
||
| Consumer Goods | 1 | $47B |
|
||
| Utilities | 1 | $25B |
|
||
Price history
1 event — show timeline
- 2025-08-25 Listed $252,900 Zillow
Cash-flow waterfall
monthlySold comps — $/sqft
last 12 mo · ≤1 miLoading sold comps…