1455 E Katie Ave · Paradise, NV
Flood risk 1/10 · Minimal
- FEMA flood zone
- X (unshaded)
- Chance of flooding over 30 yrs
- 0.0%
- Est. flood insurance / yr
- $507 – $1,088
Fire risk 1/10 · Minimal
- Est. fire insurance / yr
- $490 – $910
Heat risk 8/10 · Major
- Hot days now (above 107°F)
- 7 days/yr
- Hot days in 30 yrs
- 17 days/yr
Wind risk 1/10 · Minimal
- Chance of severe wind over 30 yrs
- —
Air-quality risk 3/10 · Minor
- Unhealthy air days now
- 3 days/yr
- Unhealthy air days in 30 yrs
- 4 days/yr
Risk factors via First Street. Map © Google.
Why this score? — see what drove the D grade
The composite is a weighted blend of 9 inputs, each scored 0–100. Each bar is that input's sub-score; the figure is the points it added to the 100-point composite (weight × sub-score).
- Cash flow +14.1/30.0
- ARV discount +7.5/15.0
- DSCR +4.3/10.0
- 1% rule +3.9/10.0
- Livability +3.8/5.0
- Schools +2.6/10.0
- Condition / age +2.2/5.0
- Rent growth +2.0/5.0
- Appreciation +0.0/10.0
$145,000
🖨 Deal sheet 📄 Offer letter ✓ Due diligence
Listing remarks
This well-maintained second-floor one-bedroom condo features a spacious balcony and an open-concept layout. The home includes attractive wood-style laminate flooring and granite countertops in both the kitchen and bathroom. An assigned covered parking space is located directly beneath the unit for added convenience. The community offers a variety of amenities, including a pool, spa, basketball court, tennis court, and playground, providing a comfortable and active living environment.
Key facts
- Spacious balcony
- Community amenities
- Granite countertops
Tags
Neighborhood map
What this means for you Summary
Snapshot
- This is a 1-bed/1.0-bath other listed at $145k. Condition is rated fair.
Deal economics
- At list price, monthly cash flow is $23 ($271/yr) — positive.
- The deal already cash-flows at list — no discount required.
- To meet the 1% rule (rent ≥ 1% of price), the offer needs to be $130k (10.6% below list).
- Recommended offer: $130k (10.6% below list) — sets the bar for 1% rule.
Location & tenants
- Location reads 76/100 on livability (#10 in NV, #3,494 nationally) — a middle-class / working-renter tenant base. Strengths: commute A+, housing A-, cost of living B; Watch: employment D+, schools F, crime D-.
- Clark County School District (urban): math 21% / reading 39% proficiency, ranked #11 of 17 in NV (top 65%) — families likely to look elsewhere, expect single-tenant / working-renter base with shorter leases.
- Market conditions: Rents soft (-1.8%/yr); 199 active listings in the ZIP; 17 comparable units currently listed for rent nearby; rentals at typical pace (median 15d on market — plan ~3-4 weeks tenant-placement turnaround); 14,754 units permitted in Clark County in 2024 (2,301 in 5+ unit buildings).
- This rent runs 33% of the median local income ($47k/yr) — at the standard rent-burdened threshold; future hikes will face affordability resistance.
Forward outlook
- Local home prices are declining (-3.0%/yr); year-one equity from $1k of loan paydown is wiped out by about $4k of value loss. Plan a longer hold.
- Clark County population projected at +36% by 2050 — long-run rental-demand tailwind backs the buy-and-hold thesis.
Negotiation context
- It's been on market 37 days — a 3% lower offer ($141k) is reasonable based on typical stale-listing flexibility.
- 2 sale attempts since 14y ago with the ask held roughly flat each time — persistent listings suggest the price (not the market) is what's stuck; bring a comps-based counter.
Risks & watch-outs
- Climate carrying-cost: extreme-heat days projected 7→17/yr by 2055 (HVAC capex compounding) — expect insurance premiums to compound above CPI over the hold.
Questions for the listing agent
- It's been on market 37 days. Have you received any prior offers? Is the seller open to a 11% concession, seller financing, or rate buy-down credit?
- Have any recent inspections been done? Can we get a copy of the seller's disclosures and any deferred-maintenance estimates?
- Is there a deadline driving the sale (1031 exchange, divorce, estate, relocation)? That informs how much negotiation room exists.
- Schools are F-rated, which usually means shorter tenancies and higher turnover. Who's the typical renter profile here, and what's been the actual vacancy rate?
- Crime grade is D in this area — have there been break-ins, vandalism, or insurance claims at this property in the last 3 years? What carrier currently insures it and at what premium?
- The area grade is low — what's the realistic commute time and amenity access for the typical tenant pool here? Any planned neighborhood developments (good or bad) we should know about?
- What's the average days-on-market for RENTAL listings here right now (not sales)? A rising rental-DOM trend means longer vacancies and softer asking-rent achievability than the comps imply.
- What's the recent tenant-quality profile in this submarket — average credit score on applications, eviction rate, late-payment / NSF rate, and stable-employment percentage? A property-management company in the area should have these aggregated.
- How much new for-sale + rental construction is in the pipeline within 1–3 miles? Heavy new supply typically softens prices + rents 12–24 months out; constrained supply supports both.
Investment metrics
- 1% rule
- 0.89% ✗
- Cap rate
- 6.48%
- Cash-on-cash
- 0.67%
- DSCR
- 1.03
- GRM
- 9.3
CMA / ARV
No comps found within radius.
Projected returns pro-forma
-3.0% appreciation · 0.0% rent growth · sell at horizon
- IRR
- -18.7%
- Equity multiple
- 0.36×
- Total profit
- $-25,841
- Equity at exit
- $21,620
- IRR
- -18.7%
- Equity multiple
- 0.13×
- Total profit
- $-35,261
- Equity at exit
- $12,537
Cash invested: $40,600 (down + closing). Projections, not guarantees.
Landlord ↔ Tenant lean methodology
- Overall (STATE)
- 71 Landlord-Friendly
- State Nevada
- 71 Landlord-Friendly · R+1
- County
- — inherits STATE
- City
- — inherits STATE
ZIP-level market 89119
- Rents YoY
- -1.8%
- Active inventory
- 199
- Price-to-rent
- 9.3×
Monthly cashflow live
- Estimated rent
- $1,297 high interval (Pro) →
- Mortgage (P&I)
- −$760
- Tax est. 1.5%
- −$181 /mo · $2,175/yr
- Insurance
- −$60
- HOA
- −$0
- Vacancy / Maint / Mgmt
- −$272
- Net cashflow
- $23
Break-even live
UW: 25.0% down · 7.5% · 30yr · 1.5% tax · 5.0% vac · 8.0% maint · 8.0% mgmt
Financing live
Cash to close
- Down payment
- $36,250
- Closing costs
- $4,350
- Reserves months
- —
- Total cash needed
- —
Loan-product check · same deal, 3 products live
Conventional
25% down · 7.5% · 30yr
- Down + closing
- —
- Monthly P&I
- —
- Monthly cashflow
- —
- DSCR
- —
- Eligible?
- —
Personal DTI + credit; lowest rate.
DSCR
20% down · 8.5% · 30yr
- Down + closing
- —
- Monthly P&I
- —
- Monthly cashflow
- —
- DSCR
- —
- Eligible?
- —
No personal income docs; deal must DSCR.
Hard money
10% down · 12.0% · 12mo
- Down + closing
- —
- Monthly P&I
- —
- Monthly cashflow
- —
- DSCR
- —
- Eligible?
- —
Short-term bridge; refi at stabilization.
Rent comps 17 comps
| Address | Beds | Baths | Sqft | Rent | $/sqft | DOM | Units | Dist |
|---|---|---|---|---|---|---|---|---|
| 1601 E Katie Ave Las Vegas, NV | 1.0–2.0 | 1.0–2.0 | 809 | $1,325 | $1.64 | 43d | 13 | 0.14mi |
| 1061 E Flamingo Rd Las Vegas, NV | 1.0–2.0 | 1.0–2.0 | 967 | $1,117 | $1.15 | 14d | 35 | 0.58mi |
| 818 E Flamingo Rd Las Vegas, NV | 1.0–2.0 | 1.0–2.5 | 1158 | $1,395 | $1.20 | 2d | 34 | 0.72mi |
| 4150 Channel 10 Dr Las Vegas, NV | 1.0 | 1.0 | 600 | $1,245 | $2.08 | 1d | 2 | 0.88mi |
| 4255 Channel 10 Dr Las Vegas, NV | 1.0–3.0 | 1.0–2.0 | 899 | $1,182 | $1.31 | 2d | 7 | 0.89mi |
| 4330 Channel 10 Dr Las Vegas, NV | 1.0–2.0 | 1.0–2.0 | 807 | $1,475 | $1.83 | 12d | 27 | 1.00mi |
| 2530 E Flamingo Rd Las Vegas, NV | 1.0 | 1.0 | 342 | $1,923 | $5.61 | 43d | 1 | 1.03mi |
| 3930 Paradise Rd Las Vegas, NV | 3.0 | 1.0–2.0 | 999 | $2,241 | $2.24 | 2d | 87 | 1.06mi |
| 3550 Paradise Rd Las Vegas, NV | 3.0 | 1.0–2.0 | 947 | $1,100 | $1.16 | 43d | 20 | 1.10mi |
| 4330 S Eastern Ave Las Vegas, NV | 3.0 | 1.0–2.0 | 802 | $1,312 | $1.63 | 2d | 8 | 1.12mi |
| 4700 S Maryland Pkwy Las Vegas, NV | 1.0 | 1.0 | 409 | $1,382 | $3.37 | 43d | 48 | 1.14mi |
| 4801 Spencer St Las Vegas, NV | 1.0–3.0 | 1.0–2.0 | 1072 | $1,028 | $0.96 | 43d | 14 | 1.22mi |
| 3168 S Eastern Ave #48 Las Vegas, NV | 1.0 | 1.0 | 671 | $1,050 | $1.56 | 23d | 1 | 1.22mi |
| 3776 Howard Hughes Pkwy Las Vegas, NV | 3.0 | 1.0–2.5 | 1548 | $2,357 | $1.52 | 2d | 9 | 1.23mi |
| 1635 E Tropicana Ave Las Vegas, NV | 3.0 | 1.0–3.0 | 832 | $1,654 | $1.99 | 2d | 68 | 1.39mi |
| 3030 Plaza St Unit Studio 2 Las Vegas, NV | 1.0 | 1.0 | 400 | $1,090 | $2.73 | 23d | 1 | 1.43mi |
| 3030 Plaza St Unit Studio 3 Las Vegas, NV | 1.0 | 1.0 | 400 | $1,090 | $2.73 | 23d | 1 | 1.43mi |
Listing history 15 events
-
2026-06-18days on market $145,000 Active 37 DOM
-
2026-06-17days on market $145,000 Active 36 DOM
-
2026-06-16days on market $145,000 Active 35 DOM
-
2026-06-15days on market $145,000 Active 34 DOM
-
2026-06-13days on market $145,000 Active 32 DOM
-
2026-06-09days on market $145,000 Active 28 DOM
-
2026-06-08days on market $145,000 Active 27 DOM
-
2026-06-08days on market $145,000 Active 26 DOM
-
2026-06-03days on market $145,000 Active 22 DOM
-
2026-06-02days on market $145,000 Active 21 DOM
-
2026-06-01days on market $145,000 Active 20 DOM
-
2026-05-31days on market $145,000 Active 19 DOM
-
2026-05-12$145,000 Active 488-char remark
-
2012-10-08historical
-
2012-10-08$27,800 Exclusive Right
ⓘ Source: listings_history table (triggers on properties + properties_extension) + one-shot
backfill from property_details.listing_events for pre-trigger history.
Climate risk First Street
- Flood 1/10 Low FEMA zone X (unshaded) · 0% chance over 30 yrs
- Wildfire 1/10 Low
- Heat 8/10 Severe 7 d/yr ≥107°F today · 17 d/yr by 30 yrs out
- Wind 1/10 Low
- Air quality 3/10 Moderate 3 unhealthy d/yr today · 4 by 30 yrs out
Nearby sold comps map
Loading sold comps map…
Walkable amenities ~0.75 mi
Loading nearby amenities…
Taxation est. · year 1
- Rental income
- $15,564
- − Mortgage interest
- −$8,122
- − Property taxes
- −$2,175
- − Insurance
- −$725
- − Repairs & maintenance
- −$1,245
- − Management
- −$1,245
- − Depreciation
- −$4,218
- Taxable loss
- −$2,167
- Est. tax savings @ 24.0%
- +$520
- After-tax cash flow
- $791/yr
For passive investors: Depreciation is non-cash, so a rental often shows a tax loss while cash-flowing — sheltering income. Rental losses are passive: they offset passive income freely, and up to $25,000/yr can offset ordinary (W-2) income if you actively participate and your MAGI is under $100k (phasing out to $0 by $150k); unused losses carry forward. On sale, claimed depreciation is recaptured at up to 25%, and gains may owe capital-gains tax (a 1031 exchange can defer both). Figures are a year-1 estimate at your 24.0% rate — not tax advice; consult a CPA.
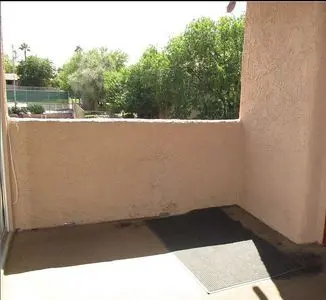
Condition & rehab AI · 1 photo
This well-maintained second-floor one-bedroom condo has a good interior but requires significant exterior repairs to improve its overall condition and value.
Repairs flagged
- Major exterior wall cracks — Visible cracks and discoloration on the exterior wall indicate significant structural damage that needs repair.
Value-add opportunities
- Both repair exterior wall cracks — Repairing the exterior wall cracks will improve the home's appearance and increase its value for both resale and rental.
- Both paint exterior wall — Painting the exterior wall will improve its appearance and increase the home's curb appeal, enhancing its value for both resale and rental.
Renovation cost estimate screening
| Repair item | Severity | Est. cost |
|---|---|---|
| exterior wall cracks · Visible cracks and discoloration on the exterior wall indicate significant structural damage that needs repair. | Major | $15,000–50,000 |
| Total estimated repair cost · 1 items | $15,000–50,000 |
Value-add ROI direction
- Both repair exterior wall cracks — Repairing the exterior wall cracks will improve the home's appearance and increase its value for both resale and rental. ↑
- Both paint exterior wall — Painting the exterior wall will improve its appearance and increase the home's curb appeal, enhancing its value for both resale and rental. ↑
ⓘ Cost ranges are severity-bucket heuristics (US national rule-of-thumb). Get contractor quotes + a written scope before underwriting a rehab budget.
Schools (NCES district)
- District
- Clark County School District
- NCES district ID
- 3200060
- Math proficiency
- 21% ▼ -13.00%
- Reading proficiency
- 39% ▼ -8.00%
- Median HH income
- $53,611
- Composite
- 26.48/100
- National rank
- #7211
- State rank
- #11 of 17 in NV
Livability — Paradise
- Score
- 76/100
- State rank
- #10
- US rank
- #3494
Category grades
Schools grade is shown separately in the Schools card above.
Census & demographics
- Census place
- Paradise, NV
- County
- Clark County · 2,306,105 people
- City population
- 227,885
- Metro
- Las Vegas-Henderson-Paradise, NV
- Population (ZIP)
- 50,196
- Household income
- $46,960
- Rent vs Own
- Severe rent burden
- 4678.0
Population outlook (Clark County) Hauer SSP2
- Today (2025)
- 2,504,101 people
- By 2030
- 2,693,770 · +7.6%
- By 2040
- 3,061,208 · +22.2%
- By 2050
- 3,400,072 · +35.8%
- By 2075
- 4,139,522 · +65.3%
- By 2100
- 4,596,916 · +83.6%
Race, ethnicity, and origin ACS 2023
- Neighborhood character
- Highly diverse neighborhood (Simpson 0.74)
- Race & ethnicity
- Hispanic / Latino 38% White 29% Two or more races 18% Black 13% Asian 11%
- Hispanic origin (detail)
- Mexican 23% Puerto Rican 1% Cuban 4%
- Common ancestry
- Romanian 2% Lithuanian 1% Scotch-Irish 1%
- Foreign-born
- 31% · Canada, China, Jamaica
- Languages at home
- 57% English-only · Spanish 29% Tagalog/Filipino 6% Other Indo-European 3%
Political lean MEDSL · Clark
- 2024 margin
- Toss-up / Even · D 50.4% · R 47.8% · Other 1.7%
- 2008→2024 swing
- -16.5pp toward R · 2008: 19.1pp · 2024: 2.6pp
- All cycles
- 2024: D+2.6 2020: D+9.3 2016: D+10.7 2012: D+14.5 2008: D+19.1
Not yet ingested
- Civics
- —
Market trends
- HPI YoY
- ▼ -221.72%
- Current HPI
- 266.4892
- Rent YoY
- ▼ -1.81%
- Metro
- Las Vegas-Henderson-Paradise, NV
- State GDP YoY
- ▲ 3.08%
- F500 in state
- 6
Industry mix (Fortune 500 HQ in NV)
| Industry | F500 HQs | Revenue |
|---|---|---|
| Hotels / Casinos | 3 | $36B |
|
||
Price history
+421.6% since first listed3 events — show timeline
- 2026-05-12 Listed $145,000 FSBO.com
- 2012-10-08 Listing Removed — GLVAR
- 2012-10-08 Listed $27,800 GLVAR
Cash-flow waterfall
monthlySold comps — $/sqft
last 12 mo · ≤1 miLoading sold comps…