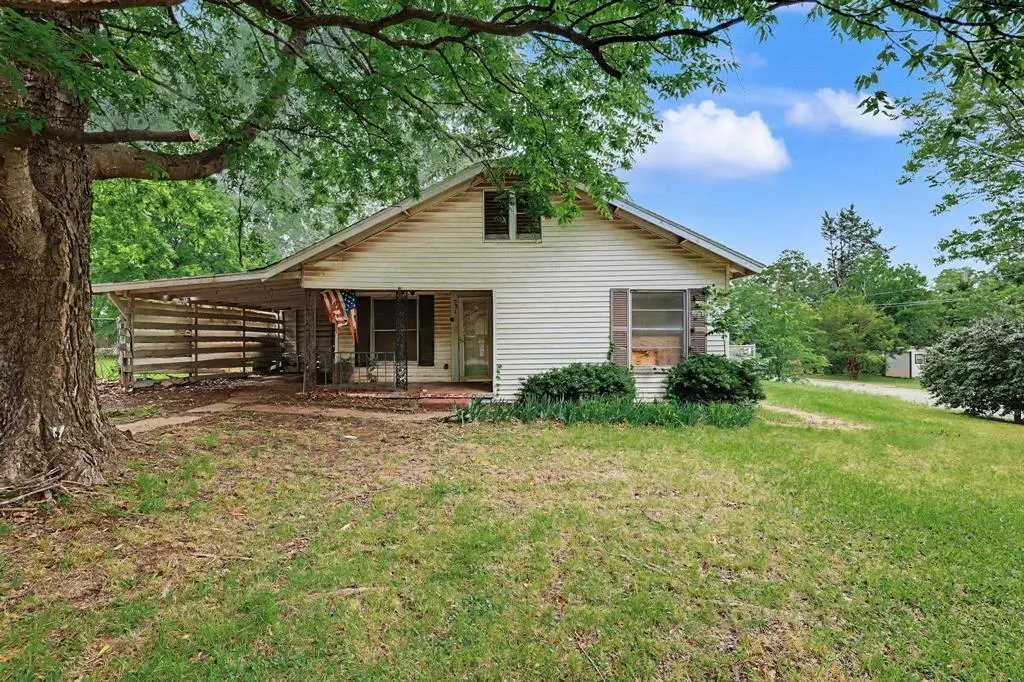
531 E Day St · Denison, TX
Flood risk 1/10 · Minimal
- FEMA flood zone
- X (unshaded)
- Chance of flooding over 30 yrs
- 0.0%
- Est. flood insurance / yr
- $507 – $1,088
Fire risk 5/10 · Moderate
- Est. fire insurance / yr
- $1,222 – $2,270
Heat risk 6/10 · Moderate
- Hot days now (above 109°F)
- 7 days/yr
- Hot days in 30 yrs
- 20 days/yr
Wind risk 4/10 · Minor
- Chance of severe wind over 30 yrs
- 17.0%
Air-quality risk 2/10 · Minimal
- Unhealthy air days now
- 2 days/yr
- Unhealthy air days in 30 yrs
- 2 days/yr
Risk factors via First Street. Map © Google.
Why this score? — see what drove the B- grade
The composite is a weighted blend of 9 inputs, each scored 0–100. Each bar is that input's sub-score; the figure is the points it added to the 100-point composite (weight × sub-score).
- Cash flow +30.0/30.0
- 1% rule +10.0/10.0
- DSCR +10.0/10.0
- ARV discount +7.5/15.0
- Schools +3.7/10.0
- Livability +3.7/5.0
- Rent growth +2.5/5.0
- Condition / age +2.5/5.0
- Appreciation +0.0/10.0
$84,250
🖨 Deal sheet 📄 Offer letter ✓ Due diligence
Listing remarks
Investor special with endless potential! This AS-IS property is ready for your vision and creativity. Whether you're looking for your next flip, rental investment, or renovation project, this home offers a great opportunity to add value. Features include a spacious layout, large lot, and solid bones with plenty of room for updates and customization. Conveniently located near schools, shopping, and major highways. Bring your tools and imagination — opportunities like this don’t last long!
Key facts
- Solid bones
- Large lot
- Room for updates
Tags
Property features AI
Finance
- Financial info: Listing terms include Cash and Conventional
- HOA & community: No homeowners association
Exterior
- Parking: Attached carport (covered, 1 space); Driveway
- Utilities: City sewer; City water; Electricity available; Not in a municipal utility district
- Home design: Single-family residence; One story; Residential property
- Construction: Built in 1940; Shingle roof; Pillar/post/pier foundation
- Exterior features: Fenced yard; Grassed and partially wooded vegetation; Corner lot; Shed(s); Easement for utilities
Interior
- Kitchen: Plumbed for gas in kitchen
- Bedrooms: 3 bedrooms (including a primary bedroom on the main level)
- Bathrooms: 1 full bathroom
- Interior features: Paneling; One living area; One dining area; Room count: 2
- Laundry & utility: Utility room
Neighborhood map
What this means for you Summary
Snapshot
- This is a 3-bed/1.0-bath single-family listed at $84k.
Deal economics
- At list price, monthly cash flow is $468 ($6k/yr) — positive.
- The deal already cash-flows at list — no discount required.
- Meets the 1% rule at list price ($1k rent vs $84k).
- Cap rate 13.0% vs local median 3.8% in Denison — top-decile yield for the area; either an underpriced asset or a hidden risk that comps aren't pricing in. Stress-test before assuming the spread holds.
Location & tenants
- Location reads 73/100 on livability (#221 in TX) — a middle-class / working-renter tenant base. Strengths: cost of living A+, housing A+, crime A; Watch: health & safety D+, amenities F, commute F.
- Denison ISD (urban): math 43% / reading 44% proficiency, ranked #315 of 826 in TX (top 38%) — families likely to look elsewhere, expect single-tenant / working-renter base with shorter leases.
- Zoned schools: Lamar El (math 37% / reading 32%, grade F, #1,995 of 4,322 statewide, top 50%, 478 students, 70% FRL) — zoned schools average 70% FRL vs 54% district-wide (16 pts higher); higher-poverty schools than district average — tighter screening recommended.
- Market conditions: 165 active listings in the ZIP; 40 comparable units currently listed for rent nearby; rentals lingering (median 44d on market — plan ~5-8 weeks vacancy on turnover, expect pricing pressure); 70% of comp listings sitting > 30 days — soft ceiling on asking rent; solid renter incomes; 2,272 units permitted in Grayson County in 2024 (750 in 5+ unit buildings).
Forward outlook
- Local home prices are declining (-3.0%/yr); year-one equity from $582 of loan paydown is wiped out by about $3k of value loss. Plan a longer hold.
- Grayson County population projected at +12% by 2050 — modest demand growth; plan on rents tracking national, not racing it.
- At projected returns (-3.0% appreciation + 3.0% rent growth), your $24k cash investment doubles in ~6 years — after that, you're playing with house money.
Negotiation context
- Only 14 days on market — expect competitive offers; lowballing is unlikely to land.
- 2 sale attempts with the ask held roughly flat each time — persistent listings suggest the price (not the market) is what's stuck; bring a comps-based counter.
Risks & watch-outs
- Watch-outs: property tax is 2.9% of price; built in 1940 — expect roof / HVAC / electrical / plumbing capex.
- Climate carrying-cost: moderate wildfire risk; extreme-heat days projected 7→20/yr by 2055 (HVAC capex compounding) — expect insurance premiums to compound above CPI over the hold.
Questions for the listing agent
- Built in 1940 — when were the roof, HVAC, electrical panel, plumbing, and water heater last replaced?
- Property tax is high relative to price — has the assessment been appealed recently, and will the sale trigger a re-assessment?
- Is there a deadline driving the sale (1031 exchange, divorce, estate, relocation)? That informs how much negotiation room exists.
- Schools are D-rated, which usually means shorter tenancies and higher turnover. Who's the typical renter profile here, and what's been the actual vacancy rate?
- What's the average days-on-market for RENTAL listings here right now (not sales)? A rising rental-DOM trend means longer vacancies and softer asking-rent achievability than the comps imply.
- What's the recent tenant-quality profile in this submarket — average credit score on applications, eviction rate, late-payment / NSF rate, and stable-employment percentage? A property-management company in the area should have these aggregated.
- How much new for-sale + rental construction is in the pipeline within 1–3 miles? Heavy new supply typically softens prices + rents 12–24 months out; constrained supply supports both.
Investment metrics
- 1% rule
- 1.73% ✓
- Cap rate
- 12.95%
- Cash-on-cash
- 23.78%
- DSCR
- 2.06
- GRM
- 4.8
CMA / ARV
- ARV (median comp)
- $224,416
- List price
- $84,250
- Delta
- -62.46%
- Verdict
- UNDERPRICED
- Comps
- 20 within 1.0 mi
Show comp detail 12 sales within ~0.75 mi
| Address | Dist | Beds/Ba | Sqft | Sold | Price | $/sf | Match |
|---|---|---|---|---|---|---|---|
| 510 E Shepherd St | 0.08mi | 3/2.0 | 1,042 (-10%) | 4mo | $184,900 | $177 | 73 |
| 110 E Munson St | 0.45mi | 2/1.0 (-1) | 1,197 (+4%) | 1mo | $129,900 | $109 | 67 |
| 519 E Gandy St | 0.63mi | 3/2.0 | 1,132 (-2%) | 1mo | $135,000 | $119 | 63 |
| 530 E Day St | 0.03mi | 3/2.0 | 1,320 (+14%) | 10mo | $224,999 | $170 | 62 |
| 111 W Murray St | 0.67mi | 2/1.0 (-1) | 1,176 (+2%) | 4mo | $72,500 | $62 | 58 |
| 1507 S 7th Ave | 0.68mi | 3/2.0 | 1,132 (-2%) | 7mo | $220,000 | $194 | 55 |
| 1110 S Houston Ave | 0.52mi | 2/1.0 (-1) | 1,060 (-8%) | 4mo | $72,500 | $68 | 54 |
| 622 E Heron St | 0.38mi | 3/2.0 | 1,320 (+14%) | 0mo | $193,500 | $147 | 54 |
| 1513 S 7th Ave | 0.61mi | 3/2.0 | 1,209 (+5%) | 8mo | $220,000 | $182 | 53 |
| 1501 S 7th Ave | 0.67mi | 3/2.0 | 1,208 (+5%) | 7mo | $220,000 | $182 | 51 |
| 732 E Bullock St | 0.71mi | 3/2.0 | 1,303 (+13%) | 1mo | $226,000 | $173 | 41 |
| 211 W Murray St | 0.74mi | 3/2.0 | 1,314 (+14%) | 7mo | $235,000 | $179 | 33 |
Match score weights: distance 35% · size 25% · config 20% · recency 20%. Top-matched comps best support the ARV.
Projected returns pro-forma
-3.0% appreciation · 3.0% rent growth · sell at horizon
- IRR
- 17.0%
- Equity multiple
- 1.69×
- Total profit
- $16,206
- Equity at exit
- $12,562
- IRR
- 25.6%
- Equity multiple
- 3.24×
- Total profit
- $52,789
- Equity at exit
- $7,284
Cash invested: $23,590 (down + closing). Projections, not guarantees.
Landlord ↔ Tenant lean methodology
- Overall (STATE)
- 87 Strongly Landlord-Friendly
- State Texas
- 87 Strongly Landlord-Friendly · R+5
- County
- — inherits STATE
- City
- — inherits STATE
ZIP-level market 75021
- Home prices YoY
- -17.3%
- Active inventory
- 165
- Price-to-rent
- 4.8×
Monthly cashflow live
- Estimated rent
- $1,453 high interval (Pro) →
- Mortgage (P&I)
- −$442
- Tax from tax record
- −$204 /mo · $2,446/yr
- Insurance
- −$35
- HOA
- −$0
- Vacancy / Maint / Mgmt
- −$305
- Net cashflow
- $468
Break-even live
UW: 25.0% down · 7.5% · 30yr · 1.5% tax · 5.0% vac · 8.0% maint · 8.0% mgmt
Financing live
Cash to close
- Down payment
- $21,062
- Closing costs
- $2,528
- Reserves months
- —
- Total cash needed
- —
Loan-product check · same deal, 3 products live
Conventional
25% down · 7.5% · 30yr
- Down + closing
- —
- Monthly P&I
- —
- Monthly cashflow
- —
- DSCR
- —
- Eligible?
- —
Personal DTI + credit; lowest rate.
DSCR
20% down · 8.5% · 30yr
- Down + closing
- —
- Monthly P&I
- —
- Monthly cashflow
- —
- DSCR
- —
- Eligible?
- —
No personal income docs; deal must DSCR.
Hard money
10% down · 12.0% · 12mo
- Down + closing
- —
- Monthly P&I
- —
- Monthly cashflow
- —
- DSCR
- —
- Eligible?
- —
Short-term bridge; refi at stabilization.
Rent comps 40 comps
| Address | Beds | Baths | Sqft | Rent | $/sqft | DOM | Units | Dist |
|---|---|---|---|---|---|---|---|---|
| 520 E Day St Denison, TX | 3.0 | 1.0 | 1072 | $1,225 | $1.14 | 20d | 1 | 0.06mi |
| 809 S Travis Ave Denison, TX | 3.0 | 2.0 | 1490 | $1,595 | $1.07 | 43d | 1 | 0.24mi |
| 327-329 E Nelson St #329 Denison, TX | 3.0 | 2.0 | 1382 | $1,625 | $1.18 | 43d | 1 | 0.29mi |
| 313 E Nelson St Denison, TX | 3.0 | 2.0 | 1279 | $1,625 | $1.27 | 20d | 1 | 0.33mi |
| 517 E Heron St Denison, TX | 3.0 | 2.0 | 1232 | $1,550 | $1.26 | 43d | 1 | 0.34mi |
| 509 E Heron St Denison, TX | 2.0 | 1.0 | 1324 | $1,250 | $0.94 | 43d | 1 | 0.34mi |
| 505 E Heron St Denison, TX | 2.0 | 1.0 | 1096 | $1,250 | $1.14 | 43d | 1 | 0.34mi |
| 507 E Heron St Denison, TX | 2.0 | 1.0 | 1096 | $1,250 | $1.14 | 43d | 1 | 0.35mi |
| 1309 S 5th Ave Unit 1311 Denison, TX | 3.0 | 2.5 | 1224 | $1,350 | $1.10 | 43d | 1 | 0.39mi |
| 1309 S 5th Ave #1309 Denison, TX | 3.0 | 2.5 | 1224 | $1,325 | $1.08 | 43d | 1 | 0.39mi |
| 709 E Crawford St Denison, TX | 2.0 | 2.5 | 1163 | $1,400 | $1.20 | 20d | 1 | 0.39mi |
| 1309 S 5th Ave Denison, TX | 3.0 | 2.5 | 1224 | $1,375 | $1.12 | 43d | 1 | 0.40mi |
| 500 E Main St Denison, TX | 3.0 | 2.0 | 1216 | $1,425 | $1.17 | 43d | 1 | 0.48mi |
| 114 E Hull St Denison, TX | 2.0 | 2.0 | 1279 | $1,450 | $1.13 | 43d | 1 | 0.48mi |
| 630 E Acheson St Denison, TX | 2.0 | 1.0 | 816 | $1,225 | $1.50 | 20d | 1 | 0.49mi |
| 523 E Hanna St Denison, TX | 3.0 | 2.0 | 1344 | $1,595 | $1.19 | 43d | 1 | 0.53mi |
| 120 E Monterey St Unit 120 Denison, TX | 2.0 | 1.0 | 800 | $900 | $1.12 | 44d | 1 | 0.53mi |
| 430 E Woodard St Denison, TX | 3.0 | 2.0 | 1263 | $1,590 | $1.26 | 43d | 1 | 0.55mi |
| 705 E Hanna St Denison, TX | 3.0 | 2.0 | 1314 | $1,600 | $1.22 | 43d | 1 | 0.57mi |
| 214 E Acheson St Denison, TX | 2.0 | 1.0 | 963 | $1,499 | $1.56 | 44d | 1 | 0.64mi |
| 519 E Gandy St Denison, TX | 3.0 | 2.0 | 1132 | $1,299 | $1.15 | 44d | 1 | 0.64mi |
| 224 W Hull St Unit A Denison, TX | 2.0 | 1.0 | 743 | $1,250 | $1.68 | 43d | 1 | 0.67mi |
| 632 E Sears St Denison, TX | 2.0 | 1.0 | 780 | $1,250 | $1.60 | 43d | 1 | 0.69mi |
| 537 E Sears St Denison, TX | 3.0 | 2.0 | 1146 | $1,599 | $1.40 | 20d | 1 | 0.71mi |
| 521 E Sears St Denison, TX | 4.0 | 2.0 | 1401 | $1,650 | $1.18 | 43d | 1 | 0.72mi |
| 713 E Sears St Denison, TX | 3.0 | 2.0 | 1230 | $1,475 | $1.20 | 20d | 1 | 0.73mi |
| 108 W Acheson St Denison, TX | 3.0 | 2.0 | 1056 | $1,550 | $1.47 | 43d | 1 | 0.75mi |
| 404 W Day St Denison, TX | 3.0 | 2.0 | 1057 | $1,500 | $1.42 | 20d | 1 | 0.79mi |
| 412 W Day St Denison, TX | 2.0 | 1.0 | 900 | $1,200 | $1.33 | 20d | 1 | 0.81mi |
| 1527 S Austin Ave Denison, TX | 1.0–2.0 | 1.0–1.5 | 850 | $999 | $1.18 | 20d | 2 | 0.85mi |
| 411 S Fannin Ave #411 Denison, TX | 3.0 | 2.5 | 1322 | $1,450 | $1.10 | 20d | 1 | 0.90mi |
| 526 W Munson St Denison, TX | 2.0 | 1.0 | 778 | $849 | $1.09 | 20d | 2 | 0.93mi |
| 526 W Munson St Unit 2 Denison, TX | 2.0 | 1.0 | 778 | $999 | $1.28 | 43d | 1 | 0.93mi |
| 131 E Bond St Denison, TX | 3.0 | 2.5 | 1192 | $1,250 | $1.05 | 43d | 1 | 0.95mi |
| 410 S Mirick Ave Denison, TX | 3.0 | 2.0 | 1100 | $1,300 | $1.18 | 43d | 1 | 0.96mi |
| 212 E Walker St Denison, TX | 3.0 | 2.0 | 1260 | $1,695 | $1.35 | 43d | 1 | 0.97mi |
| 105 E Bond St Denison, TX | 2.0 | 1.0 | 825 | $950 | $1.15 | 43d | 1 | 0.98mi |
| 610 W Owing St Denison, TX | 3.0 | 2.0 | 1108 | $1,395 | $1.26 | 43d | 1 | 1.01mi |
| 1931 Ave a Denison, TX | 4.0 | 3.0 | 1450 | $1,695 | $1.17 | 43d | 1 | 1.01mi |
| 514 N Rusk Ave Unit 516 Denison, TX | 3.0 | 2.0 | 1173 | $1,375 | $1.17 | 20d | 1 | 1.03mi |
Listing history 12 events
-
2026-06-19days on market $84,250 Active 14 DOM
-
2026-06-18days on market $84,250 Active 13 DOM
-
2026-06-17days on market $84,250 Active 12 DOM
-
2026-06-16days on market $84,250 Active 11 DOM
-
2026-06-15days on market $84,250 Active 10 DOM
-
2026-06-14days on market $84,250 Active 8 DOM
-
2026-06-13status $84,250 Active 7 DOM
-
2026-05-14status Pending 504-char remark
-
2026-05-07$84,250 Active 504-char remark
-
2025-08-13soldstatus
-
2009-03-02soldstatus
-
1998-12-28soldstatus
ⓘ Source: listings_history table (triggers on properties + properties_extension) + one-shot
backfill from property_details.listing_events for pre-trigger history.
Tax reassessment forecast TX · Resets to sale price
- Current annual tax
- $2,446 · $204/mo
- Projected year-2 tax
- $2,446 · $204/mo
- Expected delta
- $0/yr ($0/mo · 0.0%)
ⓘ Screening estimate from a state-policy table — verify with the county assessor before closing.
Climate risk First Street
- Flood 1/10 Low FEMA zone X (unshaded) · 0% chance over 30 yrs
- Wildfire 5/10 Major
- Heat 6/10 Major 7 d/yr ≥109°F today · 20 d/yr by 30 yrs out
- Wind 4/10 Moderate 17% chance of damaging wind over 30 yrs
- Air quality 2/10 Low 2 unhealthy d/yr today · 2 by 30 yrs out
Nearby sold comps map
Loading sold comps map…
Walkable amenities ~0.75 mi
Loading nearby amenities…
Taxation est. · year 1
- Rental income
- $17,442
- − Mortgage interest
- −$4,719
- − Property taxes
- −$2,446
- − Insurance
- −$421
- − Repairs & maintenance
- −$1,395
- − Management
- −$1,395
- − Depreciation
- −$2,451
- Taxable income
- $4,614
- Est. tax owed @ 24.0%
- −$1,107
- After-tax cash flow
- $4,503/yr
For passive investors: Depreciation is non-cash, so a rental often shows a tax loss while cash-flowing — sheltering income. Rental losses are passive: they offset passive income freely, and up to $25,000/yr can offset ordinary (W-2) income if you actively participate and your MAGI is under $100k (phasing out to $0 by $150k); unused losses carry forward. On sale, claimed depreciation is recaptured at up to 25%, and gains may owe capital-gains tax (a 1031 exchange can defer both). Figures are a year-1 estimate at your 24.0% rate — not tax advice; consult a CPA.
Schools (NCES district)
- District
- Denison ISD
- NCES district ID
- 4816710
- Math proficiency
- 43% ▼ -7.00%
- Reading proficiency
- 44% ▼ -3.00%
- Median HH income
- $41,650
- Composite
- 36.6/100
- National rank
- #4629
- State rank
- #315 of 826 in TX
Livability — Denison
- Score
- 73/100
- State rank
- #221
- US rank
- #5428
Category grades
Schools grade is shown separately in the Schools card above.
Census & demographics
- Census place
- Denison, TX
- County
- Grayson County · 108,053 people
- City population
- 34,008
- Metro
- Sherman-Denison, TX
- Population (ZIP)
- 9,173
- Household income
- $83,067
- Rent vs Own
- Severe rent burden
- 124.0
Population outlook (Grayson County) Hauer SSP2
- Today (2025)
- 134,540 people
- By 2030
- 138,653 · +3.1%
- By 2040
- 145,958 · +8.5%
- By 2050
- 151,218 · +12.4%
- By 2075
- 161,802 · +20.3%
- By 2100
- 159,036 · +18.2%
Race, ethnicity, and origin ACS 2023
- Neighborhood character
- Predominantly White (81%)
- Race & ethnicity
- White 81% Hispanic / Latino 11% Two or more races 9% Black 2% Asian 1%
- Hispanic origin (detail)
- Mexican 10%
- Common ancestry
- Iranian 3% Italian 2% Lithuanian 1%
- Foreign-born
- 5% · Canada
- Languages at home
- 91% English-only · Spanish 8% Other Indo-European 1%
Political lean MEDSL · Grayson
- 2024 margin
- Solid R (+54.3) · D 22.5% · R 76.7%
- 2008→2024 swing
- -16.4pp toward R · 2008: -37.9pp · 2024: -54.3pp
- All cycles
- 2024: R+54.3 2020: R+49.9 2016: R+53.1 2012: R+48.0 2008: R+37.9
Not yet ingested
- Civics
- —
Market trends
- HPI YoY
- ▼ -59.91%
- Current HPI
- 285.7502
- Rent YoY
- —
- Metro
- Sherman-Denison, TX
- State GDP YoY
- ▲ 3.95%
- F500 in state
- 110
Industry mix (Fortune 500 HQ in TX)
| Industry | F500 HQs | Revenue |
|---|---|---|
| Energy | 16 | $1,198B |
|
||
| Technology | 5 | $198B |
|
||
| Engineering / Construction | 4 | $72B |
|
||
| Energy Services | 3 | $60B |
|
||
| Utilities | 3 | $41B |
|
||
| Healthcare | 2 | $330B |
|
||
Price history
6 events — show timeline
- 2026-06-12 Relisted — NTREIS
- 2026-05-14 Pending — NTREIS
- 2026-05-07 Listed $84,250 NTREIS
- 2025-08-13 Sold (Public Records) — Public Records
- 2009-03-02 Sold (Public Records) — Public Records
- 1998-12-28 Sold (Public Records) — Public Records
Property tax history
+6.3%/yrLatest (2025): $2,446 · +9.8% YoY. Source: county tax records.
Cash-flow waterfall
monthlySold comps — $/sqft
last 12 mo · ≤1 miLoading sold comps…